

Towards integration of 64Cu-DOTA-trastuzumab PET-CT and MRI with mathematical modeling to predict response to neoadjuvant therapy in HER2 + breast cancer
- PMID: 33239688
- PMCID: PMC7688955
- DOI: 10.1038/s41598-020-77397-0
Towards integration of 64Cu-DOTA-trastuzumab PET-CT and MRI with mathematical modeling to predict response to neoadjuvant therapy in HER2 + breast cancer
Abstract
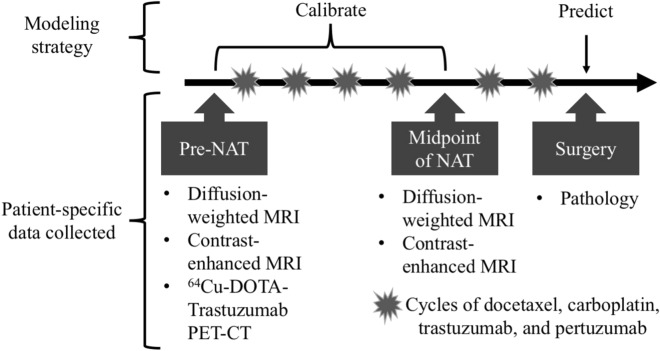
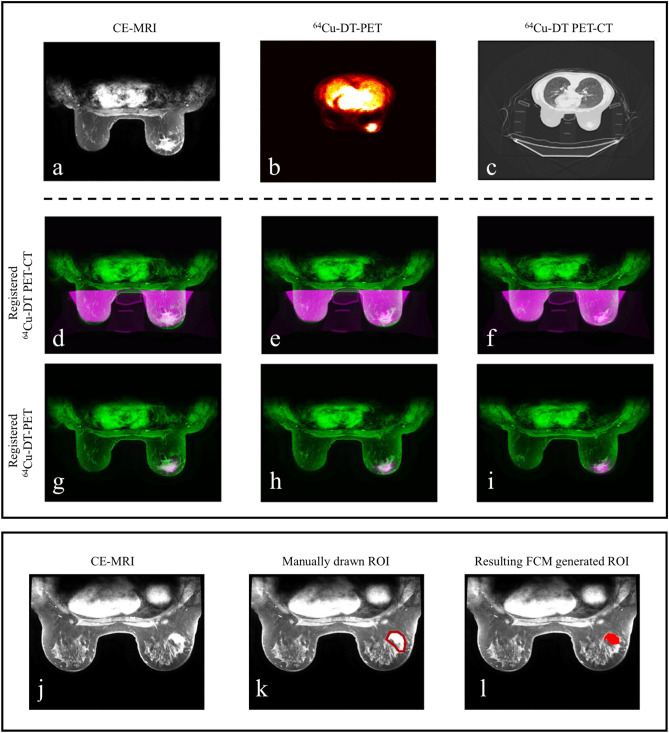
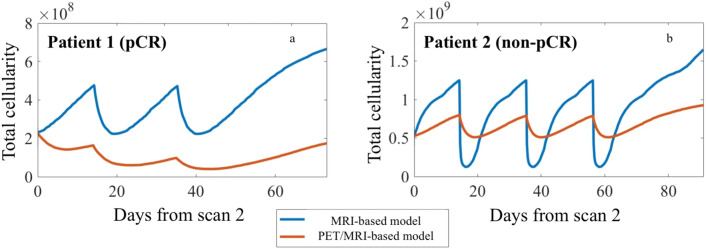
While targeted therapies exist for human epidermal growth factor receptor 2 positive (HER2 +) breast cancer, HER2 + patients do not always respond to therapy. We present the results of utilizing a biophysical mathematical model to predict tumor response for two HER2 + breast cancer patients treated with the same therapeutic regimen but who achieved different treatment outcomes. Quantitative data from magnetic resonance imaging (MRI) and 64Cu-DOTA-trastuzumab positron emission tomography (PET) are used to estimate tumor density, perfusion, and distribution of HER2-targeted antibodies for each individual patient. MRI and PET data are collected prior to therapy, and follow-up MRI scans are acquired at a midpoint in therapy. Given these data types, we align the data sets to a common image space to enable model calibration. Once the model is parameterized with these data, we forecast treatment response with and without HER2-targeted therapy. By incorporating targeted therapy into the model, the resulting predictions are able to distinguish between the two different patient responses, increasing the difference in tumor volume change between the two patients by > 40%. This work provides a proof-of-concept strategy for processing and integrating PET and MRI modalities into a predictive, clinical-mathematical framework to provide patient-specific predictions of HER2 + treatment response.
Conflict of interest statement
The authors declare no competing interests.
Figures


Similar articles
-
Functional imaging of human epidermal growth factor receptor 2-positive metastatic breast cancer using (64)Cu-DOTA-trastuzumab PET.J Nucl Med. 2014 Jan;55(1):23-9. doi: 10.2967/jnumed.113.122630. Epub 2013 Dec 12. J Nucl Med. 2014. PMID: 24337604 Free PMC article.
-
64Cu-DOTA-trastuzumab PET imaging in patients with HER2-positive breast cancer.J Nucl Med. 2013 Nov;54(11):1869-75. doi: 10.2967/jnumed.112.118612. Epub 2013 Sep 12. J Nucl Med. 2013. PMID: 24029656
-
18F-fluorodeoxyglucose (FDG) PET/CT after two cycles of neoadjuvant therapy may predict response in HER2-negative, but not in HER2-positive breast cancer.Oncotarget. 2015 Oct 6;6(30):29388-95. doi: 10.18632/oncotarget.5001. Oncotarget. 2015. PMID: 26336821 Free PMC article.
-
Exploring utilities of [ 64 Cu]Cu-DOTA-trastuzumab immunoPET in breast cancer: a systematic review and meta-analysis.Nucl Med Commun. 2025 Apr 1;46(4):277-284. doi: 10.1097/MNM.0000000000001949. Epub 2025 Jan 21. Nucl Med Commun. 2025. PMID: 39834168
-
Individualizing Curative-Intent Therapy in HER2-Positive Early-Stage Breast Cancer.Curr Treat Options Oncol. 2023 May;24(5):479-495. doi: 10.1007/s11864-023-01070-7. Epub 2023 Mar 30. Curr Treat Options Oncol. 2023. PMID: 36995527 Review.
Cited by
-
Recent Advances in Brachytherapy Using Radioactive Nanoparticles: An Alternative to Seed-Based Brachytherapy.Front Oncol. 2021 Nov 24;11:766407. doi: 10.3389/fonc.2021.766407. eCollection 2021. Front Oncol. 2021. PMID: 34900715 Free PMC article. Review.
-
Assessment and Prediction of Response to Neoadjuvant Chemotherapy in Breast Cancer: A Comparison of Imaging Modalities and Future Perspectives.Cancers (Basel). 2021 Jul 14;13(14):3521. doi: 10.3390/cancers13143521. Cancers (Basel). 2021. PMID: 34298733 Free PMC article. Review.
-
Cancer cell sedimentation in 3D cultures reveals active migration regulated by self-generated gradients and adhesion sites.PLoS Comput Biol. 2024 Jun 11;20(6):e1012112. doi: 10.1371/journal.pcbi.1012112. eCollection 2024 Jun. PLoS Comput Biol. 2024. PMID: 38861575 Free PMC article.
-
Advances and challenges in immunoPET methodology.Front Nucl Med. 2024 Feb 19;4:1360710. doi: 10.3389/fnume.2024.1360710. eCollection 2024. Front Nucl Med. 2024. PMID: 39355220 Free PMC article. Review.
-
Math, magnets, and medicine: enabling personalized oncology.Expert Rev Precis Med Drug Dev. 2021;6(2):79-81. doi: 10.1080/23808993.2021.1878023. Epub 2021 Jan 27. Expert Rev Precis Med Drug Dev. 2021. PMID: 34027102 Free PMC article. No abstract available.
References
Publication types
MeSH terms
Substances
Grants and funding
LinkOut - more resources
Full Text Sources
Medical
Research Materials
Miscellaneous
