. 2020 Nov 25;10(1):20528.
doi: 10.1038/s41598-020-77042-w.

The cochlear ear horn: geometric origin of tonotopic variations in auditory signal processing

Affiliations

The cochlear ear horn: geometric origin of tonotopic variations in auditory signal processing

Alessandro Altoè et al. Sci Rep. .

Abstract

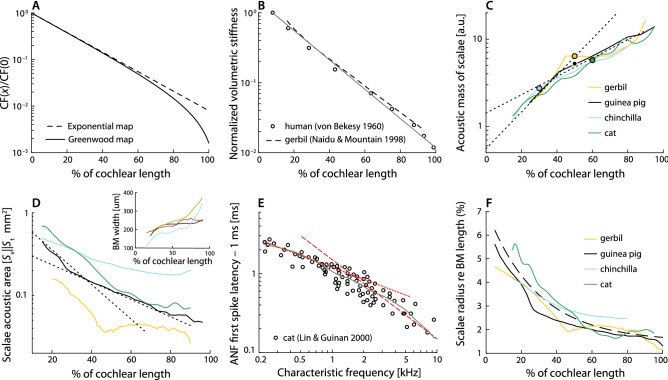
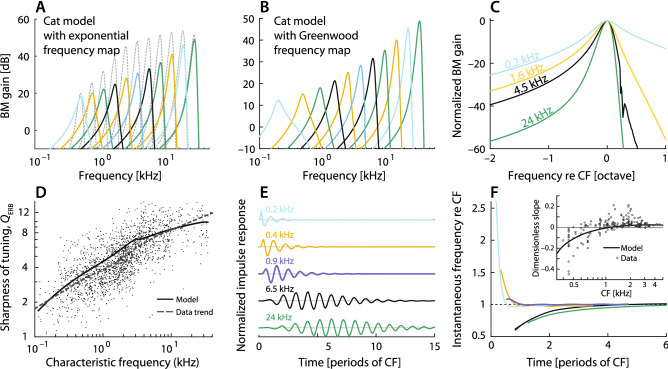
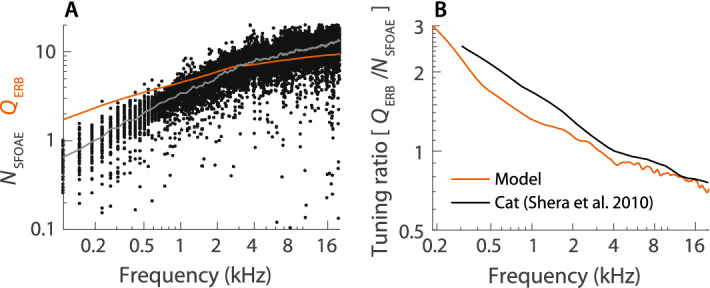
While separating sounds into frequency components and subsequently converting them into patterns of neural firing, the mammalian cochlea processes signal components in ways that depend strongly on frequency. Indeed, both the temporal structure of the response to transient stimuli and the sharpness of frequency tuning differ dramatically between the apical and basal (i.e., the low- and high-frequency) regions of the cochlea. Although the mechanisms that give rise to these pronounced differences remain incompletely understood, they are generally attributed to tonotopic variations in the constituent hair cells or cytoarchitecture of the organ of Corti. As counterpoint to this view, we present a general acoustic treatment of the horn-like geometry of the cochlea, accompanied by a simple 3-D model to elucidate the theoretical predictions. We show that the main apical/basal functional differences can be accounted for by the known spatial gradients of cochlear dimensions, without the need to invoke mechanical specializations of the sensory tissue. Furthermore, our analysis demonstrates that through its functional resemblance to an ear horn (aka ear trumpet), the geometry of the cochlear duct manifests tapering symmetry, a felicitous design principle that may have evolved not only to aid the analysis of natural sounds but to enhance the sensitivity of hearing.


Conflict of interest statement

The authors declare no competing interests.

Figures

Figure 1
Figure 1
(A) Example tonotopic maps for the mammalian cochlea computed using Eq. (2) for the Greenwood function with parameters γ=0.8 (solid line) and γ=0 (dashed; purely exponential). In many species, the tonotopic map shows a pronounced downward bend in the apex. (B) Longitudinal variation of CP stiffness in human and gerbil. For comparison, the thin solid line shows the exponential map from panel A. (C) Estimated spatial variation of the acoustic mass, m¯(x), of the scalae fluids in four species (solid lines) derived from published morphological data and arbitrarily scaled to emphasize the similarity of their spatial dependence. For comparison, the dotted lines show the exponential curves ex/ and ex/2 (i.e., the reciprocal of the exponential map in panel A and its square root, respectively). The open symbols indicate the approximate location of the apical-basal transition (CFa|b) in each species,. (D) Effective acoustic cross-sectional areas of the scalae [SvSt/(Sv+St)] as a function of location in various species. For comparison, the dotted lines show the exponential curves e-x/ and e-x/2 (i.e., the exponential map in panel A and its square root, respectively). The inset shows the estimated BM widths employed to compute the acoustic mass of the scalae in panel C. (E) Wave-front delay in the apex of the cat cochlea, as estimated by subtracting 1 ms from the ANF first-spike latency of the response to acoustic clicks (Fig. 6A of Ref. 27). (Two anomalous data points with delay close to zero are not shown.) The gray line shows the loess trend line, while the dashed and dotted red lines are curves with slopes matching 1/CF(x) and 1/CF1/2(x), respectively. (F) Variation of the radius (h) of the scalae along the cochlea in several species, normalized to the cochlea length. The radius was estimated by fitting a circle to the total area of the scalae in all species but the cat, where the radius was estimated as the average of the scala vestibuli and scala tympani height. The dashed line represents the equation h(x)/L=0.0475e-x/2+0.015, which captures the overall variation of h(x) in the different species. Data in panels C,D and F were calculated from data in gerbil,, in chincilla,, in guinea pig,, and in cat,.
Figure 2
Figure 2
In the tail region of the traveling wave, the horn-like tapering of the cochlear duct boosts the intensity of the traveling wave, compensating for the spatial decay of transpartition pressure that arises from the progressive decline of CP stiffness. In a hypothetical box cochlea (dotted lines), by contrast, the wave power is dispersed throughout the larger fluid volume.
Figure 3
Figure 3
(A,B) Model BM gain functions (BM velocity vs frequency re input pressure at the base) at several locations for the model of the cat cochlea when the tonotopic map is assumed either purely exponential (A) or of the Greenwood type (B, Eq. (2) with γ=0.8). Whereas the colored curves in panels (A,B) represent gain functions calculated in a tapered cochlear model, the grey curves in (A) show results for a box model where the cross-sectional area of the duct is assumed constant along the cochlea. (C) Gain functions from panel B normalized and plotted versus frequency re CF to emphasize the variation of cochlear tuning along the cochlea. (D) Comparison between the model variation in the sharpness of mechanical frequency tuning along the cochlea (measured in QERB) and estimates obtained from cat ANF recordings. (E) Model BM click responses at multiple CF locations. (F) Instantaneous frequencies (normalized to CF) of the click responses from panel E. The inset compares the dimensionless glide slope, defined as the time rate of change of the instantaneous frequency near the peak of the click-response envelope, normalized by the square of the local CF, to values obtained from the cat auditory nerve,.
Figure 4
Figure 4
(A) Model SFOAE delays NSFOAE. Dots indicate individual simulations and the gray line represents their median at each frequency. For comparison, the red line plots QERB from Fig. 3D at the corresponding CFs. SFOAEs were simulated in 128 different “ears” by introducing small random irregularities in the partition admittance [methods detailed in]. (B) Comparison between the model tuning ratio (QERB/NSFOAE) and that obtained from otoacoustic and neural data in cat (Fig. 9 of Ref. 7).

References

    1. Liberman MC. Auditory-nerve response from cats raised in a low-noise chamber. J. Acoust. Soc. Am. 1978;63:442–455. doi: 10.1121/1.381736. - DOI - PubMed
    1. Rhode WS, Cooper NP. Nonlinear mechanics in the apical turn of the chinchilla cochlea in vivo. Aud. Neurosci. 1996;3:101–121.
    1. Temchin AN, Rich NC, Ruggero MA. Threshold tuning curves of chinchilla auditory-nerve fibers. I. Dependence on characteristic frequency and relation to the magnitudes of cochlear vibrations. J. Neurophysiol. 2008;100:2889–2898. doi: 10.1152/jn.90637.2008. - DOI - PMC - PubMed
    1. Carney LH, McDuffy MJ, Shekhter I. Frequency glides in the impulse responses of auditory-nerve fibers. J. Acoust. Soc. Am. 1999;105:2384–2391. doi: 10.1121/1.426843. - DOI - PubMed
    1. Recio-Spinoso A, Temchin AN, Van Dijk P, Fan Y-H, Ruggero MA. Wiener-kernel analysis of responses to noise of chinchilla auditory-nerve fibers. J. Neurophysiol. 2005;93:3615–3634. doi: 10.1152/jn.00882.2004. - DOI - PubMed

Publication types