. 2020 Nov 25;10(1):20514.
doi: 10.1038/s41598-020-76873-x.

Deeper waters are changing less consistently than surface waters in a global analysis of 102 lakes

Affiliations

Deeper waters are changing less consistently than surface waters in a global analysis of 102 lakes

Rachel M Pilla et al. Sci Rep. .

Abstract

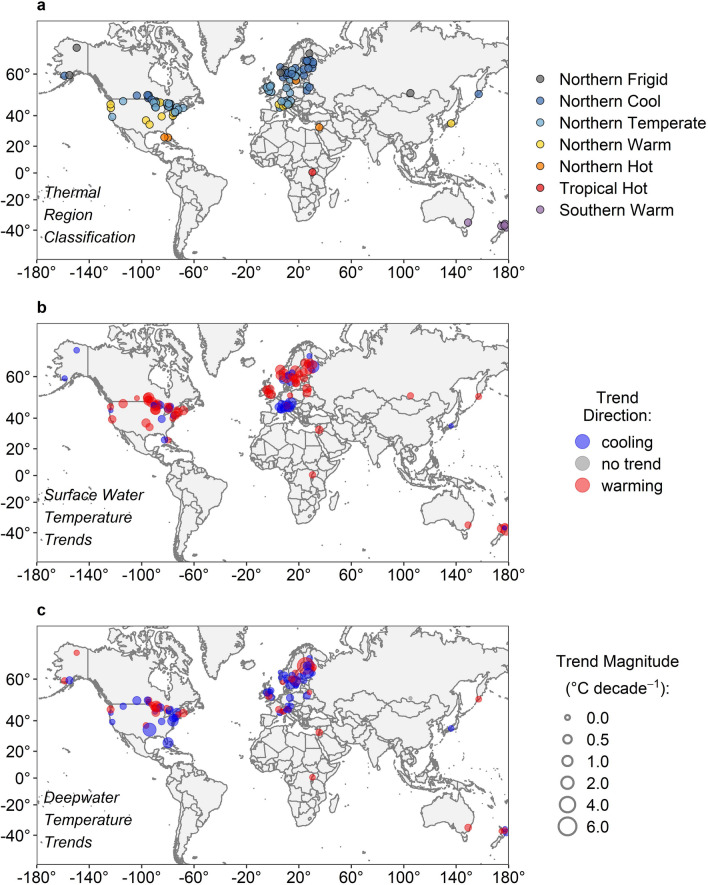
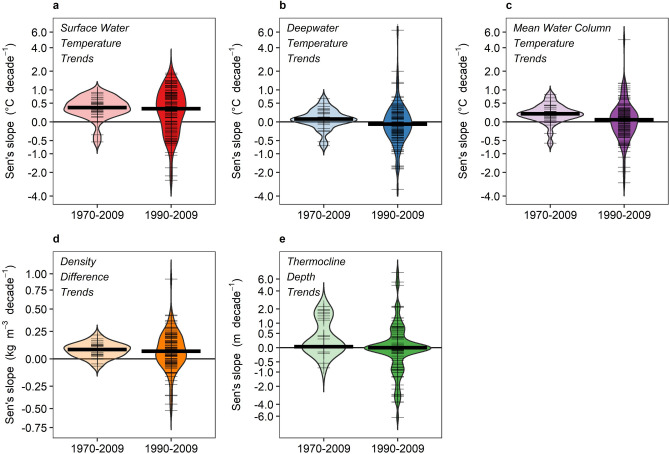
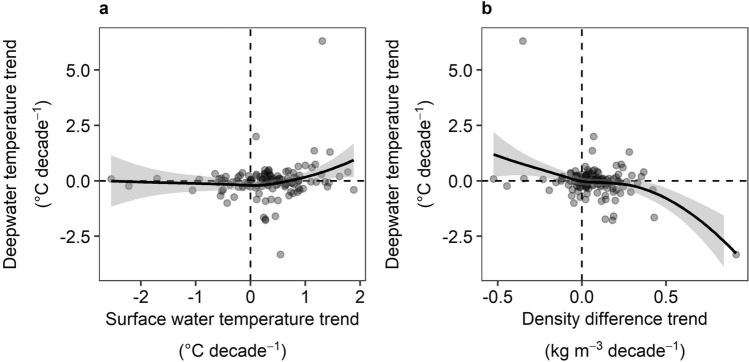
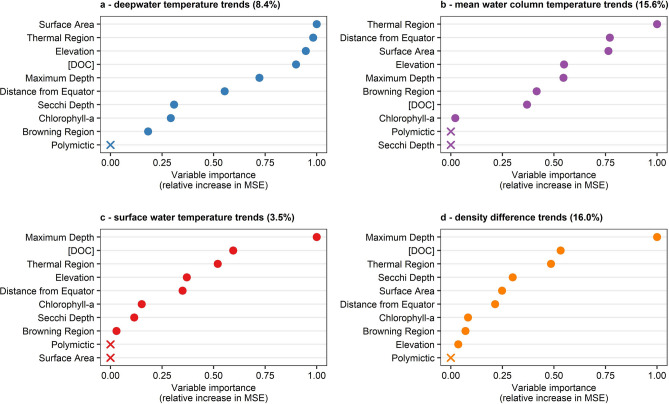
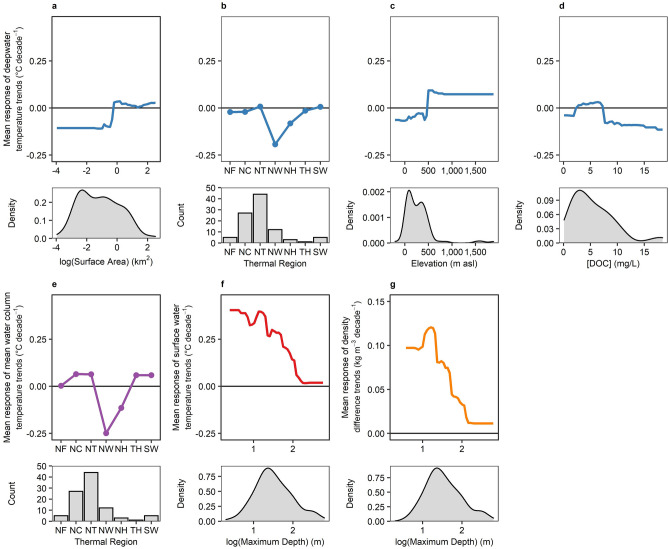
Globally, lake surface water temperatures have warmed rapidly relative to air temperatures, but changes in deepwater temperatures and vertical thermal structure are still largely unknown. We have compiled the most comprehensive data set to date of long-term (1970-2009) summertime vertical temperature profiles in lakes across the world to examine trends and drivers of whole-lake vertical thermal structure. We found significant increases in surface water temperatures across lakes at an average rate of + 0.37 °C decade-1, comparable to changes reported previously for other lakes, and similarly consistent trends of increasing water column stability (+ 0.08 kg m-3 decade-1). In contrast, however, deepwater temperature trends showed little change on average (+ 0.06 °C decade-1), but had high variability across lakes, with trends in individual lakes ranging from - 0.68 °C decade-1 to + 0.65 °C decade-1. The variability in deepwater temperature trends was not explained by trends in either surface water temperatures or thermal stability within lakes, and only 8.4% was explained by lake thermal region or local lake characteristics in a random forest analysis. These findings suggest that external drivers beyond our tested lake characteristics are important in explaining long-term trends in thermal structure, such as local to regional climate patterns or additional external anthropogenic influences.


Conflict of interest statement

The authors declare no competing interests.

Figures

Figure 1
Figure 1
Map of the 102 lakes included in this analysis. Panels indicate (a) the thermal region classification for all lakes, and trends for (b) surface water temperature and (c) deepwater temperature. Panels (b,c) have a common legend, where point colour represents trend direction (red = warming, blue = cooling), and point size represents trend magnitude. Regions with high densities of lakes have had their exact latitude and longitude slightly shifted for visual clarity. Maps were generated in R version 3.5.0, and with world map data from the “ggplot2” R package.
Figure 2
Figure 2
Distribution of trends in thermal metrics across lakes. Paired violin plots of temporal trends in five lake thermal metrics from 1970–2009 (left of each panel) and from 1990–2009 (right of each panel): (a) surface water temperature, (b) deepwater temperature, (c) mean water column temperature, (d) density difference, and (e) thermocline depth. Note that y-axes are log-transformed based on the transformation in Eq. (2). Thick horizontal line indicates the median for the respective time period, and thin tick marks indicate trends for individual lakes. Panels (ac) are all on the same y-axis scale.
Figure 3
Figure 3
Relationships between deepwater temperature trends vs. surface water temperature trends and density difference trends across lakes. No significant relationship was found between deepwater temperature trends vs. surface water temperature trends (a; τ = 0.09, p = 0.12), or vs. density difference trends (b; τ = − 0.08, p = 0.17). Smoothed line is a LOESS line with 95% interval bands. Dashed lines indicate the zeroes on the x- and y-axes.
Figure 4
Figure 4
Relative variable importance plots from random forest analysis for thermal metric trends. Relative variable importance for (a) deepwater temperature trends, (b) mean water column temperature trends, (c) surface water temperature trends, and (d) density difference trends. Solid circles in each panel indicate the relative increase in mean squared error (MSE) due to a random permutation compared to the most important variable, in order of decreasing importance. Variables marked with “X” had no increase in MSE and are statistically equivalent to random prediction. Random forest for thermocline depth resulted in 0% explanatory power, so no additional analysis was conducted.
Figure 5
Figure 5
Partial dependency plots of the most important variables from random forest analysis for thermal metric trends. In each lettered panel, the upper plot shows the mean response of each thermal metric vs. the predictor variable, with density distribution plots showing the observed range of the respective predictor variable in the lower plot. Deepwater temperature trends had four variables that were approximately equally important (ad). Mean water column temperature trends (e), surface water temperature trends (f), and density difference trends (g) each had one variable that was clearly most important. Upper plots for (a) through (f) are all on the same y-axis scale. Horizontal lines mark zero, where responses greater than zero predict increasing trends and responses less than zero predict decreasing trends. Note that x-axes for surface area (a) and maximum depth (f,g) are on logarithmic scales. All density distribution plots follow the same x-scale as the corresponding partial dependency plot.

References

    1. Hambright KD, Gophen M, Serruya S. Influence of long-term climatic changes on the stratification of a subtropical, warm monomictic lake. Limnol. Oceanogr. 1994;39:1233–1242. doi: 10.4319/lo.1994.39.5.1233. - DOI
    1. Pilla RM, et al. Browning-related decreases in water transparency lead to long-term increases in surface water temperature and thermal stratification in two small lakes. J. Geophys. Res. Biogeo. 2018 doi: 10.1029/2017JG004321. - DOI
    1. Foley B, Jones ID, Maberly SC, Rippey B. Long-term changes in oxygen depletion in a small temperate lake: Effects of climate change and eutrophication. Freshwater Biol. 2012;57:278–289. doi: 10.1111/j.1365-2427.2011.02662.x. - DOI
    1. Knoll LB, et al. Browning-related oxygen depletion in an oligotrophic lake. Inland Waters. 2018 doi: 10.1080/20442041.2018.1452355. - DOI
    1. O'Reilly CM, Alin SR, Plisnier P-D, Cohen AS, McKee BA. Climate change decreases aquatic ecosystem productivity of Lake Tanganyika Africa. Nature. 2003;424:766–768. doi: 10.1038/nature01833. - DOI - PubMed

Publication types