. 2020 Nov 25;3(1):696.
doi: 10.1038/s42003-020-01398-y.

Genomic retargeting of p53 and CTCF is associated with transcriptional changes during oncogenic HRas-induced transformation

Affiliations

Genomic retargeting of p53 and CTCF is associated with transcriptional changes during oncogenic HRas-induced transformation

Michal Schwartz et al. Commun Biol. .

Abstract

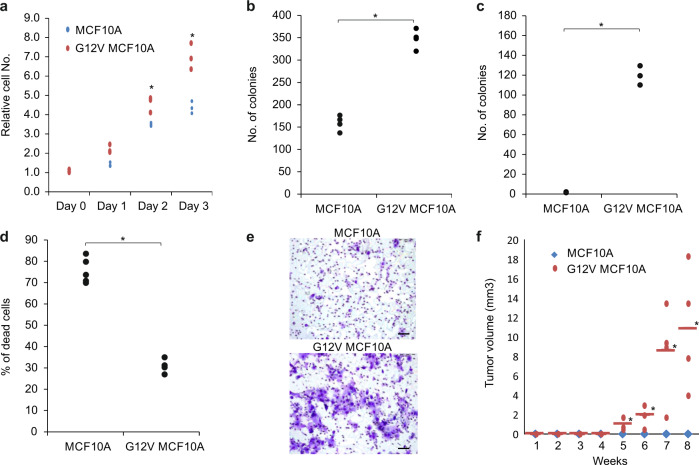
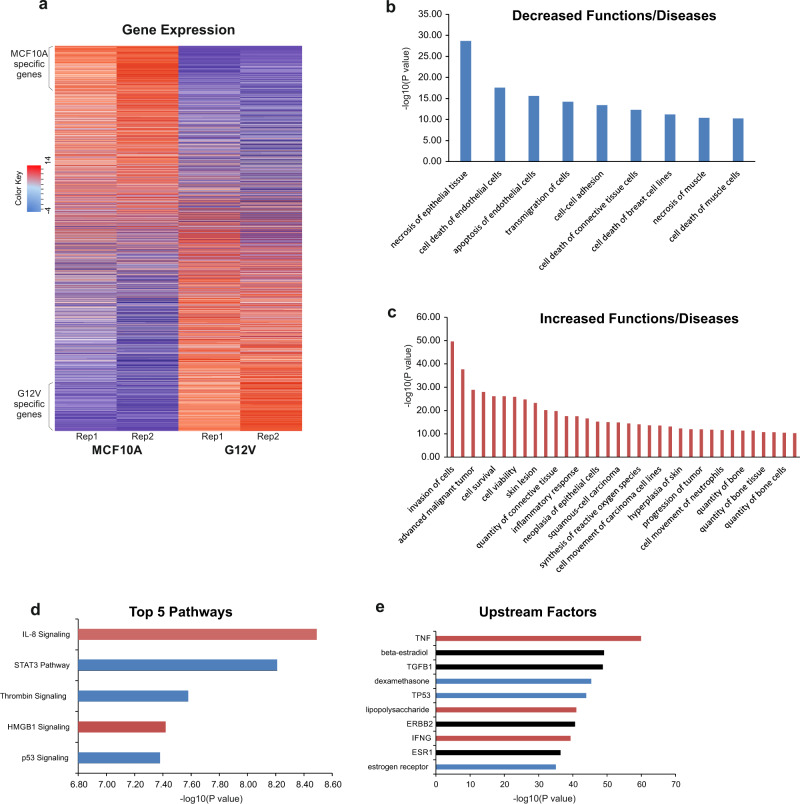
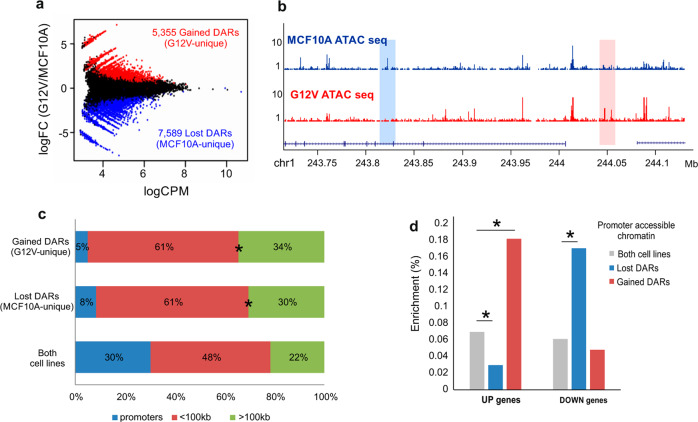
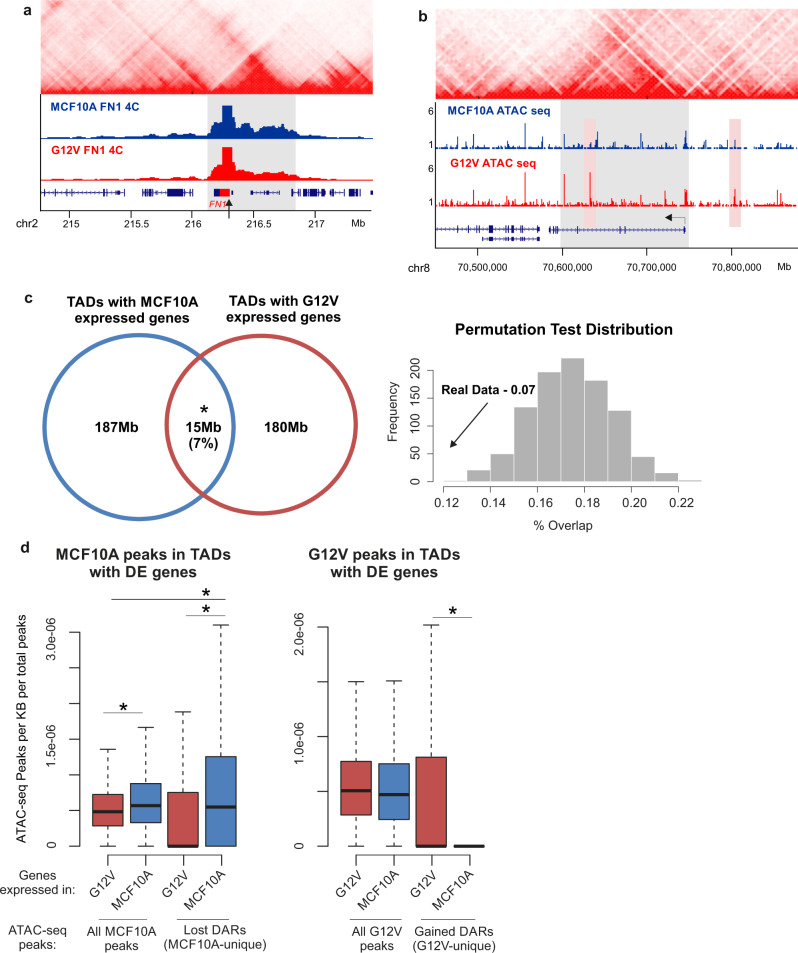
Gene transcription is regulated by distant regulatory elements via combinatorial binding of transcription factors. It is increasingly recognized that alterations in chromatin state and transcription factor binding in these distant regulatory elements may have key roles in cancer development. Here we focused on the first stages of oncogene-induced carcinogenic transformation, and characterized the regulatory network underlying transcriptional changes associated with this process. Using Hi-C data, we observe spatial coupling between differentially expressed genes and their differentially accessible regulatory elements and reveal two candidate transcription factors, p53 and CTCF, as determinants of transcriptional alterations at the early stages of oncogenic HRas-induced transformation in human mammary epithelial cells. Strikingly, the malignant transcriptional reprograming is promoted by redistribution of chromatin binding of these factors without major variation in their expression level. Our results demonstrate that alterations in the regulatory landscape have a major role in driving oncogene-induced transcriptional reprogramming.


Conflict of interest statement

The authors declare no competing interests.

Figures

Fig. 1
Fig. 1. Characterization of G12V cells.
a Cell proliferation was measured by XTT assay. The relative number of cells, compared to day 0 is presented for MCF10A (blue line) and G12V cells (red line). b Cell survival was measured by colony formation assay. The number of colonies counted after 2 weeks of MCF10A and G12V cells are presented. c Anchorage-independent growth was measured by soft agar assay. The number of colonies formed for MCF10A and G12V cells is presented. d Resistance to anoikis was measured by anchorage-independent cell death assay. The percentage of cell death for MCF10A and G12V cells is presented. e Representative images of Boyden Chamber Matrigel invasion assay of MCF10A and G12V MCF10A cells (bar = 50 µm). f Tumor growth curve of mammary fat pad tumors in Nod-SCID mice injected with either MCF10A or G12V cells. Horizontal bars represent average. *indicates p < 0.05 T-test of at least three independent replicates.
Fig. 2
Fig. 2. Transcriptional reprogramming induced by the G12V HRas oncogene.
a Heatmap showing gene expression of genes in MCF10A and G12V cells from two replicas. Rows were first ordered based on log2 fold change and then by expression value. b, c Functions and Diseases enriched in down-regulated genes (b) and up-regulated genes (c) with a log10 pVal >10. d Top five significantly affected pathways according to the DE genes. e Top 10 upstream factors which can explain the changes in gene expression. Red - Predicted activation; Blue- Predicted inhibition; Black- No specific direction of activity. Analysis in be was done using the Ingenuity Pathway Analysis software.
Fig. 3
Fig. 3. G12V HRas induced changes in the transcription regulatory landscape.
a MA plot displaying the mean normalized counts (Counts Per Million (CPM), x-axis) versus the log 2 fold change between MCF10A and G12V cells (y-axis), of the ATAC seq peaks. Red and blue points represent unique G12V (gained DARs) and unique MCF10A peaks (lost DARs), respectively, as declared by MACS analysis. b Representative examples of lost (blue box) or gained (pink box) DARs. Chromosomal coordinates in Mb of human hg19 genome build are indicated at the bottom. c Distribution of regulatory sites relatively to genes: promoter-proximal (+500 bp, −1000 bp from the gene’s transcription start site (TSS), blue), mid-range (±100 kb, red) and far-range (green) in gained or lost DARs or accessible regions shared by both cell types. *p < 0.001, proportional test. d % of regulatory sites near promoters of up-regulated genes in G12V cells (UP genes) or down-regulated genes in G12V cells (DOWN genes) from total regulatory sites near promoters. *p < 0.001, proportional test.
Fig. 4
Fig. 4. TADs as the spatial framework of transcriptional regulation.
a Example of 4C-seq profile of the down-regulated FN1 gene (marked with black arrow) in MCF10A (blue track) and G12V cells (red track) showing there are no changes in FN1 domain (marked with gray box) borders after transformation. Hi-C data from GM12878 is shown on the top. Chromosomal coordinates in Mb of human hg19 genome build are indicated at the bottom. b Example for a domain of an up-regulated gene, SLCO5A1, (marked with a gray box, TSS marked with black arrow) as defined from Hi-C data (shown on top,) and the ATAC-seq data in MCF10A and G12V cells. Right pink box indicates a unique regulatory site relatively close to the TSS which is outside of the TAD and the left pink box indicates a further away regulatory site that is within the TAD. Chromosomal coordinates in Mb of human hg19 genome build are indicated at the bottom. c Left- Venn diagram showing the overlap in Mb between the domains of down-regulated (MCF10A-specific) genes and up-regulated (G12V-specific) genes after HRas transformation. *p < 0.001, permutation test. Right- histogram showing permutation test results for the degree of overlap between up-regulated and down-regulated genes in the same TAD. Real overlap (shown with an arrow) is significantly lower than the overlap expected given random distribution. d Boxplots showing ATAC-seq peak density in domains of up- (red) or down-regulated genes (blue). Left – MCF10A regulatory sites, right- G12V regulatory sites. *p < 0.01, Wilcox test.
Fig. 5
Fig. 5. CTCF motif and binding sites are enriched in gained DARs.
a Top motifs enriched in gained DARs within TADs of up- or down-regulated genes. Background group is the lost DARs. b Expression levels of CTCF in MCF10A (blue) and G12V (red) cells determined by RNA-seq. Data points and average (bar graph) are presented. p-value determined by DESeq2 - Wald test corrected for multiple testing using the Benjamini and Hochberg method. CTCF protein levels in MCF10A and G12V cells as measured by western blot analysis (bottom). Representative result of at least two biological repeats is shown. c Heatmap displaying k-means clustering of CTCF ChIP-Seq data in the two cell types. The ATAC-seq data were arranged to match the order of loci found by clustering CTCF ChIP-Seq. Four kb around the ChIP-seq peaks are displayed. d % of gained (blue) and lost (red) DARs overlapping CTCF binding sites in TADs of up- and down-regulated genes. *p < 0.001, proportional test. e Example for a gained DAR that overlaps with gained CTCF binding site (pink box). Black boxes indicate peaks, the black line indicates CTCF motif. Chromosomal coordinates in Mb of human hg19 genome build are indicated at the bottom.
Fig. 6
Fig. 6. Redistribution of p53 binding underlies genetic reprogramming and cancer phenotypes.
a Top motifs enriched in lost (MCF10A-unique) DARs within TADs of up- or down-regulated genes. Background group is gained DARs. b RNA levels of TP53 in MCF10A (blue) and G12V (red) cells determined by RNA-seq. Data points and average (bar graph) are presented. p-value determined by DESeq2. c Immunostaining of p53 (top panel) in MCF10A and G12V cells. Bar = 20μm. p53 protein levels in MCF10A and G12V cells as measured by western blot analysis (bottom). Representative results of at least two biological repeats are shown. d Variation in RNA levels |log2FC| following 4 h Nutlin-3a treatment in MCF10A cells. Gray—all expressed genes, red –up-regulated genes after HRas transformation, blue—down-regulated genes after HRas transformation and green—down-regulated genes that have lost regulatory sites with a p53 motif in their domain. *p < 0.001, Wilcox test. e % of gained (red) and lost (blue) DARs overlapping p53 binding sites from MCF10A and G12V ChIP-seq in up and down TADs. *p < 0.001, proportional test. f Example for a lost DAR that overlaps with lost p53 binding site (pink box). Blackline indicates p53 motif. Chromosomal coordinates in Mb of human hg19 genome build are presented. g Heatmap displaying k-means clustering of p53 ChIP-Seq data in the two cell types. The ATAC-seq data were arranged to match the order of loci found by clustering p53 ChIP-Seq. Four kb around the ChIP-seq peaks are displayed. h Cell proliferation with 5 μM Nutlin-3a was measured by XTT assay. The relative number of cells, compared to day 0 is presented for MCF10A (blue line) and G12V cells (red line). *p = 0.0002 T-test (i, j) Representative images showing the migration capability and growth pattern of MCF10A and G12V cells with or without Nutlin-3a. Scale bar (i) =400 µm, Scale bar (j) =100 µm.

References

    1. Hanahan D, Weinberg RA. Hallmarks of cancer: the next generation. Cell. 2011;144:646–674. doi: 10.1016/j.cell.2011.02.013. - DOI - PubMed
    1. Spitz F, Furlong EEM. Transcription factors: from enhancer binding to developmental control. Nat. Rev. Genet. 2012;13:613–626. doi: 10.1038/nrg3207. - DOI - PubMed
    1. Koboldt DC, et al. Comprehensive molecular portraits of human breast tumours. Nature. 2012;490:61–70. doi: 10.1038/nature11412. - DOI - PMC - PubMed
    1. Curtis C, et al. The genomic and transcriptomic architecture of 2,000 breast tumours reveals novel subgroups. Nature. 2012;486:346–352. doi: 10.1038/nature10983. - DOI - PMC - PubMed
    1. Yeh JE, Toniolo PA, Frank DA. Targeting transcription factors: promising new strategies for cancer therapy. Curr. Opin. Oncol. 2013;25:652–658. doi: 10.1097/01.cco.0000432528.88101.1a. - DOI - PubMed

Publication types

MeSH terms