. 2020 Nov 25;10(1):20570.
doi: 10.1038/s41598-020-77519-8.

Supporting elimination of lymphatic filariasis in Samoa by predicting locations of residual infection using machine learning and geostatistics

Affiliations

Supporting elimination of lymphatic filariasis in Samoa by predicting locations of residual infection using machine learning and geostatistics

Helen J Mayfield et al. Sci Rep. .

Abstract

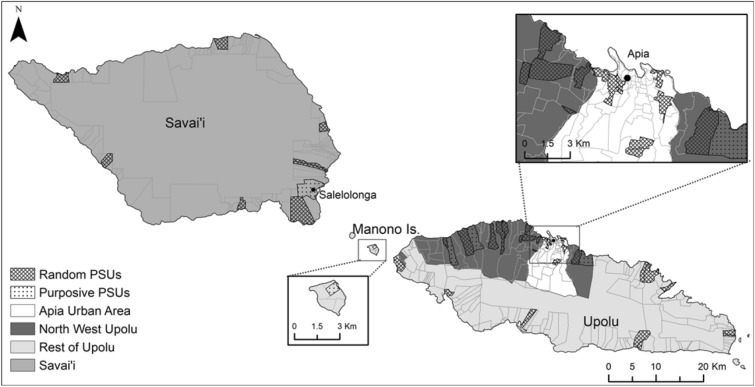
The global elimination of lymphatic filariasis (LF) is a major focus of the World Health Organization. One key challenge is locating residual infections that can perpetuate the transmission cycle. We show how a targeted sampling strategy using predictions from a geospatial model, combining random forests and geostatistics, can improve the sampling efficiency for identifying locations with high infection prevalence. Predictions were made based on the household locations of infected persons identified from previous surveys, and environmental variables relevant to mosquito density. Results show that targeting sampling using model predictions would have allowed 52% of infections to be identified by sampling just 17.7% of households. The odds ratio for identifying an infected individual in a household at a predicted high risk compared to a predicted low risk location was 10.2 (95% CI 4.2-22.8). This study provides evidence that a 'one size fits all' approach is unlikely to yield optimal results when making programmatic decisions based on model predictions. Instead, model assumptions and definitions should be tailored to each situation based on the objective of the surveillance program. When predictions are used in the context of the program objectives, they can result in a dramatic improvement in the efficiency of locating infected individuals.


Conflict of interest statement

The authors declare no competing interests.

Figures

Figure 1
Figure 1
Proportion of individuals that tested positive (Individuals), proportion of households with at least one positive resident (Households) and proportion of households with two or more positive residents (Multi-positive households), stratified by PHR and PLR locations. The complete sample of all houses (random) is also shown. Values listed under each column indicate the total number of individuals or households in each category.
Figure 2
Figure 2
Odds ratios for (a) positive individuals, (b) positive households and (c) multi-positive households in predicted high risk compared to predicted low risk locations when stratified based on different combinations of prevalence thresholds (1%, 5%, 10%) and exceedance probabilities (10–90%). Values for predicted high risk definitions that had insufficient positive or multi-positive houses within either the predicted high risk or predicted low risk locations have been left blank. The number of (d) individuals and (e) households that were classified as being in a predicted location under each definition is also given.
Figure 3
Figure 3
Model performance metrics with varying prevalence cut-offs and exceedance probability thresholds for defining predicted high risk locations. Sensitivity, specificity, positive predictive value, and negative predictive value are shown for individuals, positive households, and multi-positive households at prevalence cut-offs of 1%, 5% and 10%.
Figure 4
Figure 4
Proportion of houses sampled (black line) and proportion of positive individuals identified (grey line) if predicted high risk locations are sampled based on varying levels of exceedance probability used to define predicted high risk (for a 5% predicted prevalence cut-off).
Figure 5
Figure 5
Location of random and purposive sampled primary sampling units in Samoa for 2018 and 2019 field surveys. Spatial data on country, island, region, and village boundaries in Samoa were obtained from the Pacific Data Hub (pacificdata.org) and DIVA-GIS (diva-gis.org). Geographic information systems (GIS) software (ArcGIS v10.4.1, Environmental Systems Research Institute, Redlands CA—www.esri.com) was used to produce maps.

Similar articles

Cited by

References

    1. World Health Organization. Fact sheet: lymphatic filariasis, http://www.who.int/en/news-room/fact-sheets/detail/lymphatic-filariasis (2018).
    1. World Health Organization. WHO recommends triple drug therapy to accelerate global elimination of lymphatic filariasis, https://www.who.int/neglected_diseases/news/WHO_recommends_triple_medici... (2017).
    1. World Health Organization. Samoa rolls out triple drug therapy to accelerate elimination of lymphatic filariasis. https://www.who.int/neglected_diseases/news/Samoa-lympahtic-filariasis/en/ (2018).
    1. Biritwum N-K, et al. Persistent ‘hotspots’ of lymphatic filariasis microfilaraemia despite 14 years of mass drug administration in Ghana. Trans. R. Soc. Trop. Med. Hyg. 2017;110:690–695. doi: 10.1093/trstmh/trx007. - DOI - PubMed
    1. Rao RU, et al. Comprehensive assessment of a hotspot with persistent Bancroftian Filariasis in coastal Sri Lanka. Am. J. Trop. Med. Hygiene. 2018;99:735–742. doi: 10.4269/ajtmh.18-0169. - DOI - PMC - PubMed

Publication types

MeSH terms