. 2020 Dec;588(7837):284-289.
doi: 10.1038/s41586-020-2947-8. Epub 2020 Nov 25.

The barley pan-genome reveals the hidden legacy of mutation breeding

Affiliations

The barley pan-genome reveals the hidden legacy of mutation breeding

Murukarthick Jayakodi et al. Nature. 2020 Dec.

Abstract

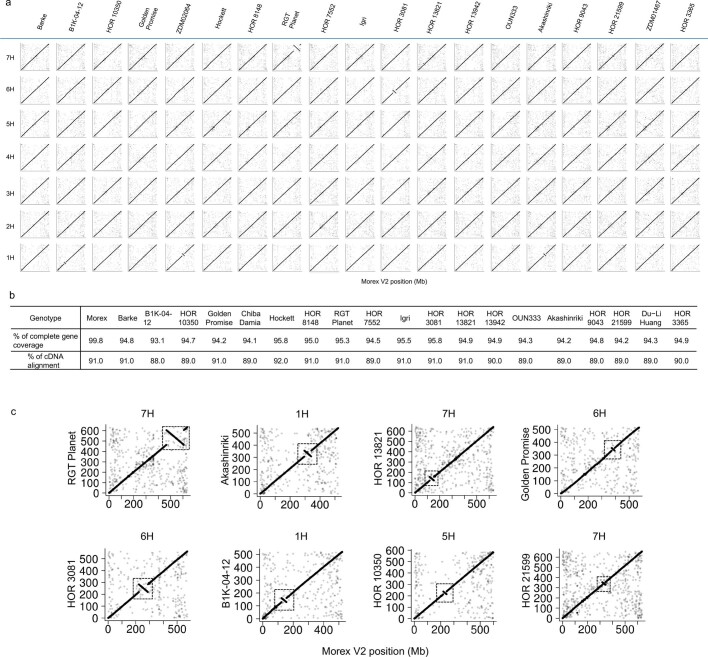
Genetic diversity is key to crop improvement. Owing to pervasive genomic structural variation, a single reference genome assembly cannot capture the full complement of sequence diversity of a crop species (known as the 'pan-genome'1). Multiple high-quality sequence assemblies are an indispensable component of a pan-genome infrastructure. Barley (Hordeum vulgare L.) is an important cereal crop with a long history of cultivation that is adapted to a wide range of agro-climatic conditions2. Here we report the construction of chromosome-scale sequence assemblies for the genotypes of 20 varieties of barley-comprising landraces, cultivars and a wild barley-that were selected as representatives of global barley diversity. We catalogued genomic presence/absence variants and explored the use of structural variants for quantitative genetic analysis through whole-genome shotgun sequencing of 300 gene bank accessions. We discovered abundant large inversion polymorphisms and analysed in detail two inversions that are frequently found in current elite barley germplasm; one is probably the product of mutation breeding and the other is tightly linked to a locus that is involved in the expansion of geographical range. This first-generation barley pan-genome makes previously hidden genetic variation accessible to genetic studies and breeding.


Conflict of interest statement

The authors declare no competing interests.

Figures

Fig. 1
Fig. 1. Chromosome-scale sequences of 20 representative barley genotypes reveal large structural variants.
a, We selected 20 barley genotypes to represent the genetic diversity space, as revealed by PCA of genotyping-by-sequencing data of 19,778 domesticated varieties of barley. Principal component (PC)3 and PC4 are shown. The proportion of variance explained by the principal components is indicated in the axis labels. Further principal components are shown in Extended Data Fig. 1a. b, Alignment of the pseudomolecules of chromosome 2H of the Morex and Barke cultivars. The inset zooms in on a 10-Mb inversion that is frequently found in germplasm from northern Europe. Co-linearity plots for all assemblies and chromosomes are shown in Extended Data Fig. 3a.
Fig. 2
Fig. 2. Single-copy pan-genome and use of PAVs in association mapping.
a, Cumulative size of single-copy regions in genome assemblies of 20 barley genotypes. The genotypes were ordered according to the size of their unique single-copy sequence. b, Genome-wide association scan for lemma adherence on the basis of PAV markers. The black and red dots in the Manhattan plot denote single-copy sequences that are present and absent in Morex, respectively. c, The most highly associated PAV marker was a 16.7-kb region that is deleted in the naked accession HOR 7552 and that contains the NUD gene. d, Allelic status of the NUD deletion in 196 domesticated varieties of barley. Normalized single-copy k-mer counts within the 16.7-kb region are shown for hulled (n = 160 genotypes) and naked varieties (n = 36 genotypes).
Fig. 3
Fig. 3. Identification and characterization of a large inversion on chromosome 7H.
a, Alignment of the 7H pseudomolecules of the Morex and RGT Planet cultivars. b, Alignment of physical and genetic positions mapped in the RGT Planet × Hindmarsh (R × H) (left) and Morex × Barke (M × B) (right) populations. Red shading marks the inverted region. c, We converted genetic distances to recombination rates in the R × H (left) and M × B (right) populations. A single marker per recombination block is shown. d, We designed a PCR marker (Supplementary Figs. 1, 2a) to screen for the presence of the inversion in gene bank accessions that represent the Valticky and Diamant cultivars.
Fig. 4
Fig. 4. Analysis of a frequent inversion on chromosome 2H.
a, A PCA showing the localization of inversion carriers in the diversity space of global domesticated barley. The correspondence of PCA coordinates to correlates of population structure is shown in Extended Data Fig. 1. Red dots denote carriers of the inverted haplotype (n = 87) in a panel of 200 domesticated varieties of barley. b, PCA for a diversity panel comprising 200 domesticated (red and green dots) and 100 wild varieties of barley (blue dots). SNP markers detected in whole-genome shotgun data and located in the inverted regions were used. c, Schematic of the inverted region. The HvCEN gene is closest to the breakpoint that is distal in Morex (distance of 449 kb) and proximal in Barke (distance of 433 kb) assemblies. A total of 46 and 44 high-confidence (HC) genes were annotated in the Morex and Barke assemblies, respectively. The yellow arrows (not drawn to scale) mark the positions of PCR primers to probe for the presence of the inversion (Supplementary Fig. 2c).
Extended Data Fig. 1
Extended Data Fig. 1. Pan-genome selection in the global barley diversity space.
PCA with genotyping-by-sequencing data of 19,778 varieties of domesticated barley sampled from the gene bank of the IPK. The first six principal components are shown. Samples are coloured to highlight the pan-genome selection (first row), or according to geographic origin (second row), row type (third row) or annual growth habit (fourth row). The proportion of variance explained by the principal components is indicated in the axis labels of the first row. The map was created with the R package mapdata.
Extended Data Fig. 2
Extended Data Fig. 2. Comparison between long-read and short-read assemblies of the Morex cultivar.
a, Co-linearity between Morex V2 (short-read) assembly and the Morex PacBio CLR assembly at the pseudomolecule level. b, Summary statistics of the Morex PacBio CLR assembly and Morex V2 assembly. c, Alignment of NUDUM locus (16 kb) between Morex PacBio CLR and Morex V2. d, Structural variants between Morex V2 and Morex PacBio CLR assemblies as detected and classified by Assemblytics. e, PAVs between Barke and the Morex V2 and Morex CLR assemblies.
Extended Data Fig. 3
Extended Data Fig. 3. Assessment of contiguity and completeness in 20 genome assemblies.
a, Whole-genome alignments of assemblies of 19 diverse barley accessions to the Morex V2 reference assembly. b, Alignment summary of full-length coding sequences (32,878) from the MorexV2 annotation and full-length cDNAs (28,622 full-length cDNAs) in each assembly. Alignments with less than 90% query coverage and 97% (less than 90% for full-length cDNAs) identity were discarded. c, Whole-genome alignments show some examples of large chromosomal inversions identified using Hi-C data.
Extended Data Fig. 4
Extended Data Fig. 4. Pairwise shared syntenic full-length LTR locations.
The wild variety B1K-04-12 is set apart as an outgroup, as it shares only 19–26% of its still-intact full-length LTR positions with the other landraces and cultivars. The highest similarity is found between the Barke and RGT Planet cultivars (67% shared full-length LTRs).
Extended Data Fig. 5
Extended Data Fig. 5. Gene projection and transposable element annotation.
a, Schematic of the gene projection workflow. TE, transposable element. b, Pipeline for annotation and removing transposable elements. c, Steps to identify tandemly arrayed gene (TAG) clusters in each assembly. d, Summary of gene projections and transposable element annotation in 20 accessions. e, Comparison between de novo annotations and gene projections for three genotypes. Reported counts refer to non-transposable-element genes.
Extended Data Fig. 6
Extended Data Fig. 6. Summary of PAVs detected in pan-genome assemblies.
a, Size distribution of PAVs. b, Number of PAVs between 20 genome assemblies. c, Distribution of PAVs along the barley genome. d, Co-linearity between physical position of PAVs detected between the Morex and Barke cultivars, and mapped genetically in the POPSEQ population.
Extended Data Fig. 7
Extended Data Fig. 7. Analysis of the single-copy pan-genome.
a, Pipeline used to select single-copy k-mers in PAVs as markers for genome-wide association scan analysis. b, Summary of single-copy sequence in 20 genome assemblies and results of their clustering. c, Copy number of single-copy sequences in a diversity panel comprising 200 domesticated and 100 wild accessions. Frequency ranges from blue (low) to red (high). dg, Comparison of PCA on the basis of PAV and SNP variants in whole-genome shotgun data of 200 diverse accessions (d, e) and 19,778 varieties of domesticated barley (f, g). Top panels show PCA results from 160,716 PAVs; bottom panels show PCA results from 779,503 of genotyping-by-sequencing SNPs. The accessions are coloured according to geographical origin and row type (using the colour code defined in Extended Data Fig. 1).
Extended Data Fig. 8
Extended Data Fig. 8. PAV-based genome-wide association scans using whole-genome shotgun and genotyping-by-sequencing data.
a, Manhattan plots of PAV-based genome-wide association scans for morphological traits, including adherence of grain hull, row type, length of rachilla hairs and awn roughness, using whole-genome shotgun data from 200 diverse varieties of domesticated barley. b, PAV-based genome-wide association scan results for these traits using genotyping-by-sequencing data from 1,000 diverse varieties of domesticated barley collected from the gene bank of the IPK. The 200 varieties of barley used for whole-genome shotgun sequencing are a subset of the 1,000 genotyping-by-sequencing genotypes.
Extended Data Fig. 9
Extended Data Fig. 9. Characterization of large inversions in barley.
a, Inversion size distribution. b, Recombination in inverted regions. Recombination rate was determined in the Morex × Barke RIL population (n = 90 genotypes). c, Number of inversions present as singletons or shared between two or more accessions on each chromosome.

Comment in

  • Insights on decoding wheat and barley genomes.
    Budak H, Appels R, Paux E. Budak H, et al. Funct Integr Genomics. 2021 Mar;21(2):157-159. doi: 10.1007/s10142-021-00774-z. Epub 2021 Feb 17. Funct Integr Genomics. 2021. PMID: 33598867 No abstract available.

References

    1. Bayer PE, Golicz AA, Scheben A, Batley J, Edwards D. Plant pan-genomes are the new reference. Nat. Plants. 2020;6:914–920. - PubMed
    1. Dawson IK, et al. Barley: a translational model for adaptation to climate change. New Phytol. 2015;206:913–931. - PubMed
    1. Stein, N. & Muehlbauer, G. J. The Barley Genome (Springer, 2018).
    1. International Barley Genome Sequencing Consortium A physical, genetic and functional sequence assembly of the barley genome. Nature. 2012;491:711–716. - PubMed
    1. Mascher M, et al. A chromosome conformation capture ordered sequence of the barley genome. Nature. 2017;544:427–433. - PubMed

Publication types