. 2021 Jan;589(7840):103-109.
doi: 10.1038/s41586-020-2960-y. Epub 2020 Nov 25.

TRF2-independent chromosome end protection during pluripotency

Affiliations

TRF2-independent chromosome end protection during pluripotency

Phil Ruis et al. Nature. 2021 Jan.

Abstract

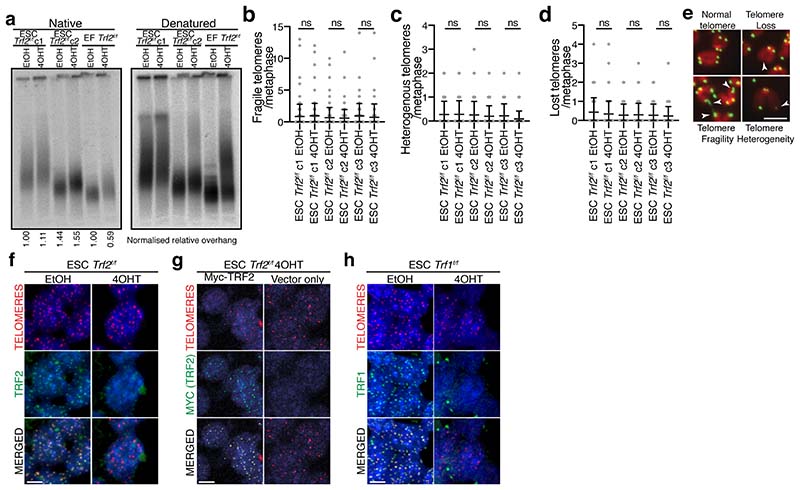
Mammalian telomeres protect chromosome ends from aberrant DNA repair1. TRF2, a component of the telomere-specific shelterin protein complex, facilitates end protection through sequestration of the terminal telomere repeat sequence within a lariat T-loop structure2,3. Deleting TRF2 (also known as TERF2) in somatic cells abolishes T-loop formation, which coincides with telomere deprotection, chromosome end-to-end fusions and inviability3-9. Here we establish that, by contrast, TRF2 is largely dispensable for telomere protection in mouse pluripotent embryonic stem (ES) and epiblast stem cells. ES cell telomeres devoid of TRF2 instead activate an attenuated telomeric DNA damage response that lacks accompanying telomere fusions, and propagate for multiple generations. The induction of telomere dysfunction in ES cells, consistent with somatic deletion of Trf2 (also known as Terf2), occurs only following the removal of the entire shelterin complex. Consistent with TRF2 being largely dispensable for telomere protection specifically during early embryonic development, cells exiting pluripotency rapidly switch to TRF2-dependent end protection. In addition, Trf2-null embryos arrest before implantation, with evidence of strong DNA damage response signalling and apoptosis specifically in the non-pluripotent compartment. Finally, we show that ES cells form T-loops independently of TRF2, which reveals why TRF2 is dispensable for end protection during pluripotency. Collectively, these data establish that telomere protection is solved by distinct mechanisms in pluripotent and somatic tissues.


Conflict of interest statement

Author Information

All data are archived at the Francis Crick Institute or CMRI. The authors declare no competing interests. Requests for materials should be addressed to simon.boulton@crick.ac.uk.

Figures

Extended Data Figure 1
Extended Data Figure 1. TRF2-null ESCs do not undergo telomere fusions and show only a mild growth defect
(a-b) Growth curves of Trf2f/f ESCs and EFs after treatment with 4OHT or EtOH. Cells were counted and re-seeded every 2 or 3 days (mean ± s.d., n=3 biologically independent experiments). (c) Brightfield images of the indicated cells 7 days after treatment with EtOH or 4OHT. (d) Western blot of whole cell extracts from Trf2f/f ESCs at the indicated times after treatment with EtOH or 4OHT. (e) Flow cytometry determination of DNA content for the indicated cells 96 hours after 4OHT or EtOH treatment (≥10,000 cells/condition, n=3 independent experiments). (f) Western blot of whole cell extracts from indicated cells 96 h after treatment with EtOH or 4OHT. IR indicates 2 h post-treatment with 20 Gy IR. (g) Gating strategy for flow cytometry determination of DNA content. Example shown is Trf2f/f EF EtOH sample from Fig.1d. Similar strategies to gate live cells and singlets were applied for all flow cytometry experiments. (h) Western blot of whole cell extracts from three independently generated Trf2f/f ESC clones 96 h after treatment with EtOH or 4OHT. (i) Mitotic chromosome spreads from Trf2f/f ESCs 10 days after treatment with 4OHT or EtOH. The DNA is stained with DAPI (red) and the telomeres by FISH (green), with the mean percentage of telomere fusions from (j) indicated. Scale bar = 5 μm (j) Quantification of the experiment shown in (i) (mean ± s.d., ≥ 60 spreads/condition across 3 independent experiments, unpaired two-tailed t-test, ns = not significant). (k) Western blot of whole cell extracts from Trf2f/f ESCs 10 days after treatment with EtOH or 4OHT.
Extended Data Figure 2
Extended Data Figure 2. Telomeres in TRF2-null ESCs are phenotypically normal
(a) In-gel hybridization assay for single stranded telomeric G-overhang DNA after Trf2 deletion. Left: TelC signals under the native condition. Right: same gel re-hybridized after in situ denaturation of the DNA. Overhang signals (bottom) were normalized to the total telomeric signals (right) and compared to Trf2f/f EFs treated with EtOH, which was given an arbitrary value of 1 in each of three independent experiments. The mean of these normalised values is shown for each condition (n=3 biologically independent experiments, representative example shown). (b-d) Quantification of telomere fragility (b), heterogeneity (c) and loss (d) from mitotic chromosome spreads shown in Fig.1b (mean ± s.d., ≥70 spreads/condition across 3 independent experiments, unpaired two-tailed t-tests) (e) Representative examples of the phenotypes quantified in (b-d) with relevant abnormalities marked with arrows. The DNA is stained with DAPI (red) and the telomeres by FISH (green). Scale bar = 5 μm (f) IF-FISH analysis to detect endogenous TRF2 in Trf2f/f ESCs 96 h after treatment with 4OHT or EtOH. TRF2 was detected by IF (green), telomeric DNA with FISH (red), and the DNA with DAPI (blue). (g) IF-FISH analysis to detect exogenous Myc-TRF2 in Trf2f/f ESCs stably expressing Myc-TRF2 or a vector-only control 96 h after treatment with 4OHT. Myc-TRF2 was detected by IF (green), telomeric DNA with FISH (red), and the DNA with DAPI (blue). (h) IF-FISH analysis to detect TRF1 in Trf1f/f ESCs 48 h after treatment with 4OHT or EtOH. TRF1 was detected by IF (green), telomeric DNA with FISH (red), and the DNA with DAPI (blue). For (fh) the scale bar = 5 μm. For all panels: ns = not significant.
Extended Data Figure 3
Extended Data Figure 3. The telomeric DDR is attenuated in ESCs lacking TRF2
(a) Cartoon depicting the SILAC-PICh workflow used in (b, c). (b-c) Results of SILAC-PICh-Mass Spectrometry of Trf2f/f ESCs (b) and Trf2f/f EFs (c) 96 h after 4OHT or EtOH treatment. Data are shown as the fold change of heavy/light ratio for each protein in duplicate experiments for which opposite labelling with heavy/light isotopes was used. Shelterin subunits and select DNA repair factors are indicated in the plot. NA indicates protein was not detected in that experiment. (d) Venn diagram showing overlap of the proteins identified by SILAC-PICh in Wild Type Trf2f/f ESCs and Trf2f/f EFs (EtOH conditions). (e) IF-FISH analysis to detect γH2AX TIFs in Trf2f/f ESCs and Trf2f/f EFs 96 h after treatment with 4OHT or EtOH. γH2AX was detected by IF (red), telomeric DNA with FISH (white), and the DNA with DAPI (blue). Scale bar = 5 μm. (f) Quantification of the experiment shown in (e) (mean ± s.d., ≥ 300 cells/condition across 3 independent experiments, one-way ANOVA). (g) Quantification of the experiment shown in (e) (each dot represents percentage of cells with >3 TIFs in each of 3 independent experiments analysing ≥100 cells/condition per experiment, bars represent mean ± s.d. of these values, one-way ANOVA) (h) Quantification from experiment shown in Fig. 1g (each dot represents percentage of cells with >3 TIFs in each of 4 independent experiments analysing ≥100 cells/condition per experiment, bars represent mean ± s.d. of these values, one-way ANOVA). (i) Quantification of IF-FISH to detect 53BP1 TIFs in the indicated cells, 96 hours after treatment with EtOH or 4OHT. 53BP1 was detected by IF (green), telomeric DNA with FISH (red) and DNA with DAPI (blue). c1, c2 and c3 indicate 3 independently derived clones. (mean ± s.d., ≥ 200 cells/condition across 3 independent experiments, one-way ANOVA). For all panels: **** p ≤ 0.0001.
Extended Data Figure 4
Extended Data Figure 4. The DNA Damage Response and NHEJ are functional in ESCs
(a) IF to detect γH2AX (green) and 53BP1 (red) in untreated Trf2f/f ESCs and Trf2f/f EFs or 1 h after treatment with 0.5 Gy IR. DNA stained with DAPI (blue), scale bar = 5 μm. (b) Quantification from experiment shown in (a) (each dot represents percentage of cells with >4 foci in each of 2 independent experiments analysing ≥100 cells/condition per experiment, bars represent mean ± s.d. of these values, one-way ANOVA). (c) Flow cytometry determination of DNA content for the indicated cells at the indicated times after IR treatment, 96 h after treatment with EtOH or 4OHT (n=3 independent experiments, ≥10,000 cells/condition in each experiment). (d) DNA from Trf2f/f ESCs and Trf2f/f MEFs was harvested, subjected to pulsed-field gel electrophoresis and stained with EtBr at the indicated times after irradiation with 20 Gy. The band of DNA resulting from double strand breaks (DSBs) is indicated. (e) Quantitation of the experiment in (d). The DNA band resulting from DNA DSBs was quantified and normalised to the unbroken DNA. The level of DNA resulting from DSBs was subsequently compared to the sample harvested 10 minutes after IR from that condition, which was normalized as 100% DSBs remaining (mean ± s.d. n=3 biologically independent experiments). (f) Survival of non-targeting control (NTC), Ku70 knockout (Ku70-KO), or DNA Ligase IV knockout (LigIV-KO) Trf1f/f Trf2f/f ESCs after exposure to the indicated doses of Ionising Radiation as measured using CellTitreGlo, 4 days after IR treatment (n=3 biologically independent experiments, mean ± s.e.m). Individual clonal knockout lines are denoted c1 and c2. (g-h) Western blot of whole cell extracts from the cells used in (f). * indicates non-specific band. For all panels: ns = not significant, **** p ≤ 0.0001.
Extended Data Figure 5
Extended Data Figure 5. The absence of telomere fusions in TRF2-null ESCs is not the result of a weak DDR or a short G1 phase
(a) 96 h after treatment with EtOH or 4OHT, Trf2f/f ESCs were grown asynchronously or treated for 16 h with Mimosine to induce G1 arrest. DNA content from these cells was determined using flow cytometry at 0 h, 4 h and 9 h after release from Mimosine. (b) Mitotic chromosome spreads from asynchronous cells and cells released from Mimosine block for 9 h as in (a). The DNA was stained with DAPI (red) and the telomeric DNA with FISH (green). The mean percentage of fused chromosomes from (c) is indicated. (c) Quantification from experiment shown in (a, b) (mean ± s.d., ≥ 70 spreads/condition across 3 independent experiments, unpaired two-tailed t-test). (d) Mitotic chromosome spreads from Trf2f/f ESCs 96 h after treatment with 4OHT and 24 h after mock treatment or treatment with 2 Gy IR. Samples are stained as in (b) and the mean percentage of telomere fusions from (e) is indicated. (e) Quantification of experiment shown in (d) (mean ± s.d., ≥ 50 spreads/condition across 2 independent experiments, unpaired two-tailed t-test). For all panels: Scale bar = 5 μm; ns = not significant.
Extended Data Figure 6
Extended Data Figure 6. TPP1 and TRF1 function are conserved in ESC and somatic tissues.
(a) Western blot of whole cell extracts from indicated cells 96 h after EtOH or 4OHT treatment, and 72 h after siRNA transfection. (b) TPP1 expression in the indicated cells analysed by RT-qPCR. Data were normalized to the ESC Trf2f/f EtOH Control siRNA (siCon) condition, which was arbitrarily assigned a value of 1 (mean ± s.d., n=3 biologically independent experiments, one-way ANOVA). (c) Quantification of 53BP1 TIFs from cells shown in (d) (mean ± s.d., ≥ 300 cells/condition across 3 independent experiments, one-way ANOVA, ** p = 0.0013). (d) 53BP1 TIFs in the indicated cells. 53BP1 was detected by IF (green), telomeres by FISH (red) and DNA with DAPI (blue). (e) Mitotic chromosome spreads from indicated cells 96 h after 4OHT or EtOH treatment, and 72 h after siRNA transfection. Telomeres stained with FISH (green) and the DNA with DAPI (red). The mean percentage of fused telomeres from (f) is shown. (f) Quantification of telomere fusions from (e) (mean ± s.d., 90 spreads/condition across 4 independent experiments, one-way ANOVA). (g) Flow cytometry determination of DNA content for the indicated cells 96 hours after 4OHT or EtOH treatment (n=3, ≥ 10,000 cells/condition). (h) Telomeric RPA-pSer33 foci in Trf1f/f ESCs 72 h after treatment with EtOH or 4OHT. RPA-pSer33 was detected by IF (green), telomeres by FISH (red), and DNA with DAPI (blue). (i) Quantification of the experiment in (h) (mean ± s.d., ≥ 300 cells/condition across 3 independent experiments, unpaired two-tailed t-test). (j) 53BP1 TIFs in Trf1f/f ESCs 72 h after treatment with 4OHT or EtOH. Samples are stained as in (d). (k) Quantification of (j) (mean ± s.d., ≥ 300 cells/condition across 3 independent experiments, unpaired two-tailed t-test). For all panels: Scale bar = 5 μm; ns = not significant, **** p ≤ 0.0001.
Extended Data Figure 7
Extended Data Figure 7. ESCs require Shelterin for chromosome end protection
(a) Equal numbers of the indicated cells were seeded and treated with EtOH or 4OHT. The cells were counted at 72 h and the number of cells in each condition normalized to the ESC Trf1+/+ Trf2f/f EtOH condition, which was given an arbitrary value of 1 (mean ± s.d., n=3 biologically independent experiments). (b) Flow cytometry determination of DNA content for the indicated cells 48 or 72 hours after 4OHT or EtOH treatment (n=3, ≥ 10,000 cells/condition). (c) 53BP1 TIFs in the indicated cells 72 h after treatment with 4OHT or EtOH. 53BP1 was detected by IF (green), the telomeres with FISH (red) and DNA with DAPI (blue). Scale bar = 5 μm. (d) Quantification of the experiment shown in (c) (mean ± s.d. ≥ 300 cells/condition across 3 independent experiments, one-way ANOVA, **** p ≤ 0.0001) (e) Western blot of whole cell extracts from Trf2f/f ESCs at indicated times after treatment with 2 Gy or 20 Gy IR.
Extended Data Figure 8
Extended Data Figure 8. Shelterin-free ESCs activate a full DNA Damage Response equivalent to that in Shelterin-free somatic cells
(a) Western blotting of whole cell extracts from Trf1f/f Trf2f/f ESCs at indicated times after EtOH or 4OHT treatment. (b,c) Quantification of telomere fusions (b) or γH2AX TIFs (c) in Trf1f/f Trf2f/f ESCs at the indicated times after 4OHT or EtOH treatment (mean ± s.d., ≥70 mitotic spreads/condition for (b) or, ≥300 cells/condition for (c), each across 3 independent experiments, one-way ANOVA). (d) 53BP1 TIFs in the indicated cells, 48 h after EtOH or 4OHT treatment or infection with AdGFP or AdCRE. 53BP1 was detected by IF (green), telomeres by FISH (red) and DNA with DAPI (blue). (e) Quantification of the experiment shown in (d) (mean ± s.d., ≥ 200 cells/condition across 2 independent experiments, one-way ANOVA). (f) Quantification of γH2AX TIFs in the indicated cells 48 after treatment with EtOH or 4OHT or infection with AdGFP or AdCRE (mean ± s.d., ≥ 200 cells/condition across 3 independent experiments, one-way ANOVA). (g) Western blotting of whole cell extracts from Trf1f/f Trf2f/f ESCs and Trf1f/f Trf2f/f MEFs at the indicated times after EtOH or 4OHT treatment or infection with AdGFP or AdCRE. (h) Quantification of telomere fragility from mitotic chromosome spreads shown in Fig.2f, 72 h after EtOH or 4OHT treatment (mean ± s.d., ≥70 spreads/condition examined over 3 experiments, one-way ANOVA) (i) γH2AX TIFs in the indicated cells 36 h after EtOH or 4OHT treatment. γH2AX was detected by IF (green) telomeric DNA with FISH (red), and the DNA with DAPI (blue). (j) Quantification of the experiment shown in (i) (mean ± s.d., ≥ 300 cells/condition across 3 independent experiments, one-way ANOVA). For all panels: the scale bar = 5 μm; ns = not significant; **** p ≤ 0.0001.
Extended Data Figure 9
Extended Data Figure 9. Shelterin free ESC and MEF telomeres are substrates for both ATM and ATR kinases
(a) IF-FISH analysis to detect telomeric ATM-pSer1987 foci in CSK-extracted Trf1f/f Trf2f/f ESCs 36 h after treatment with 4OHT or EtOH. ATM-pSer1987 was detected by IF (green), telomeres by FISH (red), and DNA with DAPI (blue). (b) Quantification from experiment shown in (a) (mean ± s.d., n=2 independent experiments, ≥100 cells/condition per experiment, unpaired two-tailed t-test). (c) IF-FISH analysis to detect telomeric RPA-pSer33 foci in CSK-extracted Trf1f/f Trf2f/f ESCs 36 h after treatment with 4OHT or EtOH. RPA-pSer33 (green) was detected by IF, telomeres by FISH (red), DNA with DAPI (blue). (d) Quantification from experiment shown in (c) (mean ± s.d., n=4 independent experiments, ≥100 cells/condition per experiment, unpaired two-tailed t-test). (e) IF-FISH analysis to detect telomeric ATM-pSer1987 foci in CSK-extracted Trf1f/f Trf2f/f MEFs 48 h after infection with AdGFP or AdCRE. ATM-pSer1987 was detected by IF (green), telomeres by FISH (red), and DNA with DAPI (blue). (f) Quantification from experiment shown in (e) (mean ± s.d., n=2 independent experiments, ≥150 cells/condition per experiment, unpaired two-tailed t-test). (g) IF-FISH analysis to detect telomeric RPA-pSer33 foci in CSK-extracted Trf1f/f Trf2f/f MEFs 48 h after infection with AdGFP or AdCRE. RPA-pSer33 was detected by IF (green), telomeres by FISH (red), and DNA with DAPI (blue). (h) Quantification from experiment shown in (g) (mean ± s.d., n=2 independent experiments, ≥150 cells/condition per experiment, unpaired two-tailed t-test). For all panels: scale bar = 5 μm; **** p ≤ 0.0001. For (b, d, f, g), each dot represents value from each independent experiment, bars represent mean ± s.d., of these values.
Extended Data Figure 10
Extended Data Figure 10. Telomere fusions in Shelterin-free ESCs are primarily driven by ATM signaling and NHEJ
(a) Mitotic chromosome spreads from the indicated cells 72 h after treatment with 4OHT or EtOH, mock treated or treated with an ATR inhibitor (ATRi). The DNA is stained with DAPI (red) and the telomeres by FISH (green). The mean percentage of fused chromosome ends from Fig. 2k is noted. (b) Western blotting of whole cell lysates from the indicated cells, 72 h after infection with AdGFP or AdCRE. * indicates non-specific band (c) Quantification of telomere fusions in the indicated cells 72 h after infection with AdGFP or AdCRE. Cells were either mock treated or treated with an ATRi (n≥50 spreads/condition analysed over 2 biologically independent experiments, one-way ANOVA. ns=not significant; **** p ≤ 0.0001). (d) Western blotting of whole cell lysates from Ku70-Knockout (Ku70-KO) or non-targeting control (NTC) Trf1f/f Trf2f/f ESCs 72 h after treatment with EtOH or 4OHT. (e) Mitotic chromosome spreads from the indicated cells 72 h after treatment with 4OHT or EtOH. Cells were stained as in (a) and the mean percentage of fused chromosome ends from Fig. 2l is shown. (f) Western blotting of whole cell lysates from DNA Ligase IV-Knockout (LigIV-KO) or NTC Trf1f/f Trf2f/f ESCs 72 h after treatment with EtOH or 4OHT. * indicates non-specific band (g) Mitotic chromosome spreads from the indicated cells 72 h after treatment with 4OHT or EtOH. Cells were stained as in (a). The mean percentage of chromosome ends fused from Fig 2m is noted. For all panels: Scale bar = 5 μm
Extended Data Figure 11
Extended Data Figure 11. TRF2 is required for telomere protection and viability upon loss of pluripotency
(a) Brightfield images of Trf2f/f EpiSCs 96 hours after EtOH or 4OHT treatment. (b-f) Gene expression in the indicated cells analysed by RT-qPCR 96 h after EtOH or 4OHT treatment. Data were normalized to expression in the ESC Trf2f/f EtOH sample, which was arbitrarily assigned a value of 1 for each gene in each experiment. (mean ± s.d., n=2 biologically independent experiments). (g, h) γH2AX TIF images (g) and quantitation (h), 96 h hours after EtOH or 4OHT treatment (mean ± s.d. ≥300 cells across 4 independent experiments, unpaired two-tailed t-test, **** p ≤ 0.0001). γH2AX was detected by IF (green), telomeres by FISH (red), and DNA with DAPI (blue). (i) 53BP1 TIFs in Trf2f/f EpiSCs 96 h after 4OHT or EtOH treatment. 53BP1 was detected by IF (green), telomeric DNA by FISH (red) and the DNA with DAPI. (jn) Gene expression in the indicated cells analysed by RT-qPCR from 2-5 days after initiating differentiation. Data were normalized as described for (b-f). “Diff Day x” refers to cells on day “x” of the differentiation protocol (mean ± s.d., n=3 biologically independent experiments). (or) Gene expression in the indicated cells analysed by RT-qPCR. Data were normalized as described in (b-f) (mean ± s.d., n=3 biologically independent experiments). (s) Western blots of whole cell extracts from Trf2f/f ESCs differentiated as in Fig. 3e. (t, u) Nanog and Fgf5 gene expression in the indicated cells analysed by RT-qPCR 96 hours after treatment with EtOH or 4OHT. Data were normalized as described for (b-f) (mean ± s.d., n=3) (v) Western blot of whole cell extracts from the indicated cells 96 h after treatment with EtOH or 4OHT. * indicates non-specific band. For h, i: Scale bar = 5 μm.
Extended Data Figure 12
Extended Data Figure 12. TRF2 is required for blastocyst development prior to implantation
(a) Quantification of NANOG-positive and NANOG-negative cells in each of the embryos assessed in Fig. 5e, f (mean ± s.d., one-way ANOVA, ns = not significant). (b) Maximal projection of z-stacks from Trf2-/- embryos displaying pan-nuclear γH2AX-positive cells which are highlighted with arrows. γH2AX (green) and NANOG (magenta) were detected by IF, telomeres by FISH (red), DNA with DAPI (blue). (c) Quantification of percentage of cells within an embryo showing pan-nuclear γH2AX staining from experiment shown in (b) (mean ± s.d., one-way ANOVA).
Extended Data Figure 13
Extended Data Figure 13. TRF2 is not required for t-loop formation in ESCs
(a) IF-FISH analysis to detect telomeric ATM-pSer1987 foci in Trf2f/f ESCs 96 h after treatment with 4OHT or EtOH. ATM-pSer1987 was detected by IF (green), telomeres by FISH (red), DNA with DAPI (blue). (b) Quantification from experiment shown in (a) (mean ± s.d., ≥300 cells across 3 independent experiments, unpaired two-tailed t-test). (c) Schematic representation of TRF1 and the TRF2 variants used in this study. (d) Western blots of whole cell extracts from Trf2f/f ESCs expressing WT, mutant, or hybrid TRF2 alleles 96 hours after treatment with EtOH or 4OHT. (e) IF-FISH detection of γH2AX TIFs in the indicated cells 96 h after treatment with 4OHT or EtOH. γH2AX was detected by IF (green), telomeric DNA by FISH (red), and DNA with DAPI (blue). (f) Quantification of the experiment shown in (e) (mean ± s.d., ≥300 cells across 3 independent experiments, two-tailed t-test) (g) Quantitation (upper panel) of the cross-linking efficiency test (bottom panel) in Trf2f/f ESCs 96 h after treatment with EtOH or 4OHT (mean ± s.e.m., n=3 biologically independent experiments, unpaired two-tailed t-test). (h) Measurement of linear and t-loop molecules shown in Fig. 5f (mean ± s.e.m., n=3 biological replicates scoring ≥ 2804 molecules per replicate). T-loop measurements are a sum of the loop and tail portions of the molecule. For (a) and (e), scale bar = 5 μm. For all panels: ns = not significant, **** p ≤ 0.0001.
Figure 1
Figure 1. TRF2 is largely dispensable for telomere end protection and cell viability in ESCs
(a) Western blot of whole cell extracts from the indicated cells 96 hours after EtOH or 4OHT treatment. (b) Mitotic chromosome spreads from the indicated cells 96 h after treatment with 4OHT or EtOH. The DNA is stained with DAPI (red) and the telomeric DNA by fluorescent in situ hybridization (FISH, green). The mean percentage of fused chromosome ends from (c) is indicated. (c) Quantification of telomere fusions from the experiment shown in (b). Clonal lines are denoted c1-c3 (mean ± s.d., ≥70 spreads/condition over 3 independent experiments, oneway ANOVA.) (d) Flow cytometry determination of DNA content for the indicated cells 96 hours after 4OHT or EtOH treatment (n=3, ≥10,000 cells/condition). (e-f) Images and quantification of telomere-sister chromatid exchange (T-SCE) analysis in the indicated cells 96 h after treatment with EtOH or 4OHT, or 12 h after induction of TRF1-FOK1 expression. (mean ± s.d., ≥70 spreads/condition over 3 independent experiments, one-way ANOVA). (g) 53BP1 TIFs in Trf2f/f ESCs or EFs 96 h after treatment with 4OHT or EtOH. 53BP1 was detected by immunofluorescence (IF, green), the telomeric DNA with FISH (red), and DNA with DAPI (blue). (h) Quantification of (g) (mean ± s.d., ≥300 cells/condition over 4 independent experiments, one-way ANOVA). (i) Western blots of whole cell extracts from the indicated cells 96 hours after EtOH or 4OHT treatment. Where indicated, IR represents 2 h post-treatment with 2 Gy IR, and UV represents 2 h post-treatment with 10 J/m2 UV. For all panels: Scale bar = 5 μm; ns = not significant; **** p ≤ 0.0001.
Figure 2
Figure 2. The Shelterin complex is required for telomere protection in ESCs
(a) Western blot of whole cell extracts 72 h after EtOH or 4OHT treatment. UV indicates 2 h post-treatment with 10 J/m2 UV. (b) Mitotic chromosome spreads 72 h after 4OHT or EtOH treatment. DNA is stained with DAPI (red) and the telomeres by FISH (green). Fragile telomeres are marked with an asterisk, telomere loss with an arrowhead. (c-d) Quantification of telomere fragility (c) and loss (d) from (b)_(unpaired two-tailed t-test). (e) Western blot of whole cell extracts from indicated ESC cultures 72 h after EtOH or 4OHT treatment. (f) Mitotic chromosome spreads from indicated ESCs 72 h after 4OHT or EtOH treatment, stained as in (b). (g) Quantitation of telomere fusions in (f) (one-way ANOVA). (h) 53BP1 TIFs in ESCs 36 h after 4OHT or EtOH treatment. 53BP1 (green) was detected by IF, telomeric DNA by FISH (red), DNA with DAPI (blue). (i) Quantification of (h) (mean ± s.d. ≥300 cells/condition over 3 independent experiments, one-way ANOVA). (j) Western blot of whole cell extracts from non-targeting control (NTC) or Atm-Knockout (Atm-KO) Trf1f/f Trf2f/f ESCs 48 h or 72 h after EtOH or 4OHT treatment (*non-specific band). (k) Telomere fusions in NTC and Atm-KO Trf1f/f Trf2f/f ESCs ± ATR inhibitor (ATRi) 72 h after EtOH or 4OHT treatment (one-way ANOVA). (l, m) Telomere fusions in NTC, Ku70-KO (l), or DNA Ligase VI-Knockout (LigIV-KO) (m) Trf1f/f Trf2f/f ESCs 72 h after EtOH or 4OHT treatment. Clonal lines are denoted c1 and c2 (one-way ANOVA). For all panels: Scale bar = 5 μm; ns = not significant;, ** p=0.0011, **** p ≤ 0.0001. Mean telomere fusion percentage shown in (b) and (f). For (c, d, g, k-m) mean ± s.d., ≥70 spreads/condition over 3 independent experiments.
Figure 3
Figure 3. TRF2-dependent chromosome end protection begins at pluripotency exit
(a) Western blots of whole cell extracts from the indicated cells 96 h after EtOH or 4OHT treatment. (b) Mitotic chromosome spreads from Trf2f/f EpiSCs 96 h after 4OHT or EtOH treatment. DNA is stained with DAPI (red), telomeres with FISH (green). (c) Quantitation of telomere fusions from (b) (mean ± s.d., ≥80 spreads/condition over 3 independent experiments, one-way ANOVA). (d) 53BP1 TIFs in Trf2f/f EpiSCs and Trf2f/f EFs 96 h after 4OHT or EtOH treatment. (mean ± s.d., ≥300 cells/condition over 3 independent experiments, one-way ANOVA). (e) Differentiation protocol used in (f-m). (f) Growth curve of Trf2f/f ESCs differentiated as shown in (e) (n=3 biologically independent experiments, mean ± s.e.m.). (g) Brightfield images depicting Trf2f/f ESCs differentiated as in (e). (h) Mitotic chromosome spreads from Trf2f/f ESCs differentiated as shown in (e) and stained as in (b). (i) quantitation of telomere fusions from (h) (mean ± s.d. ≥60 spreads/condition over 3 independent experiments, unpaired two-tailed t-test). (j) 53BP1 TIFs in Trf2f/f ESCs and Trf2f/f ESCs differentiated as in (e), 96 h after EtOH or 4OHT treatment. 53BP1 (green) was detected by IF, telomeric DNA by FISH (red) and DNA with DAPI (blue). (k) Quantification of (j) (mean ± s.d., ≥300 cells/condition over 4 independent experiments, one-way ANOVA). (l) 53BP1 TIFs in non-targeting control (NTC) and Atm-knockout (Atm-KO) Trf2f/f ESCs differentiated as shown in (e) (mean ± s.d. n=3, ≥300 spreads/condition, unpaired two-tailed t-test). (m) Telomere fusions from NTC and Atm-KO Trf2f/f ESCs differentiated as in (e) (mean ± s.d., ≥ 60 spreads/condition over 3 independent experiments, unpaired two-tailed t-test). For b,h,j Scale bar = 5 μm. For all panels: **** p ≤ 0.0001. Mean telomere fusion percentages are shown in (b) and (h).
Figure 4
Figure 4. TRF2-null embryos are compromised as expanding blastocysts
(a) Genotypes of embryos obtained at various developmental stages after crossing Trf2+/- mice. Count = number of embryos with each genotype. (b) EmbryoScope images of developing Trf2+/- and Trf2-/- embryos obtained at E0.5. (c) Time at which Trf2+/+, Trf2+/-, and Trf2-/- embryos shown in (b) reach key developmental stages in EmbryoScope culture. Number of embryos of each genotype analysed is shown (mean ± s.d.). (d) The percentage of embryos from the experiment in (b-c) that reach each developmental stage. (e) IF-FISH analysis of γH2AX TIFs and NANOG within embryos of the indicated genotypes. γH2AX (green) and NANOG (magenta) were detected by IF, telomeric DNA by FISH (red) and DNA with DAPI (blue). Whole embryo maximum intensity projection is shown on the left, and a maximum intensity projection restricted to the pluripotent Inner Cell Mass (ICM) is on the right. (f) Quantification of γH2AX TIFs in NANOG-positive and NANOG-negative cells within embryos of indicated genotypes from (e). Each data point represents the mean number of TIFs across all NANOG-positive or Nanog-negative cells within each embryo. Number of embryos of each genotype analysed is shown (two-way ANOVA, **** p ≤ 0.0001, mean ± s.d.).
Figure 5
Figure 5. T-loop formation occurs independently of TRF2 in ESCs
(a) Western blots of whole cell extracts from non-targeting control (NTC) and Atm-Knockout (Atm-KO) Trf2f/f ESCs 96 h after EtOH or 4OHT treatment (* non-specific band). Clonal lines are denoted c1 and c2. (b) 53BP1 TIFs in NTC and Atm-KO Trf2f/f ESCs 96 h after treatment with 4OHT or EtOH. 53BP1 was detected by IF (green), telomeric DNA by FISH (red) and DNA with DAPI (blue). Scale bar = 5 μm. (c) Quantification of (b). (d) 53BP1 TIFs in Trf2f/f ESCs stably expressing Myc-tagged mouse WT TRF2 (TRF2) or the indicated mutant or hybrid TRF2 allele, 96 h after EtOH or 4OHT treatment. Samples were stained as in (b), scale bar = 5 μm. (e) Quantification of (d). (f) T-loops and linear telomeres from ESCs imaged by Airyscan super-resolution microscopy. Scale bar = 2 μm. (g) Quantitation of t-loops in Trf2f/f MEFs and ESCs 96 h after EtOH or 4OHT treatment. Data are exclusive of ambiguous telomere molecules (one-way ANOVA, data are mean ± SEM, minimum four experiments scoring ≥ 2804 molecules per replicate). (h) Measurement of the loop portion of t-loops from the data in in (g) (mean ± s.d.). For all panels: ns = not significant, **** p ≤ 0.0001. For (c, e), mean ± s.d., ≥300 cells/condition over 3 independent experiments, one-way ANOVA.

References

    1. Palm W, de Lange T. How shelterin protects mammalian telomeres. Annual review of genetics. 2008;42:301–334. - PubMed
    1. Griffith JDC, C L, Rosenfield S, Stansel RM, Bianchi A, Moss H, de Lange T. Mammalian Telomeres End in a Large Duplex Loop. Cell. 1999;97:503–514. - PubMed
    1. Van Ly D, et al. Telomere Loop Dynamics in Chromosome End Protection. Mol Cell. 2018;71:510–525.:e516. doi: 10.1016/j.molcel.2018.06.025. - DOI - PubMed
    1. van Steensel B, S A, de Lange T. TRF2 Protects Human Telomeres from End-to-End Fusions. Cell. 1998;92:401–413. - PubMed
    1. Karlseder J, B D, Dai Y, Hardy S, de Lange T. p53- and ATM-Dependent Apoptosis Induced by Telomeres Lacking TRF2. Science. 1999;283:1321–1325. - PubMed

MeSH terms

Substances