. 2021 Jan;589(7840):110-115.
doi: 10.1038/s41586-020-2959-4. Epub 2020 Nov 25.

TRF2-mediated telomere protection is dispensable in pluripotent stem cells

Affiliations

TRF2-mediated telomere protection is dispensable in pluripotent stem cells

Marta Markiewicz-Potoczny et al. Nature. 2021 Jan.

Abstract

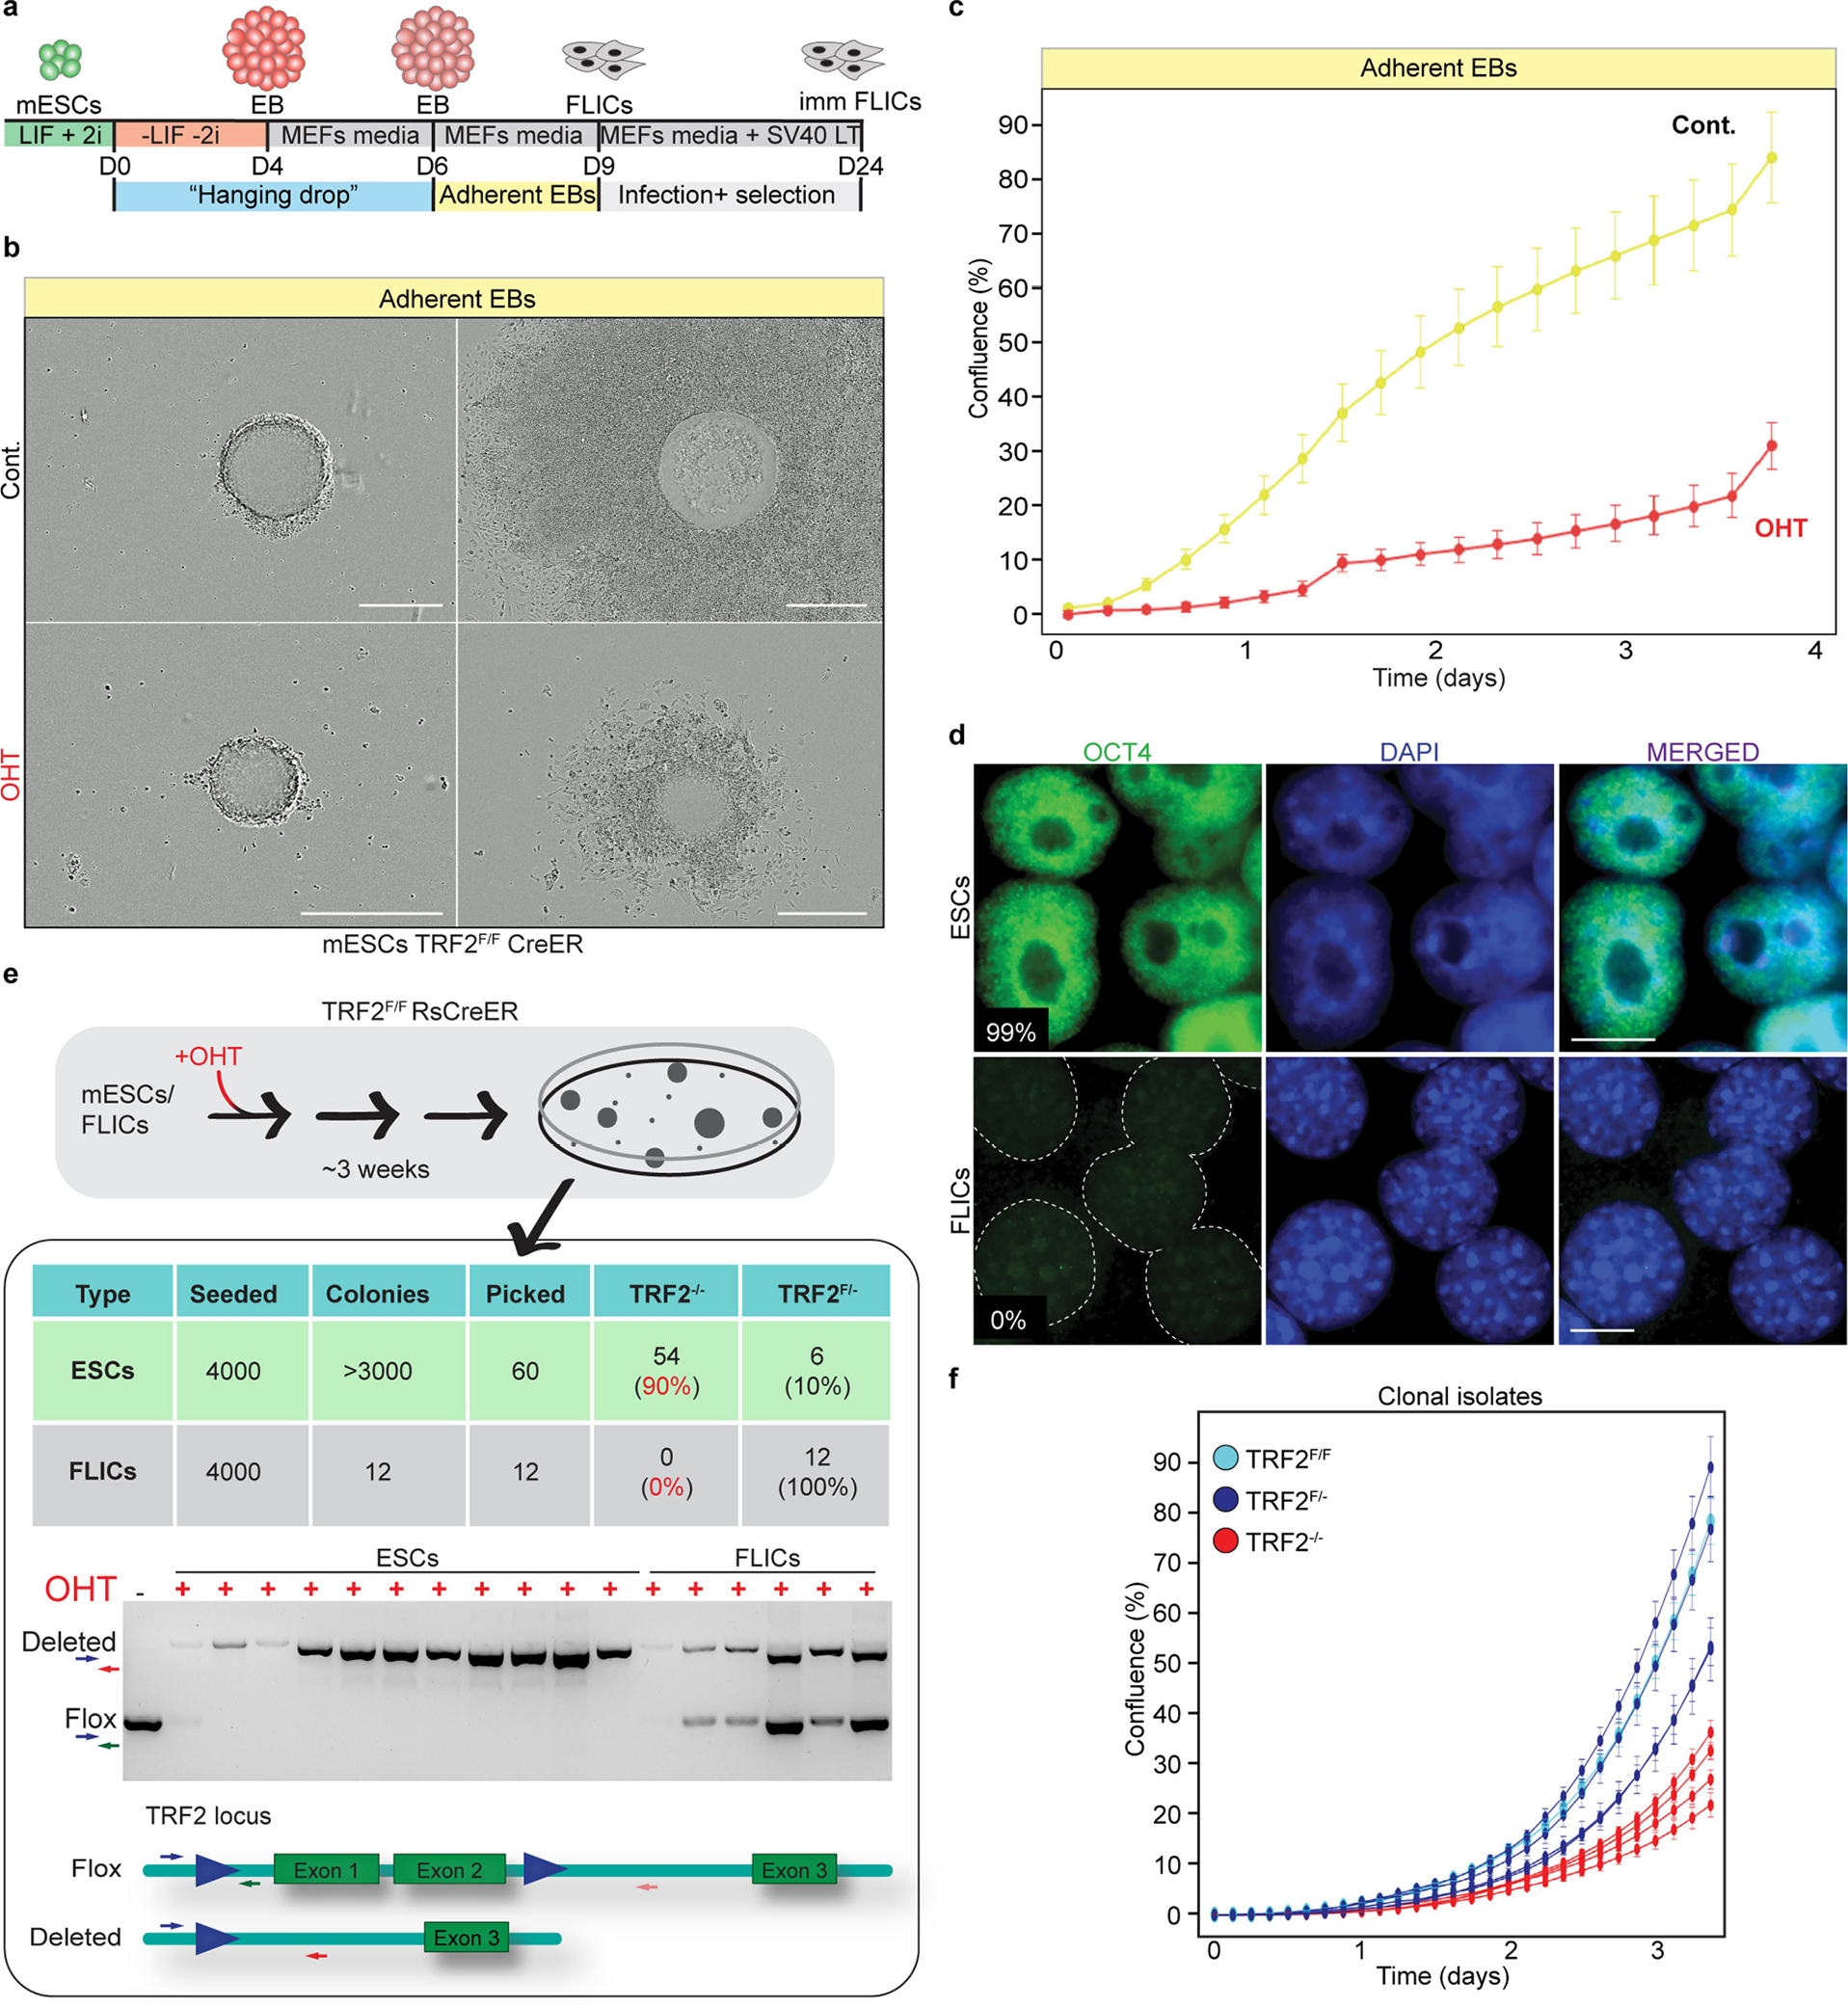
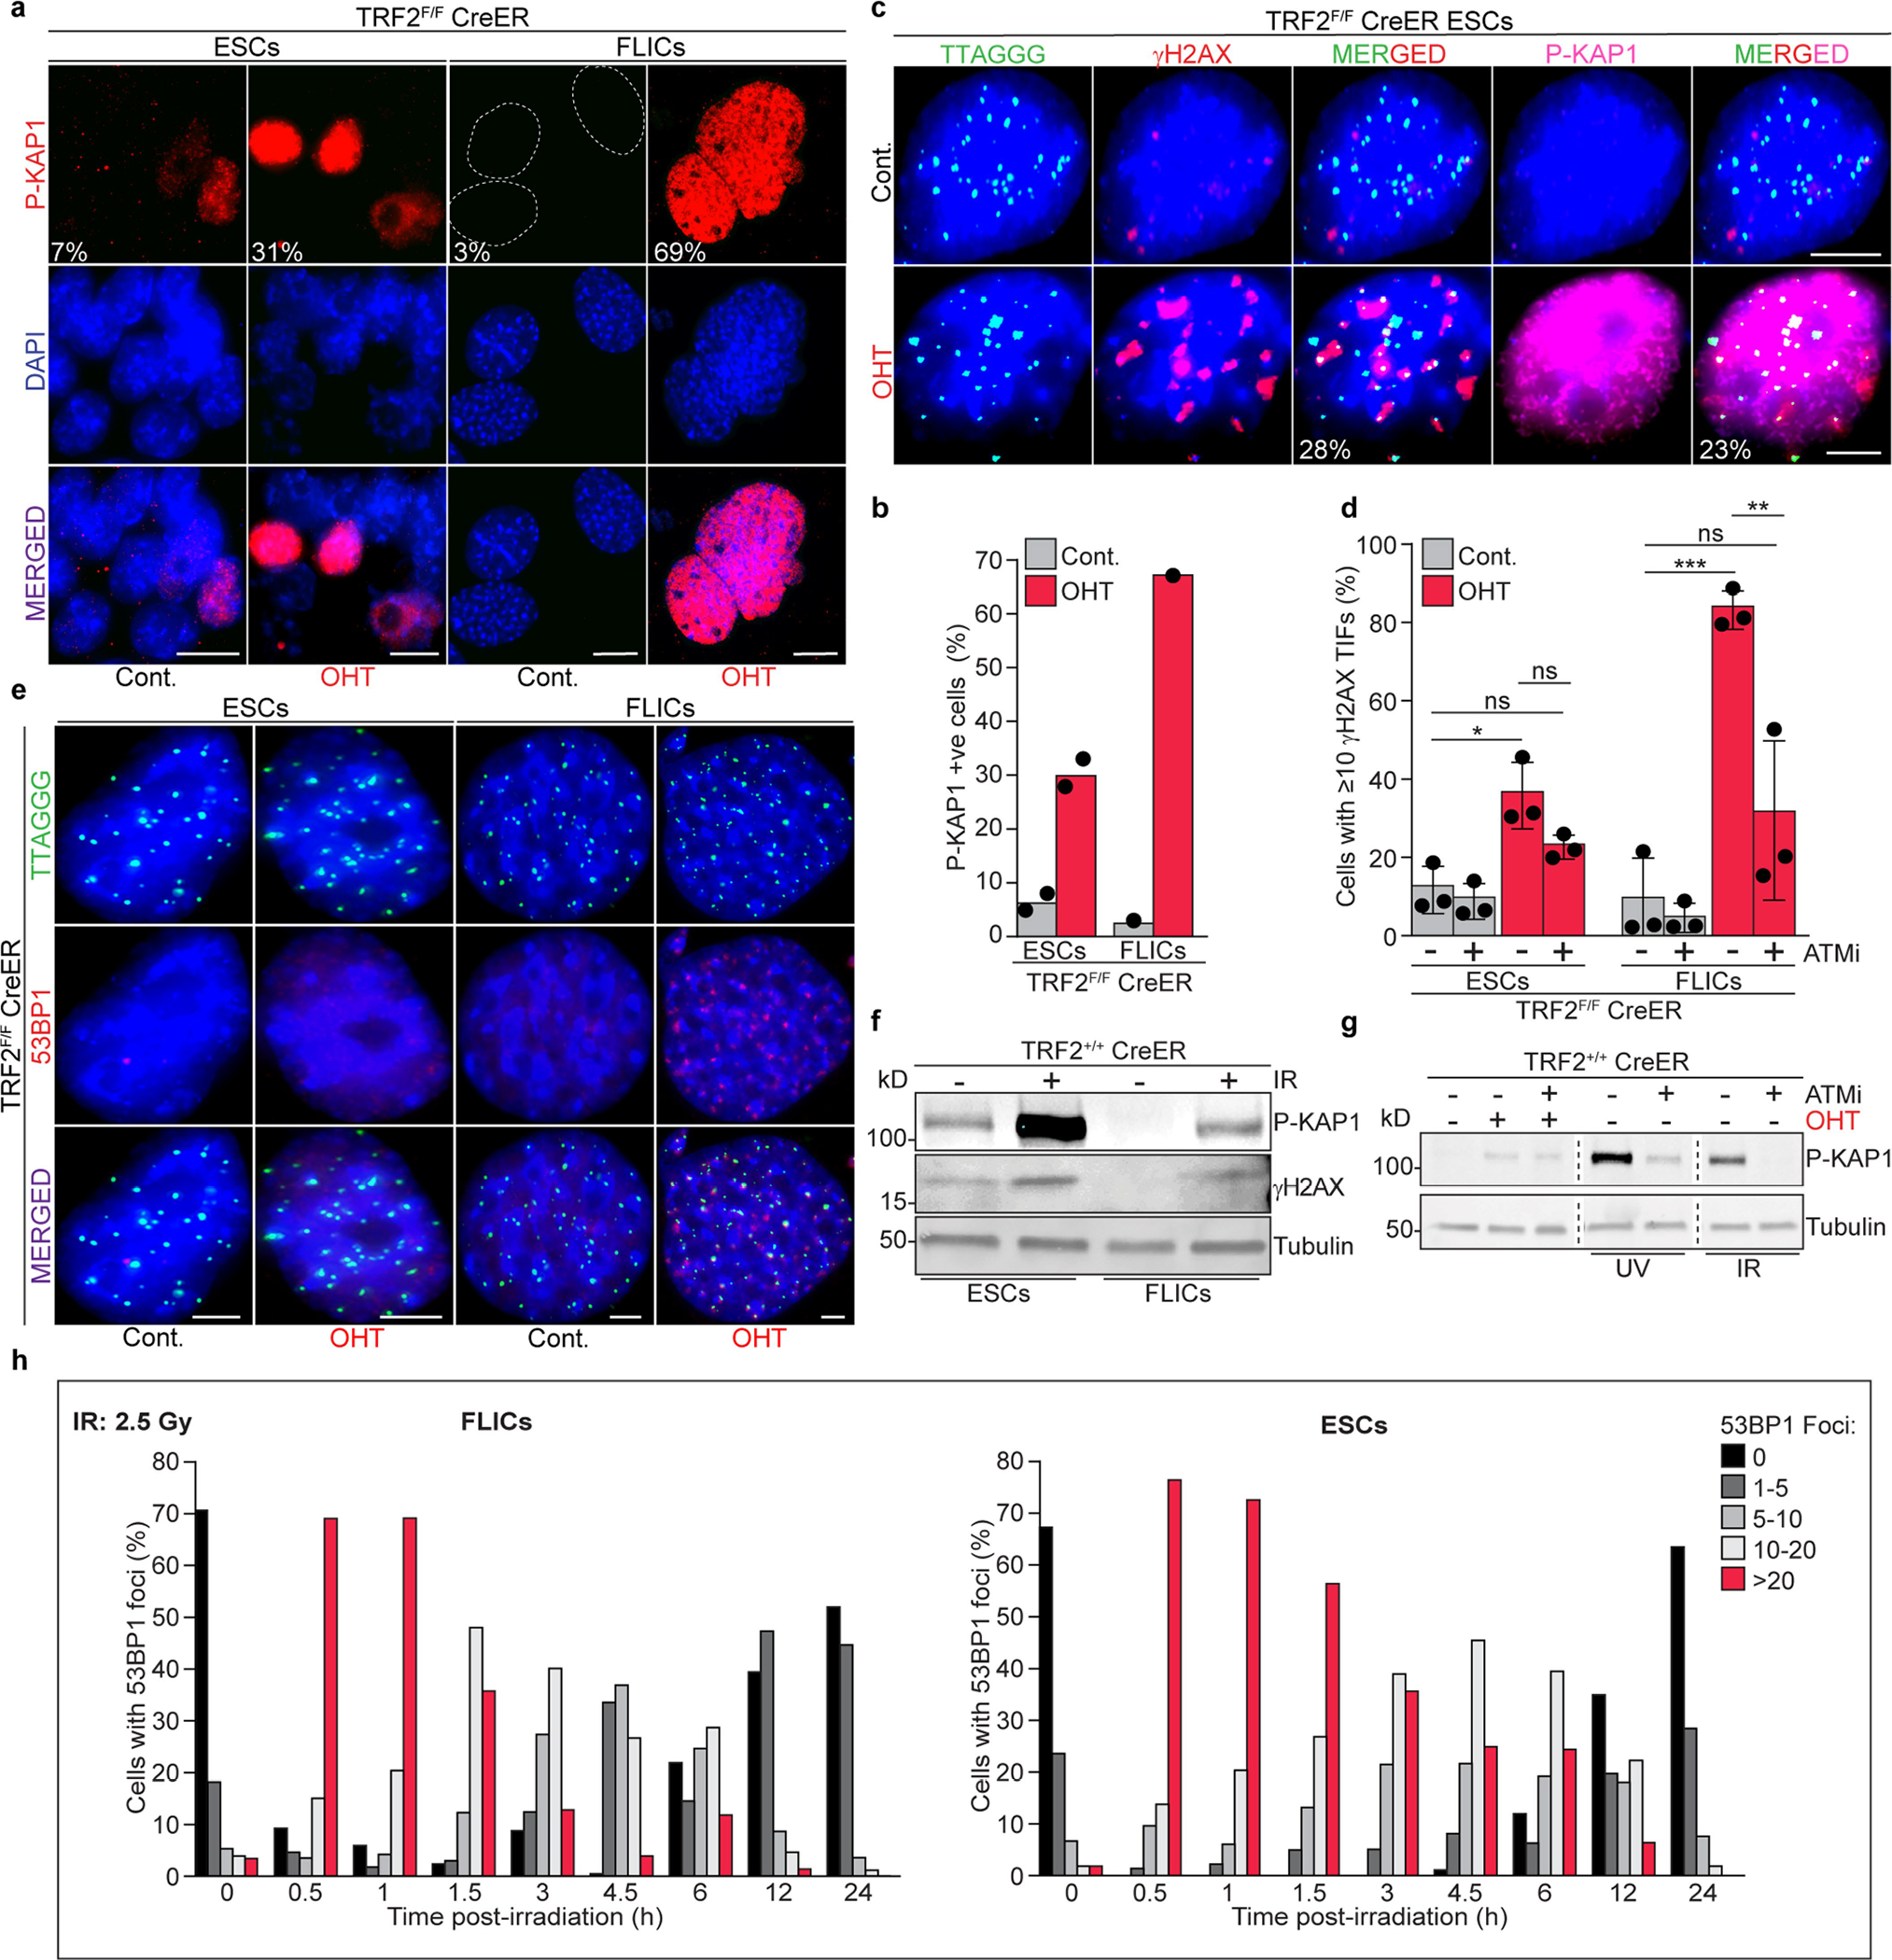
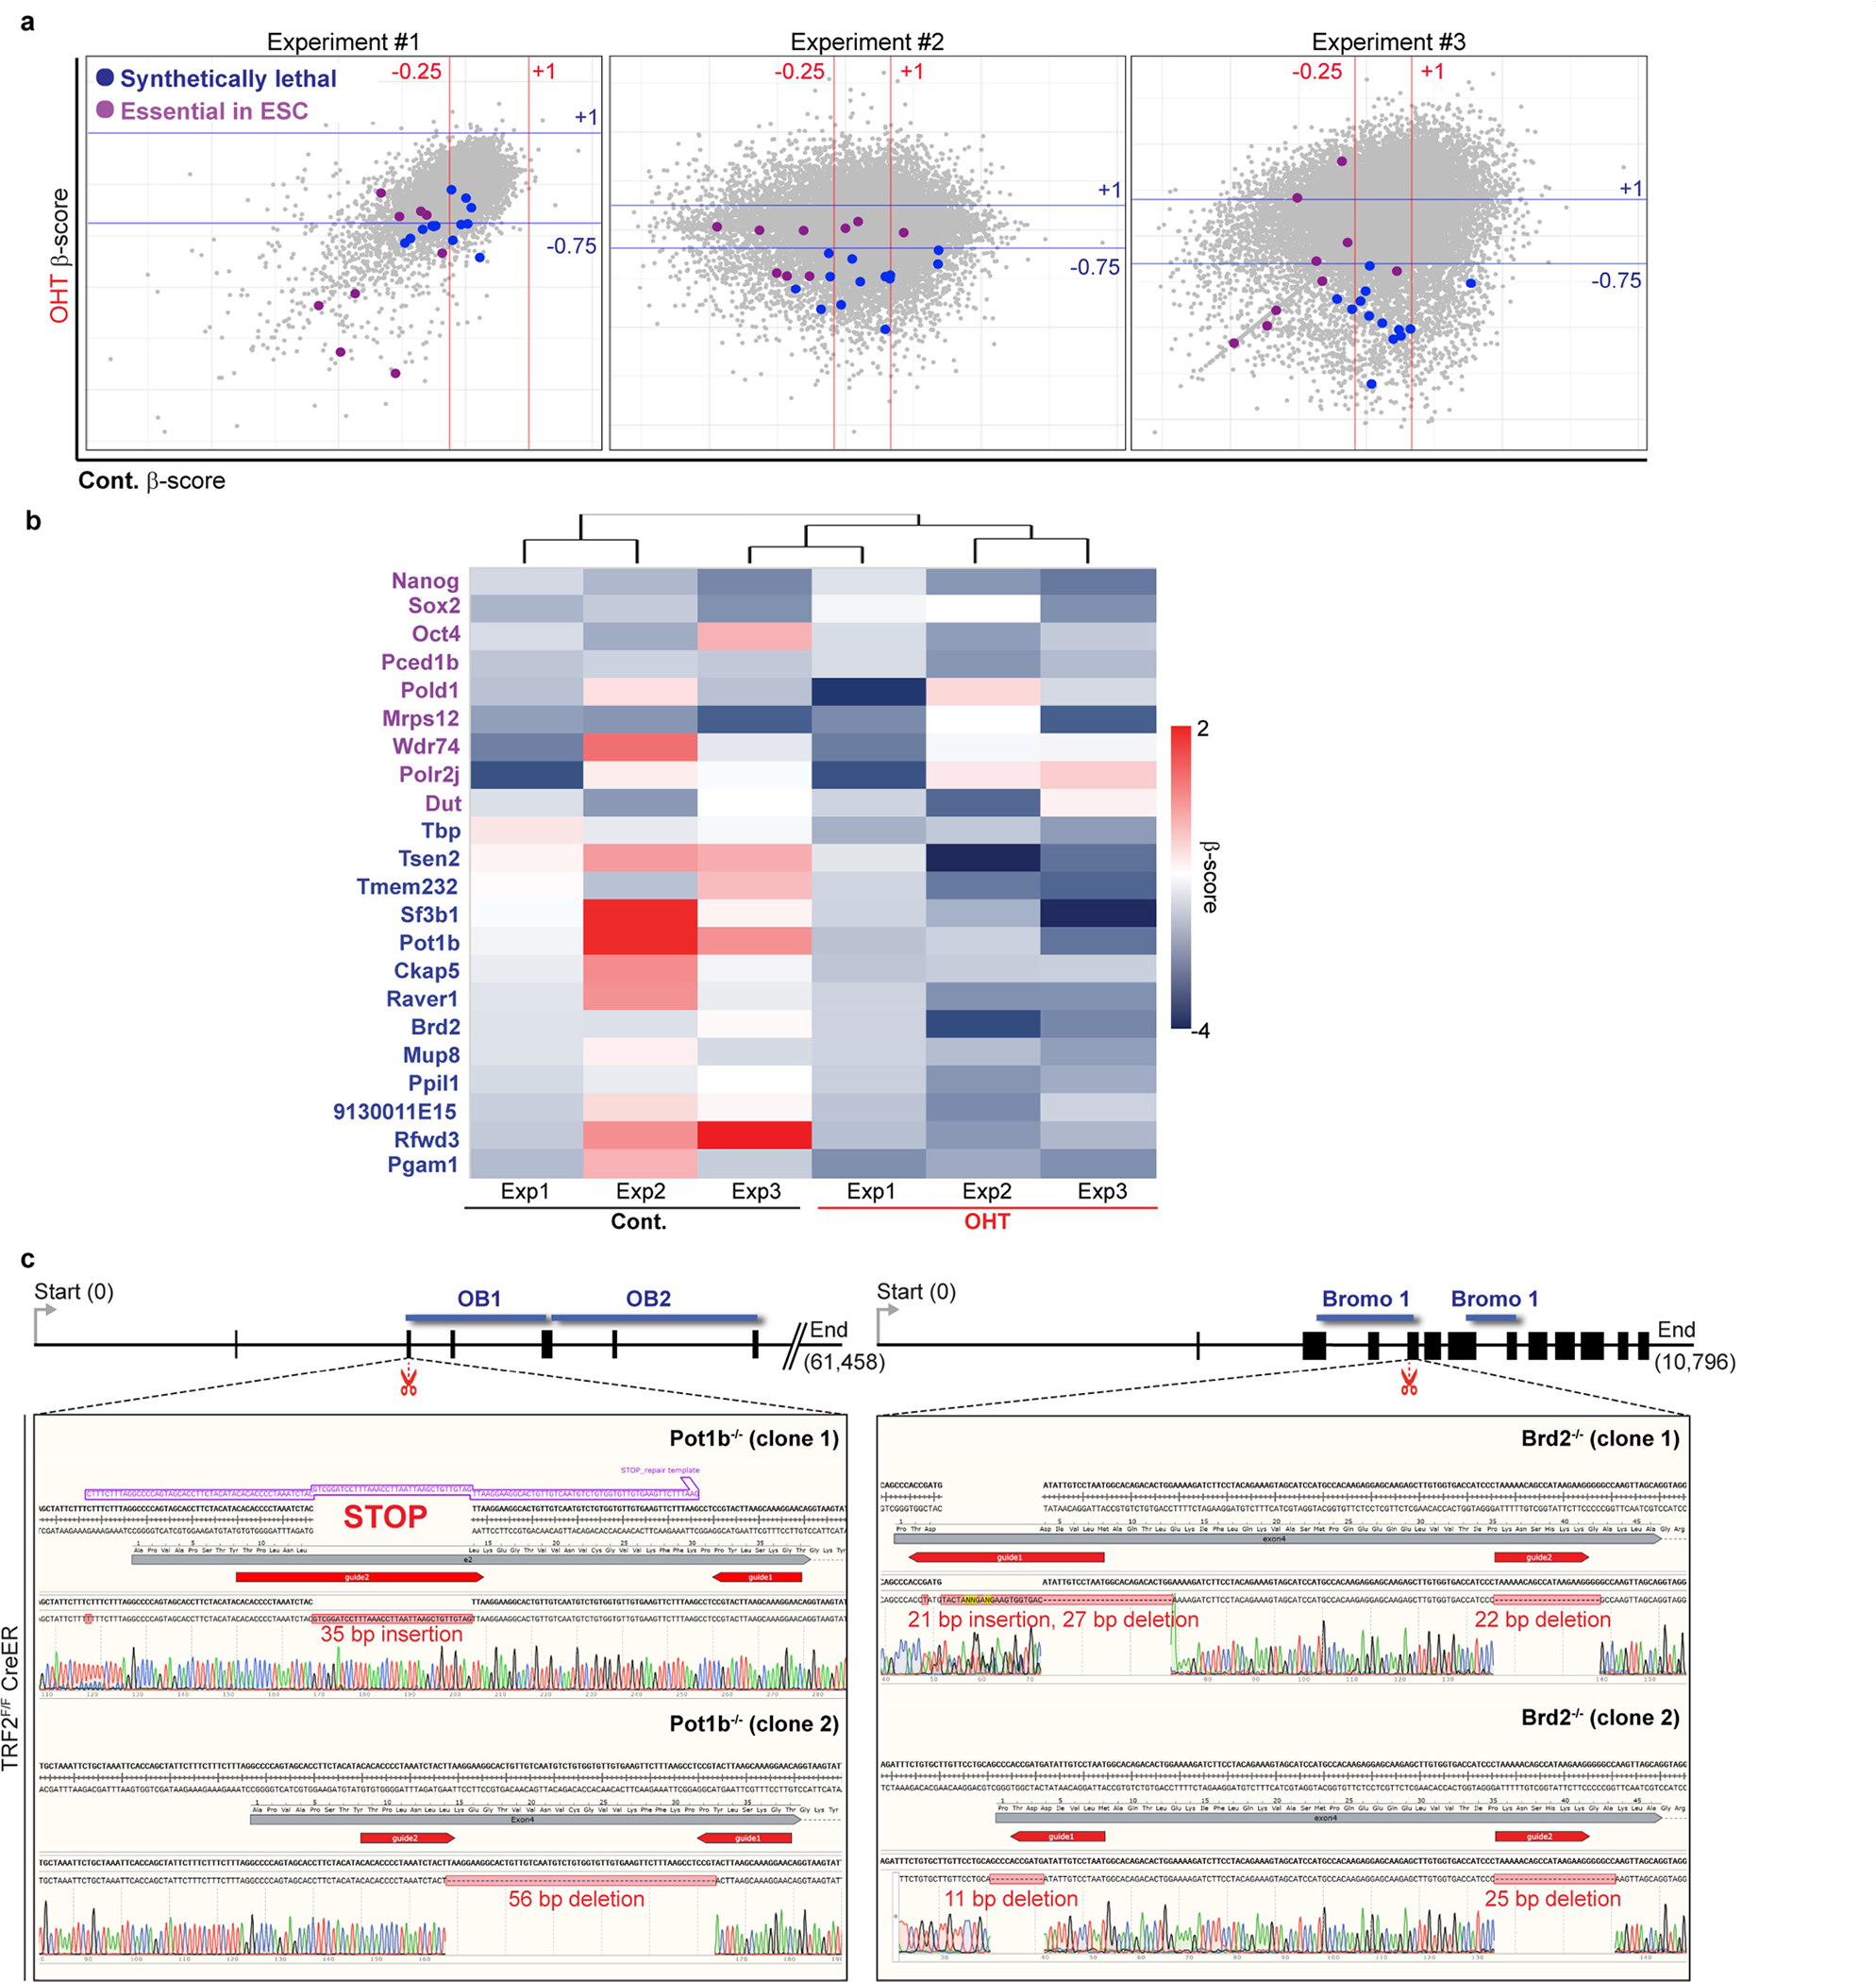
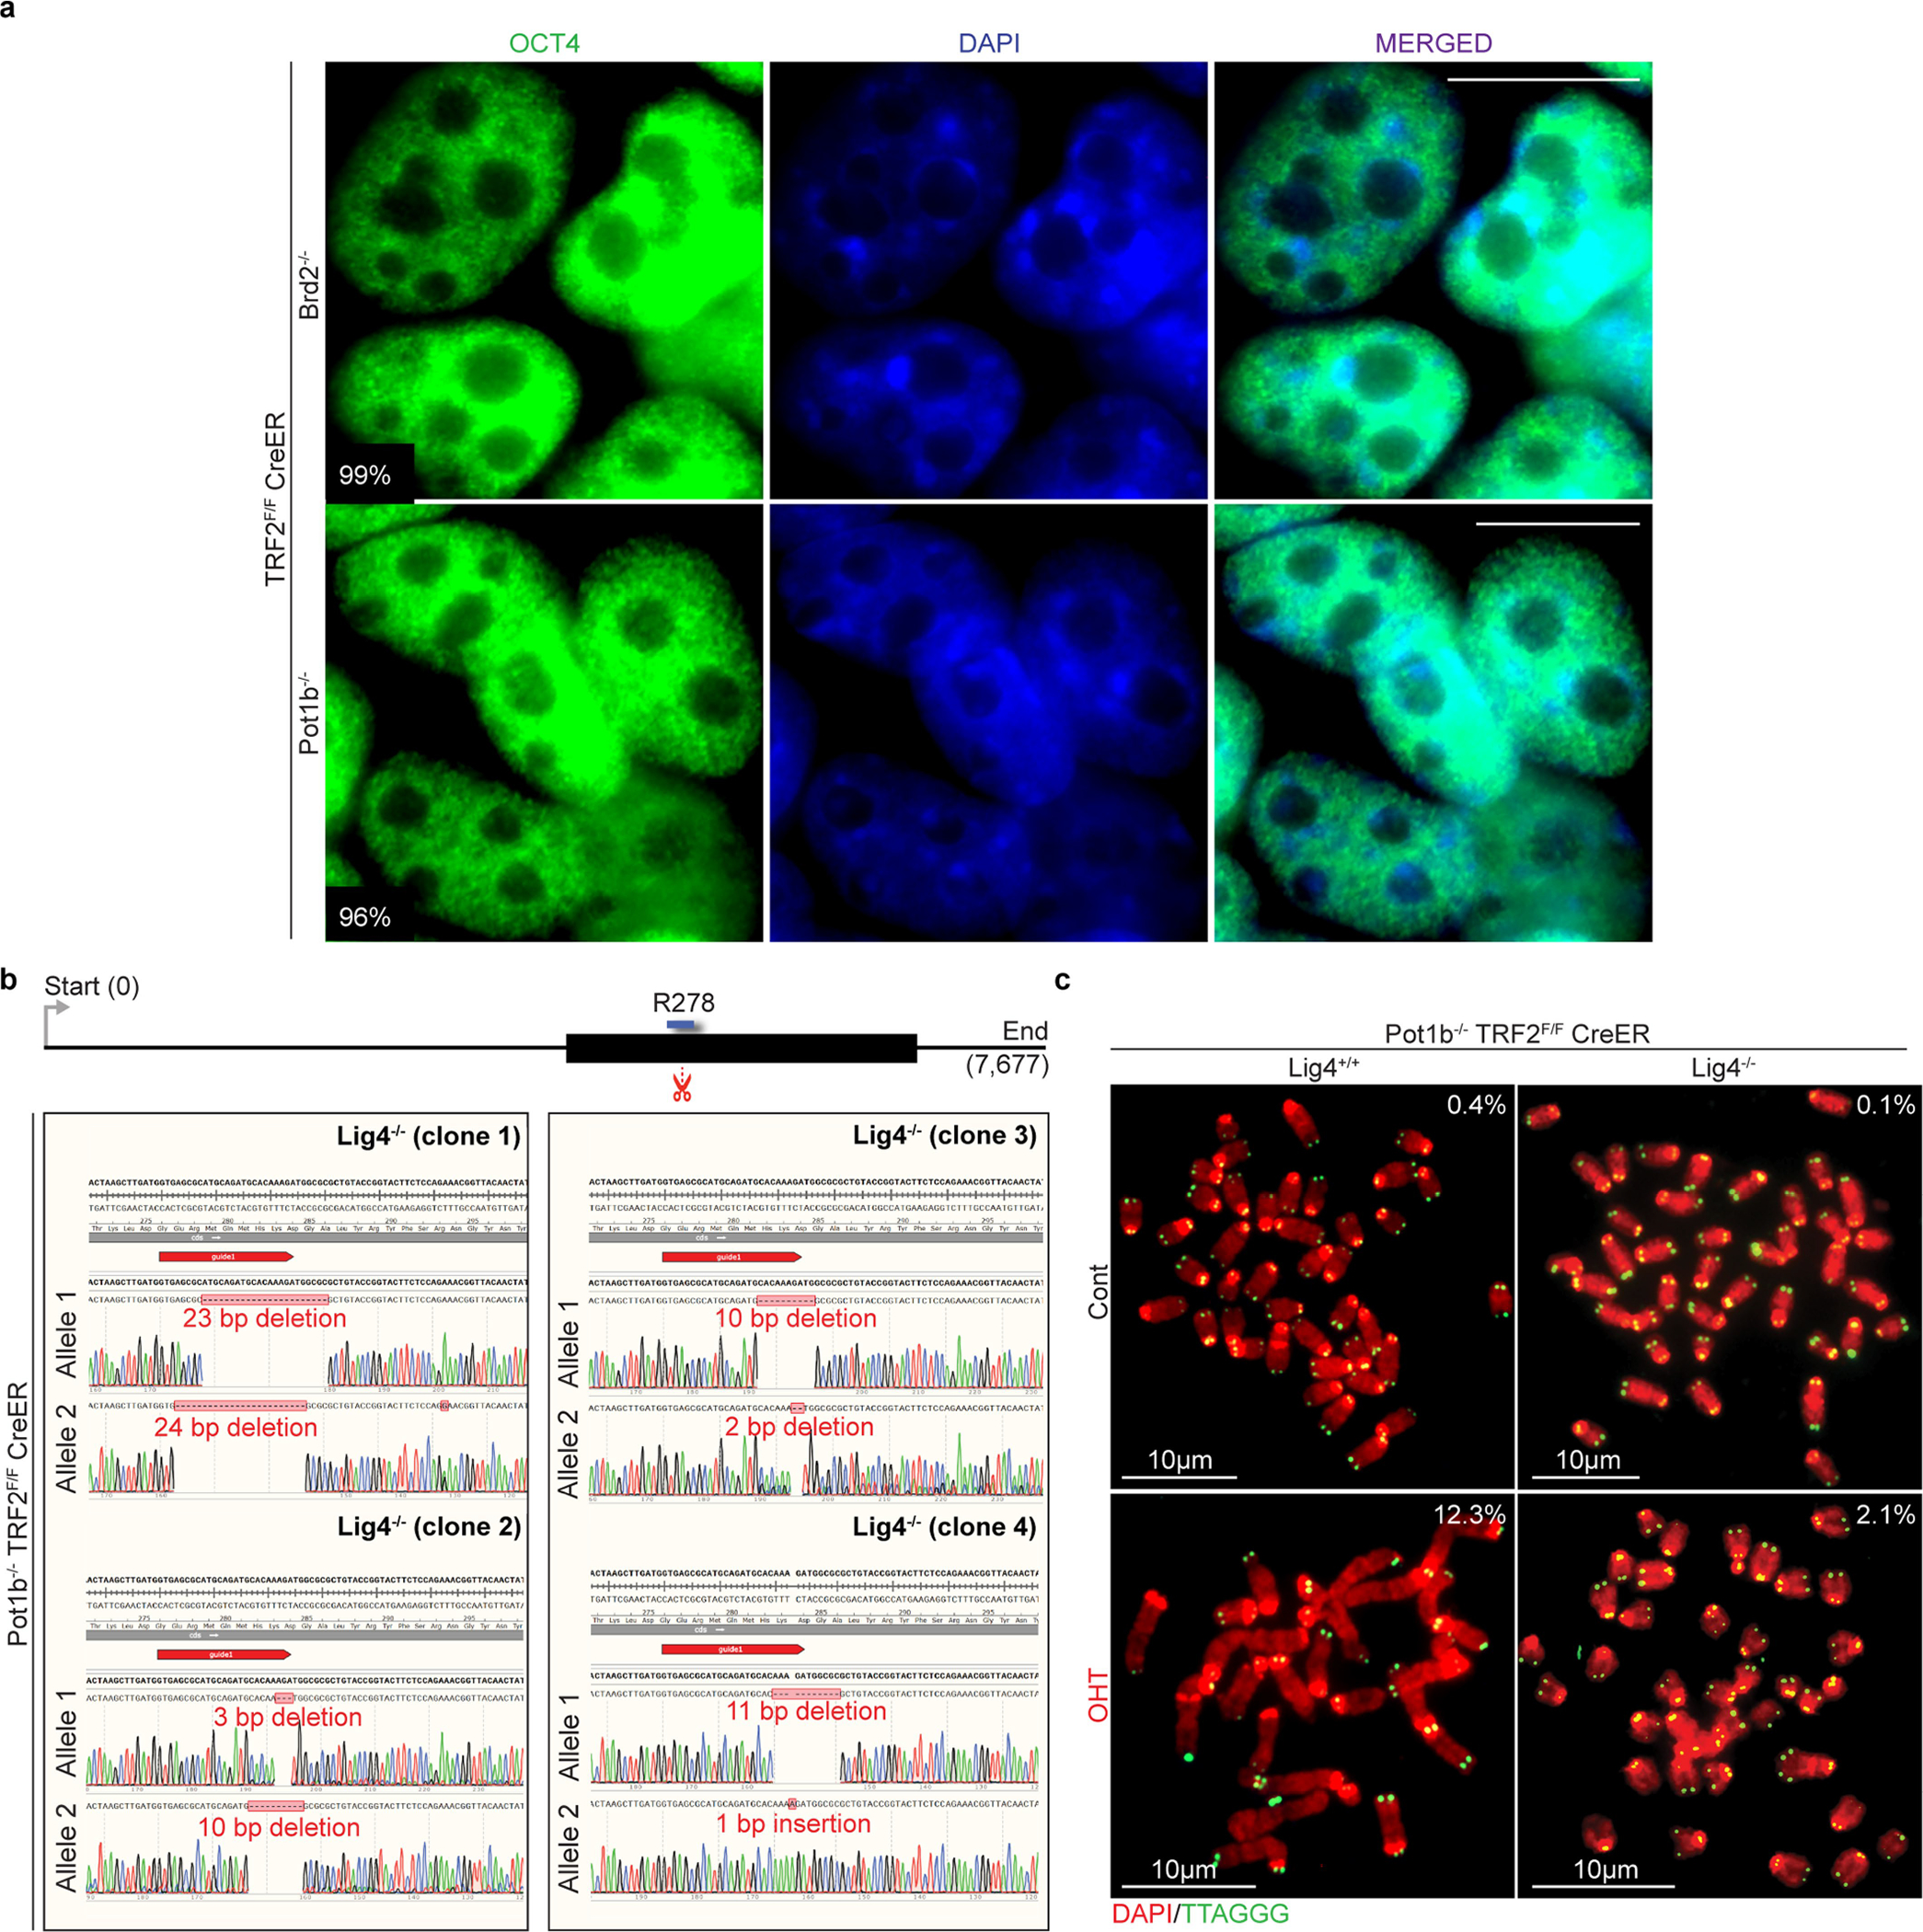
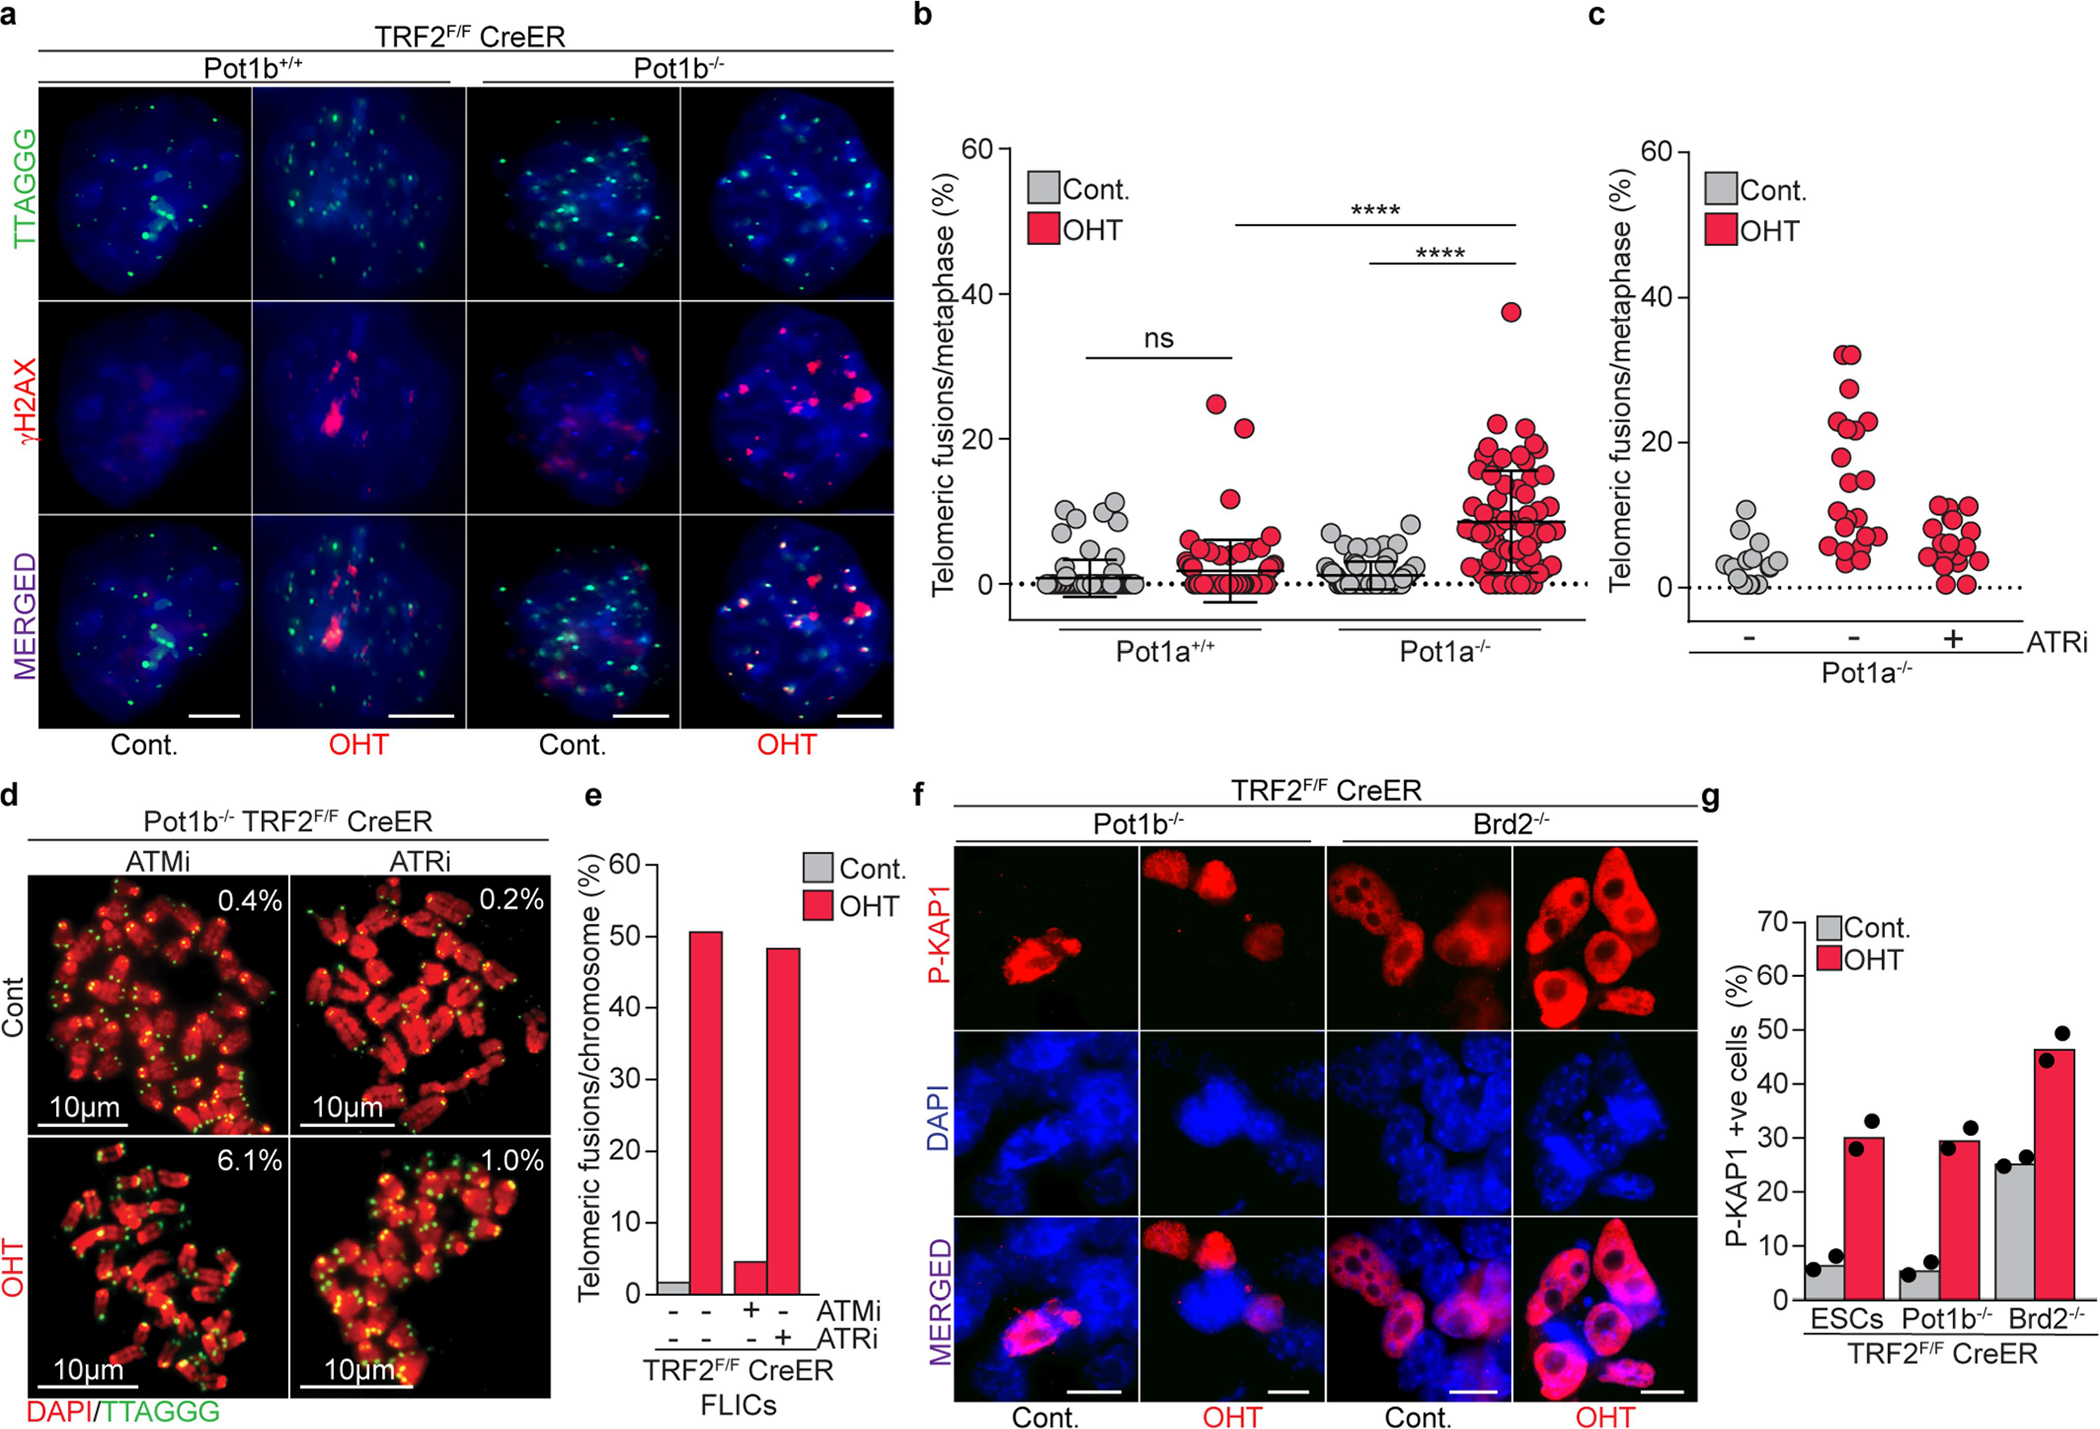
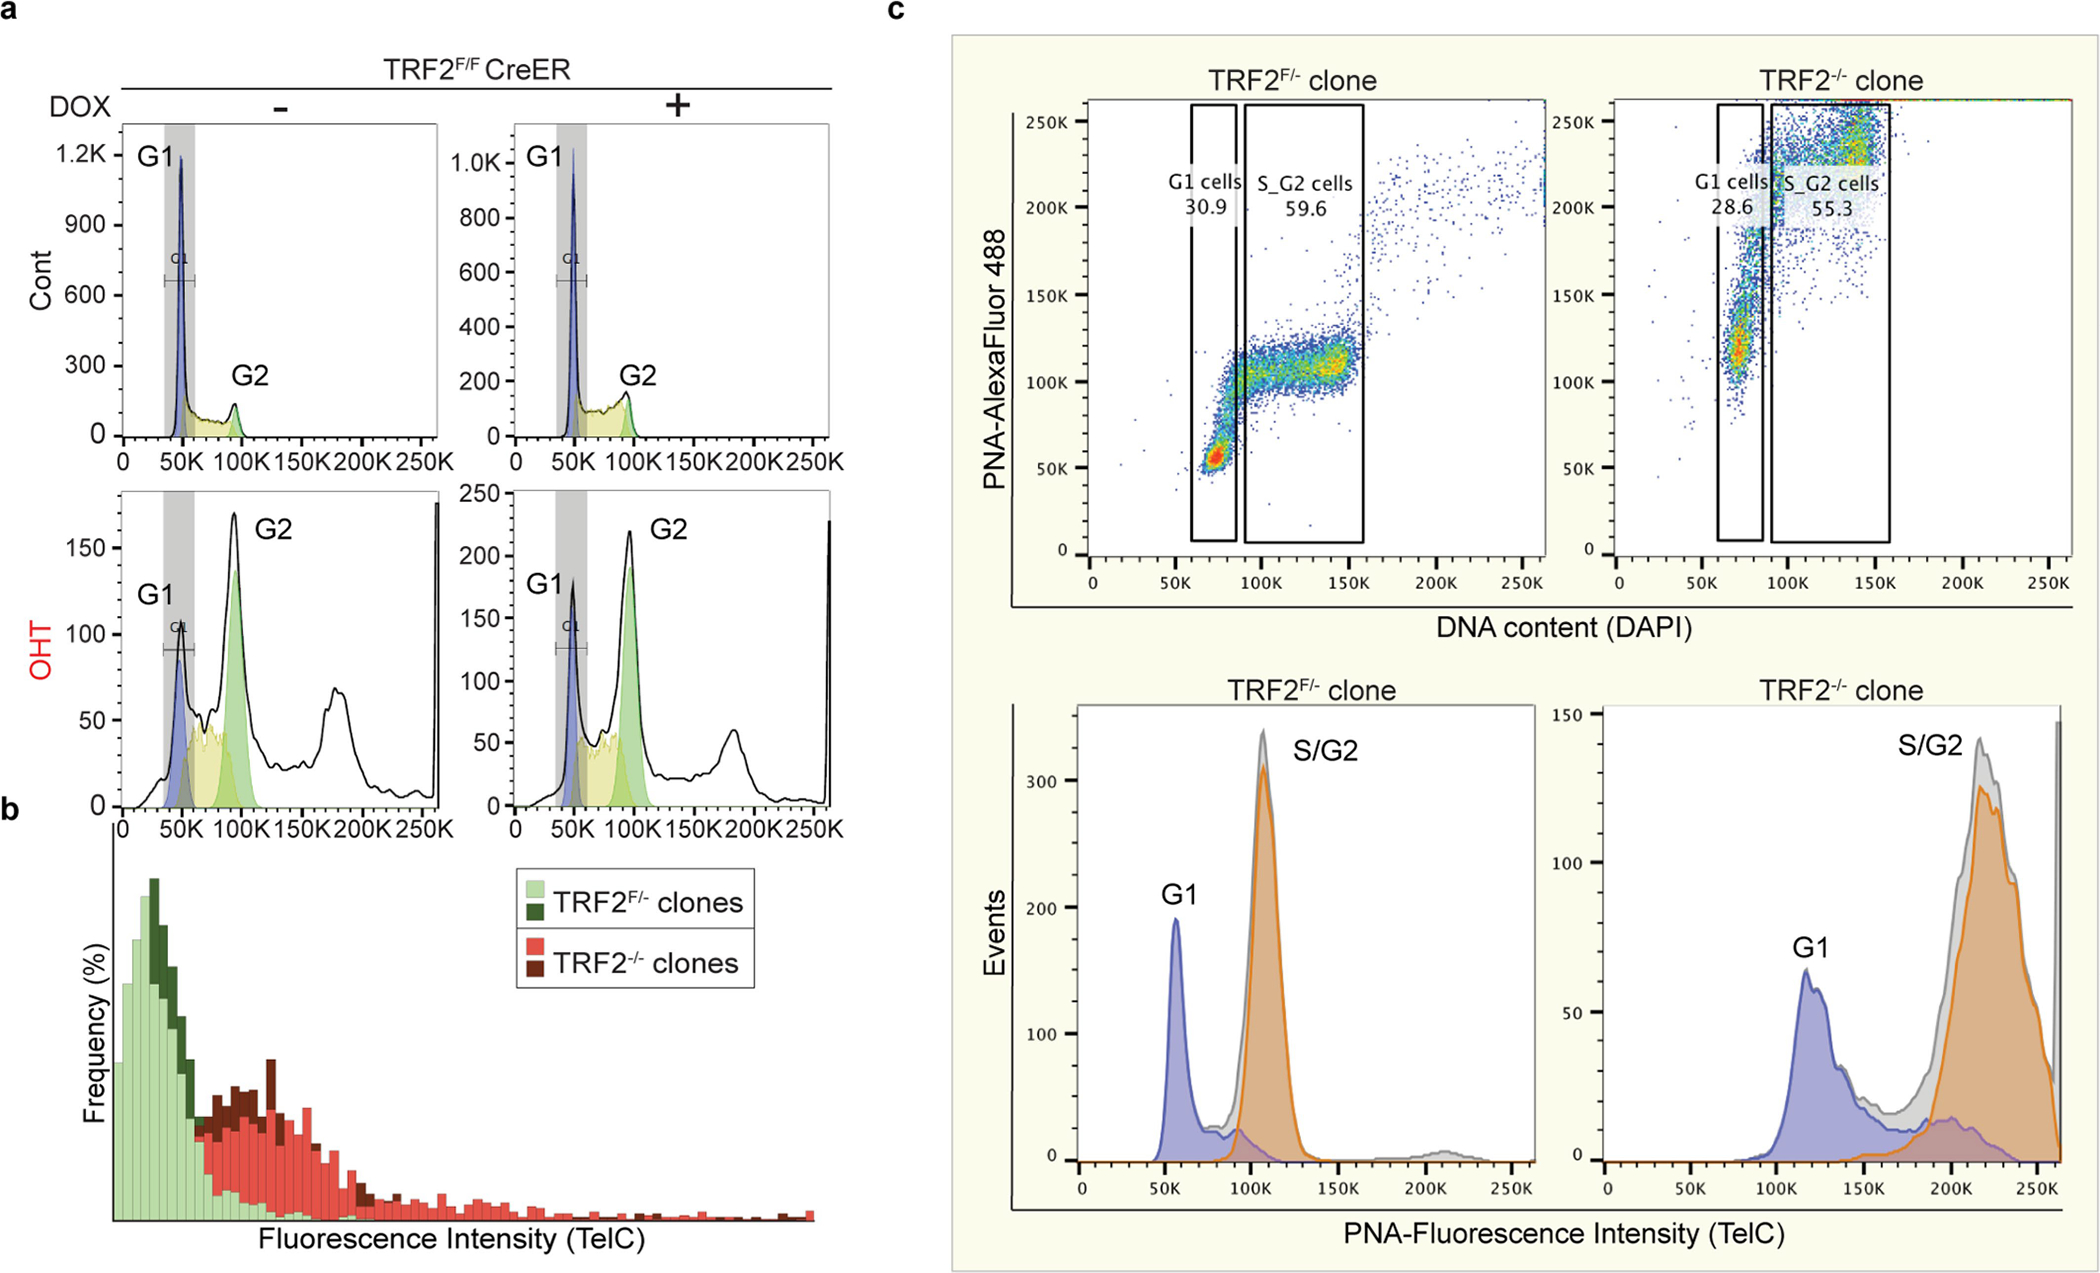
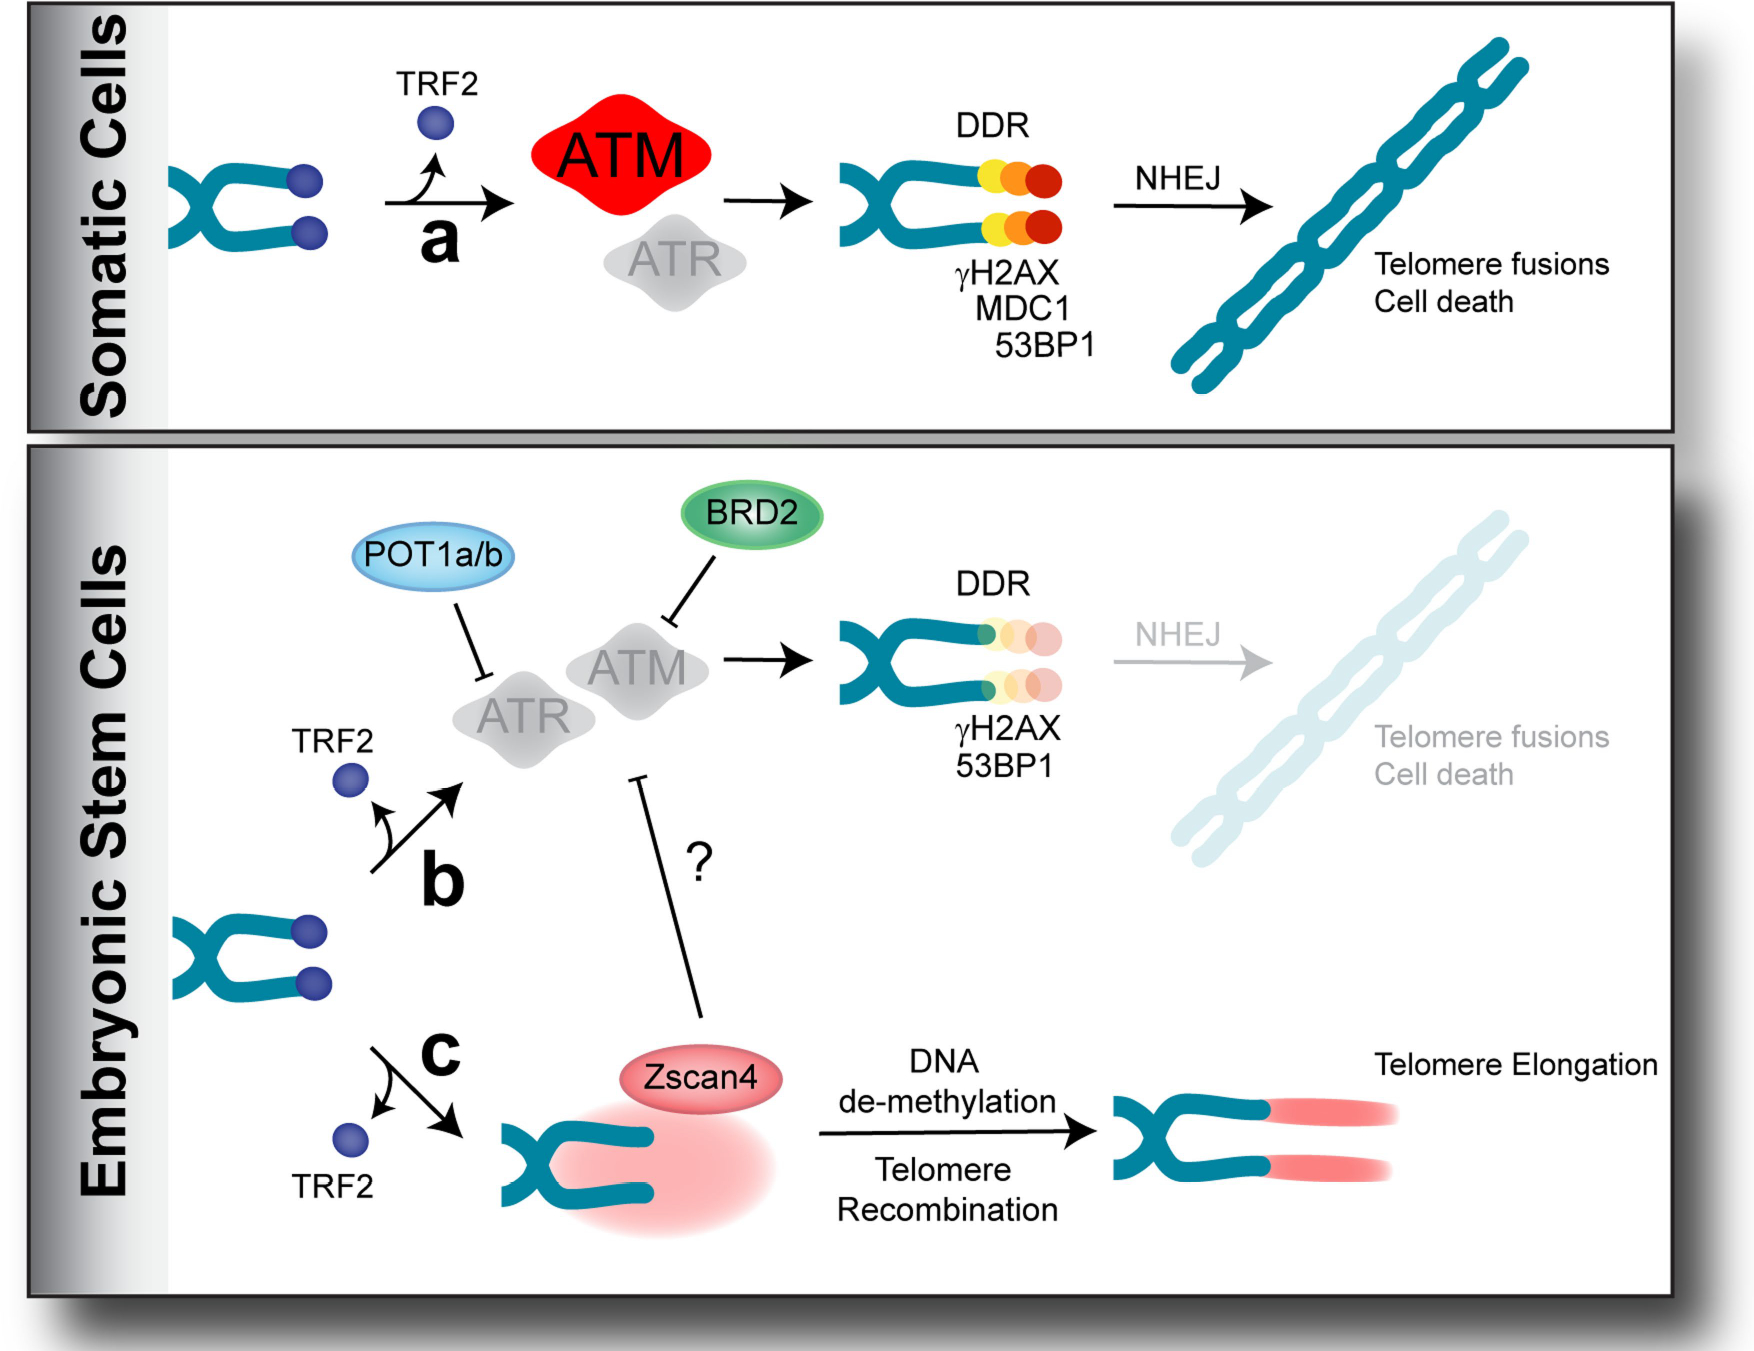
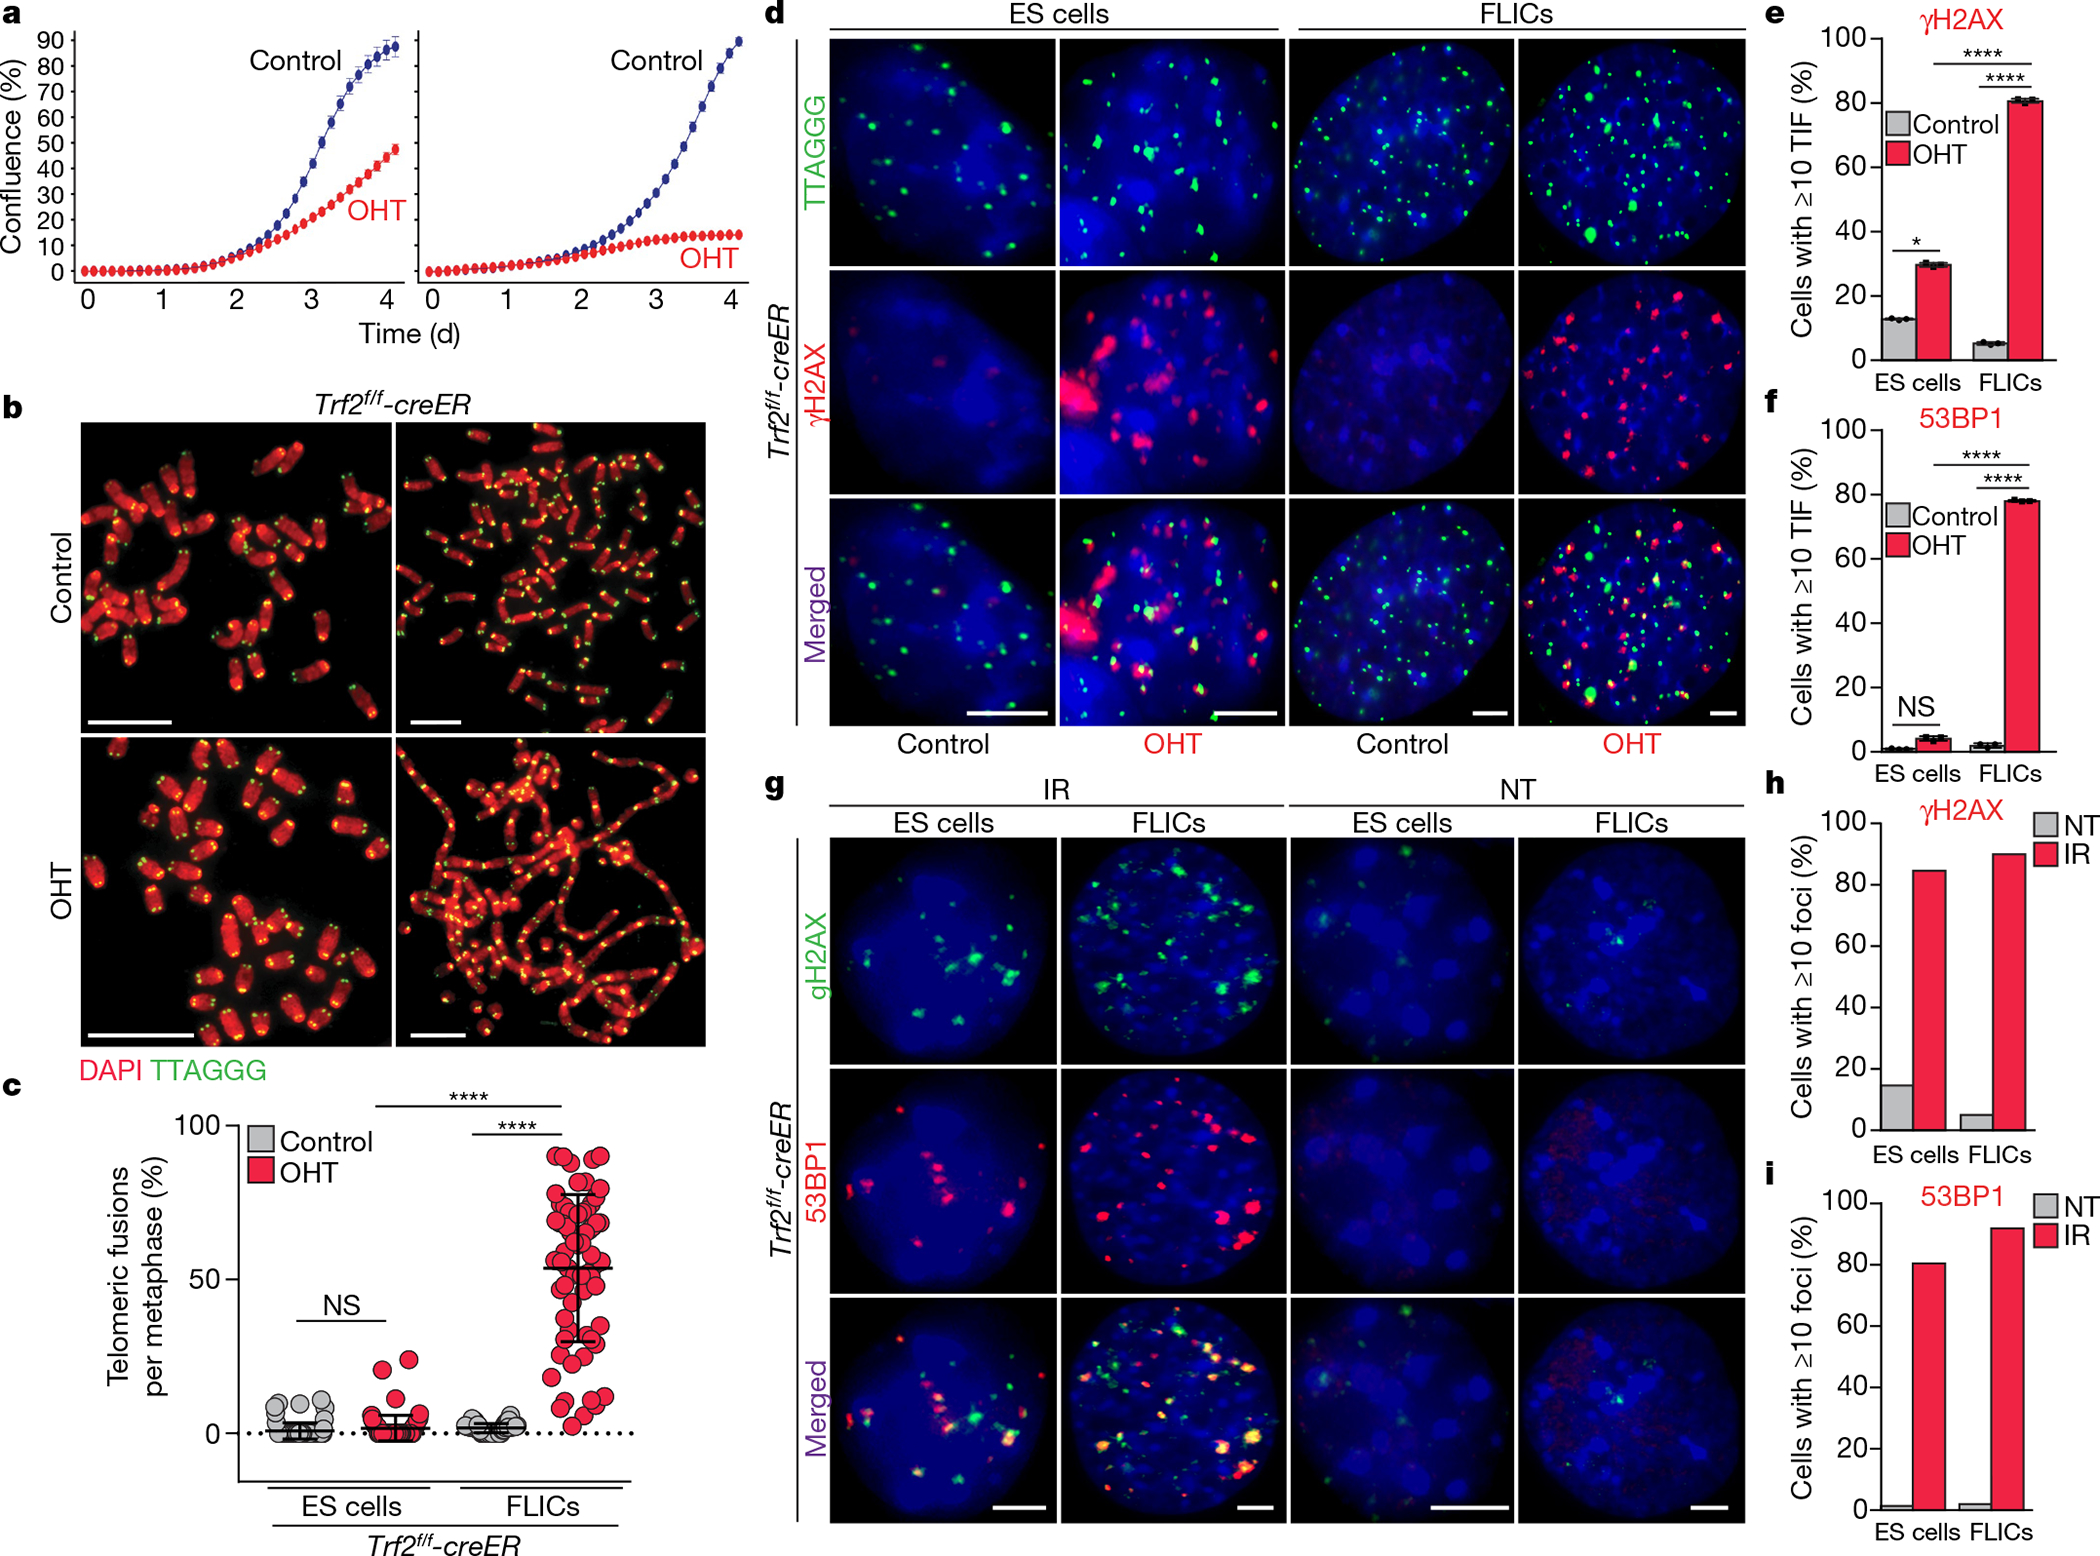
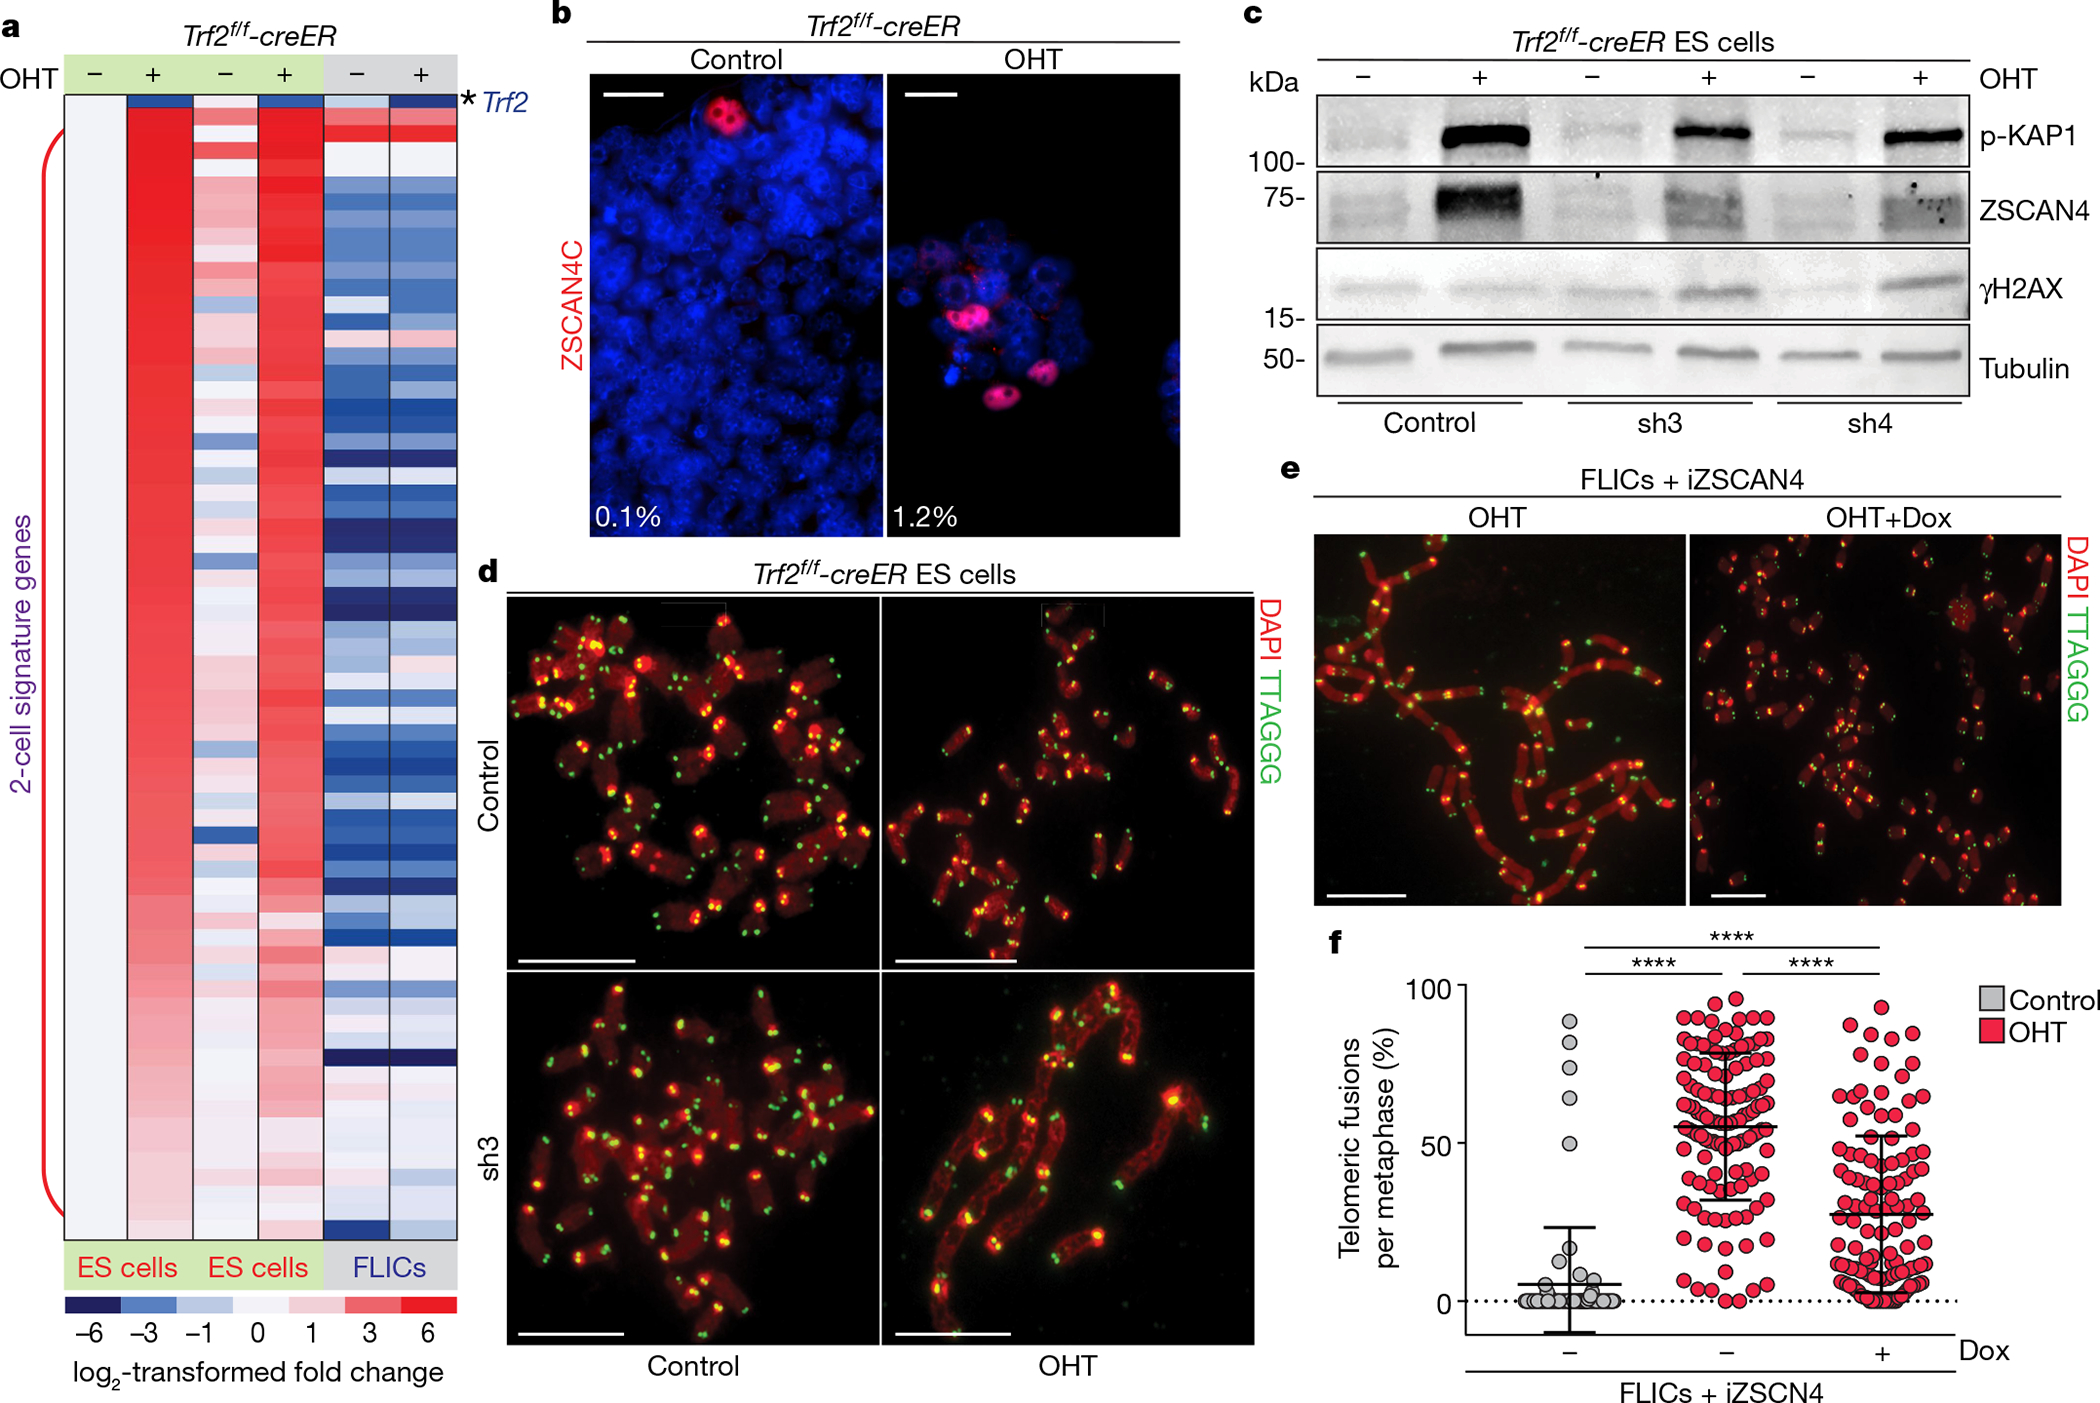
In mammals, telomere protection is mediated by the essential protein TRF2, which binds chromosome ends and ensures genome integrity1,2. TRF2 depletion results in end-to-end chromosome fusions in all cell types that have been tested so far. Here we find that TRF2 is dispensable for the proliferation and survival of mouse embryonic stem (ES) cells. Trf2-/- (also known as Terf2) ES cells do not exhibit telomere fusions and can be expanded indefinitely. In response to the deletion of TRF2, ES cells exhibit a muted DNA damage response that is characterized by the recruitment of γH2AX-but not 53BP1-to telomeres. To define the mechanisms that control this unique DNA damage response in ES cells, we performed a CRISPR-Cas9-knockout screen. We found a strong dependency of TRF2-null ES cells on the telomere-associated protein POT1B and on the chromatin remodelling factor BRD2. Co-depletion of POT1B or BRD2 with TRF2 restores a canonical DNA damage response at telomeres, resulting in frequent telomere fusions. We found that TRF2 depletion in ES cells activates a totipotent-like two-cell-stage transcriptional program that includes high levels of ZSCAN4. We show that the upregulation of ZSCAN4 contributes to telomere protection in the absence of TRF2. Together, our results uncover a unique response to telomere deprotection during early development.


Conflict of interest statement

Competing interests The authors declare no competing interests.

Figures

Extended Data Fig. 1 |
Extended Data Fig. 1 |. Trf2−/− ES cells are not viable upon differentiation.
a, Schematic showing the hanging drops protocol used to generate embryoid bodies (EBs) and differentiated FLICs. b, Representative images of embryoid bodies derived from control and TRF2-depleted ES cells before adhesion (left) and 3 days after induction of differentiation (right). The experiment was performed three times with similar results. Scale bar, 400 μm. c, Growth properties of embryoid bodies derived from TRF2-proficient (control (cont.)) or TRF2-depleted ES cells (OHT) undergoing differentiation measured by confluence. Mean and s.d. are derived from the analysis of 47 images per condition. d, Immunofluorescence staining for the pluripotency marker OCT4 in ES cells and FLICs. The percentage of positive cells is shown. The experiment was performed three times with similar results. Scale bar, 10 μm. e, Schematics of the experimental approach used to derive single-cell isolates 3 weeks after OHT-mediated TRF2 deletion in ES cells and FLICs. The table summarizes the number of cells seeded, the number of colonies obtained and the TRF2 genotype of the isolated colonies. An example of a genotyping PCR performed on the resulting clones and the representation of the Trf2-floxed and Trf2-null alleles is shown below. The unprocessed image is provided in the Source Data for Extended Data Fig. 1. f, Growth property measured by confluency of 4 heterozygous ES cells clones (Trf2f/) (dark blue) and 4 knockout clones (Trf2−/−) (red) derived from the experiment described in e, and the parental ES cells (Trf2f/f) (light blue). Mean and s.d. are derived from the analysis of 36 images per condition.
Extended Data Fig. 2 |
Extended Data Fig. 2 |. Reduced activation of DDR in ES cells following telomere deprotection.
a, Representative immunofluorescence for KAP1 phosphorylated at S824 (p-KAP1) in ES cells and FLICs either before (cont.) or after Cre induction (OHT). Scale bar, 10 μm. Percentages of p-KAP1-positive cells are indicated in the figure as well as in b. The experiment was performed twice for ES cells with similar results and once for FLICs. c, Representative immunofluorescence staining for γH2AX (red), p-KAP1 (pink) and FISH staining for telomeric DNA (green) of TRF2-proficient (cont.) and TRF2-deficient (OHT) ES cells. Percentage of TIF-positive cells (third panel from left) and percentage of cells with TIF and positive for p-KAP1 (last panel from left) are shown. Scale bar, 4 μm. d, Percentage of ES cells and FLICs with more than 10 γH2AX TIF. Where indicated, TRF2-proficient (cont.) or TRF2-deficient (OHT) cells were treated with an ATM inhibitor. Data panels in the figure are representative of three experiments. ns, non-significant (P ≥ 0.05), *P < 0.05, **P < 0.01, ***P < 0.001, one-way ANOVA. e, 53BP1 (red) localization at telomeric DNA (green) in TRF2-proficient (cont.) and TRF2-deficient (OHT) ES cells and FLICs. Quantification of these data are reported in Fig. 1f. Scale bar, 4 μm. f, Western blotting analysis for p-KAP1, γH2AX and—as a loading control—tubulin. Protein lysates were isolated from ES cells or FLICs either mock-treated or gamma irradiated (2.5 Gy) 30 min before collection. g, Western blotting analysis for the expression of p-KAP1 or—as loading control—tubulin. Protein lysates were derived from ES cells that were either untreated or treated with the ATM inhibitor, as indicated. Where indicated, cells were treated with OHT to induce TRF2 depletion, with UV (1,200 J per m2) or with gamma irradiation (2.5 Gy). h, Dissipation of 53BP1 DNA damage foci following IR-induced damage in FLICs (left) and ES cells (right). Cells were treated with gamma irradiation (2.5 Gy) and fixed at the indicated time points. 0, non-treated control samples. For each time point, at least 140 nuclei were scored and the percentage of cells with the indicated number of 53BP1 foci at any given time point is indicated; additional details can be found in Supplementary Table 2.
Extended Data Fig. 3 |
Extended Data Fig. 3 |. Identification of synthetically lethal genes in TRF2-deficient ES cells.
a, Scatter plots from three independent CRISPR–Cas9 screens from Fig. 2b. Genes that are synthetically lethal with TRF2 knockout are labelled with dark blue dots. Genes that are essential for ES cells are labelled with magenta dots. b, Heat map displaying the essentiality score (β-score) of the 13 candidate synthetically lethal genes (dark blue), and for 8 genes that have previously been described as essential in ES cells (purple), across 3 independent experiments. c, Schematic of the Pot1b and Brd2 genomic loci showing genome organization, the predicted CRISPR–Cas9 cut site (scissors, red) and key domains required for protein function (blue). Sanger sequencing of Pot1b−/− (exon 2) and Brd2−/− (exon 4) for different clones isolated is shown. For Pot1b, a repair template cassette containing multiple STOP codons was used. gRNA sequences are highlighted in red.
Extended Data Fig. 4 |
Extended Data Fig. 4 |. Codepletion of TRF2 and POT1A or POT1B result in LIG4-dependent end-to-end fusions.
a, Immunofluorescence staining for the pluripotency marker OCT4 (green) in Pot1b−/− and Brd2−/− ES cells. The percentage of positive cells is shown. Scale bar, 10 μm. b, Schematic of the Lig4 genomic locus, showing the predicted CRISPR–Cas9 cut site (scissors, red), and the sequence coding the essential R278 residue (blue). Sanger sequencing results showing successful gene editing of the Lig4 locus in four independent clones; the gRNA sequence is highlighted in red. c, Metaphases from ES cells of indicated genotypes. The percentage of telomeres engaging in telomere fusions are shown. In total, three independent experiments were performed. For a detailed summary of the data, see Supplementary Table 1 and Source Data for Extended Data Fig. 4.
Extended Data Fig. 5 |
Extended Data Fig. 5 |. Pot1b, Pot1a and Brd2 depletion in TRF2-null cells induce the DDR pathway.
a, Representative IF–FISH for γH2AX (red) and telomeres (green) of control (cont.) and TRF2-depleted (OHT) ES cells with the indicated Pot1b genotype. Quantifications are provided in Fig. 3e. Scale bar, 4 μm. b, Scatter plot representing the distribution of telomeric fusions in control (cont.) and TRF2-depleted (OHT) ES cells of the indicated Pot1a genotype. Each dot represents the percentage of telomeres fused in one metaphase spread. For detailed information, see Supplementary Table 1 and Source Data for Extended Data Fig. 5 (n = 3 independent experiments). c, Scatter plot representing the distribution of telomeric fusions in control (cont.) and TRF2-depleted (OHT) Pot1a−/− ES cells that were either left untreated or treated with the ATR inhibitor (ATRi). Each dot represents the percentage of telomeres fused in one metaphase spread. For detailed information, see Supplementary Table 1 and Source Data for Extended Data Fig. 5. d, Metaphases derived from TRF2-proficient (cont.) or TRF2-deficient (OHT) Pot1b−/− ES cells treated with ATMi (left) or ATRi (right). Percentage of telomere fusions were calculated from a total of >19 metaphases per genotype. e, Graph representing the percentage of telomeric fusions in FLICs of the indicated genotype and treatment. In total, >30 metaphases per genotype and treatment were analysed. f, Representative immunofluorescence for p-KAP1 (red) in ES cells of the indicated genotype in the presence (cont.) or absence of TRF2 (OHT). Scale bar, 10 μm. g, Percentage of p-KAP1-positive cells in response to TRF2 depletion (OHT) in ES cells of indicated genotype and in control cells. Additional information for be is provided in Supplementary Table 1 and Source Data for Extended Data Fig. 5.
Extended Data Fig. 6 |
Extended Data Fig. 6 |. ZSCAN4 contributes to end protection in TRF2-depleted cells.
a, Differentially expressed genes in response to TRF2 depletion in ES cells (left) and differentiated cells (FLICs) (right). Volcano plots represent the log2-transformed fold change (FC) (x axis) and the −log2(P value) (y axis). Transcriptional profiling was performed three days after OHT-mediated TRF2 deletion. In the top panels, genes downregulated (P < 0.005 and FC < −2) upon OHT treatment are labelled with dark blue dots, and upregulated (P < 0.005 and FC >2) are labelled with red dots. Bottom panels, genes expressed in the 2-cell stage are labelled in purple, shelterin components are labelled in green. b, Quantifications of telomeric fusions detected in ES cells following ZSCAN4C downregulation (relative to Fig. 4d). Scatter plot representing the distribution of telomeric fusions. Each dot represents the percentage of telomeres fused in one metaphase spread. For detailed analysis information, see Supplementary Table 1 and Source Data for Extended Data Fig. 6. c, ZSCAN4C downregulation does not induce ES cell differentiation. Representative immunofluorescence staining for the pluripotency marker OCT4 in control and OHT-treated ES cells following ZSCAN4C downregulation. The percentage of OCT4-positive cells is shown. Scale bar, 10 μm. d, Representative immunofluorescence staining for ZSCAN4 in FLICs with stable integration of a doxycycline-inducible ZSCAN4C expression construct (iZSCAN4). Cells were either left untreated (top) or treated with doxycycline to induce Zscan4c expression (bottom) for two days before collection. e, The FLICs described in d either induced with doxycycline (+) or not (−) were treated with OHT and collected 4 days later for western blot analysis. As a control (cont.), FLICs lacking the inducible cassette were used. f, Growth of Trf2f/f FLICs before (cont.) or after Cre induction (OHT), untreated (circle) or treated (inverted triangle) with doxycycline to induce Zscan4c. Mean and s.d. are derived from the analysis of 49 images per condition. g, Representative IF–FISH staining for 53BP1 (red) and telomeric DNA (green) in TRF2-proficient (cont.) or TRF2-deficient FLICs. Where indicated, cells were treated with doxycycline (Dox) 7 days before collection to induce expression of exogenous Zscan4c. Scale bar, 4 μm. h, Quantification of data shown in g, cells with more than 10 53BP1 foci at telomeres were scored as positive for TIF.
Extended Data Fig. 7 |
Extended Data Fig. 7 |. TRF2-depleted cells show increased telomere length.
a, Representative FACS plots (y axes, cell count; x axes, PI staining) showing the cell-cycle profiles of TRF2-proficient (cont.) and TRF2-deficient (OHT) FLICs. Where indicated, cells were treated with doxycycline (Dox) for 7 days before collection to induce expression of exogenous Zscan4c. G1 phase of the cell cycle is marked in blue; S phase in yellow; G2 phase in green. The unmarked peak indicates presence of polyploid cells. b, Q-FISH histograms of telomere length distributions of chromosomes derived from TRF2-proficient (Trf2f/) and TRF2-deficient (Trf2−/−) ES cells clones, derived as described in Extended Data Fig. 1e. Telomere length was calculated on the basis of the florescence intensity of a telomeric FISH probe (PNA-TelC). c, Flow-FISH quantification of telomere length was performed on TRF2-proficient (Trf2f/) and TRF2-deficient (Trf2−/−) ES cells clones. Top panels show the distribution of telomeric signal intensity (PNA-TelC) (y axis) and the DNA content (DAPI) (x axis). The bottom panels show the distribution of cells (y axis) on the basis of telomeric signal intensity (x axis). Cells were gated on the basis of DNA content into G1 (light blue) and S/G2 (orange). Note the shift in telomere length between the TRF2-proficient and TRF2-deficient cells.
Extended Data Fig. 8 |
Extended Data Fig. 8 |. Model of the unique telomere protection mechanism in ES cells.
a, Overview of the DDR in response to TRF2 depletion in somatic cells. In response to uncapped telomeres, ATM kinase initiates DDR, leading to end-to-end fusions via the NHEJ pathway. b, POT1A, POT1B and BRD2ensure genomic stability in pluripotent mouse ES cells by inhibiting the activities of ATM and ATR kinases. As a result, mild DDR is not enough to cause end-to-end fusions. c, Increased expression of Zscan4—a cluster of two-cell-signature genes—might result in recombination-based telomere elongation. Alternatively, the ZSCAN4 -dependent inhibition of the ATM and ATR kinases at TRF2-depleted telomeres of ES cells ensures telomere stability.
Fig. 1 |
Fig. 1 |. Trf2−/− ES cells are viable and do not exhibit end-to-end chromosome fusions.
a, Growth of Trf2f/f ES cells (left) and FLICs (right) before (control) or after Cre induction (OHT). Mean and s.d. are derived from the analysis of 25 images per condition. b, Metaphases derived from TRF2-proficient (control) or TRF2-deficient (OHT) ES cells (left panels) and FLICs (right panels). Scale bars, 10 μm. c, Scatter plot representing the distribution of telomeric fusions. Each dot represents the percentage of telomeres fused in one metaphase spread; for detailed information, see Supplementary Table 1, Source Data for Fig. 1 (n = 3 independent experiments). d, Representative immunofluorescence and fluorescence in situ hybridization (IF–FISH) for γH2AX (red) and telomeres (green) in Trf2f/f ES cells and FLICs treated as indicated. Scale bar, 4 μm. e, f, Quantification of the percentage of cells with more than 10 γH2AX (e) or 53BP1 (f) foci colocalizing with telomeres, detected as in d. Representative images of IF–FISH for 53BP1 are reported in Extended Data Fig. 2e. TIF, telomere- dysfunction-induced foci. g, Representative immunofluorescence images for 53BP1 (red) and γH2AX (green) in ES cells and FLICs before (not treated (NT)) or after irradiation (IR) (2.5 Gy). Scale bar, 4 μm. h, i, Percentages of cells with more than 10 γH2AX (h) or 53BP1 (i) foci are shown. In all panels, mean is indicated with centre bars and s.d. with error bars. NS, non-significant (P ≥ 0.05), *P < 0.05, ****P < 0.0001, one-way analysis of variance (ANOVA).
Fig. 2 |
Fig. 2 |. A synthetic lethality CRISPR screen in TRF2-deficient ES cells.
a, Experimental outline of the CRISPR–Cas9 screen we performed. Trf2f/f-creER ES cells were infected with a genome-wide gRNA library; a portion of the cells was collected after selection (day 0); and the remaining cells were either treated with OHT to induce TRF2 deletion (OHT) or left untreated (control), and collected two weeks later (day 14). Cells infected with gRNAs targeting essential genes are depicted in magenta; cells infected with gRNA against genes that are synthetically lethal with TRF2 are shown in blue; and the remaining cells are shown in black. b, Scatter plot showing the average essentiality scores (β-score) in OHT-treated (y axis) and control (x axis) ES cells for all the genes targeted (about 23,000). Genes with a β-score below −0.75 are considered essential. Genes that have previously been reported as essential in ES cells are labelled in magenta, and genes that we found to be synthetically lethal with TRF2 are labelled in blue. Oct4 is also known as Pou5fl. c, Growth of ES cells with the indicated genotypes was monitored by confluence in an Incucyte S3. Cells were monitored starting from time of OHT-mediated TRF2 deletion (day 0). Plots show the time between day 4 and day 11. Mean and s.d. are derived from the analysis of 49 images per condition. d, Clonogenic survival assay by crystal violet was performed on cells of the indicated genotypes and treatment.
Fig. 3 |
Fig. 3 |. POT1B and BRD2 are required for telomere protection in the absence of TRF2.
a, Representative images of metaphases from TRF2-depleted and control ES cells of indicated genotypes; percentages of telomeres fused for each genotype are shown in the top right corner. Scale bars, 10 μm. b, Scatter plot representing the distribution of telomeric fusions. Each dot represents the percentage of telomeres fused in one metaphase spread; for detailed information, see Supplementary Table 1, Source Data for Fig. 3. c, Representative fluorescence-activated cell sorting (FACS) plots (y axes, number of cells detected; x axes, intensity of propidium iodide (PI) staining), showing the cell-cycle profiles of ES cells of indicated genotypes. The G1 phase of the cell cycle is marked in blue. d, Representative IF–FISH for 53BP1 (red) and telomeres (green) in ES cells of the indicated genotype and treatment. Scale bar, 4 μm. e, Quantification of the percentage of cells with more than 10 53BP1 foci colocalizing with telomeres, detected as in d. f, Quantification of the percentage of cells with more than 10 γH2AX foci colocalizing with telomeres, detected as in d. g, Representative western blotting analysis of ES cells untreated (−) or treated with OHT (+) and collected 4 days after treatment. Where indicated, cells were treated with an ATM inhibitor (ATMi). All data panels in the figure are representative of three experiments. NS, non-significant (P ≥ 0.05), *P < 0.05, **P < 0.01, ***P < 0.001, ****P < 0.0001, one-way ANOVA.
Fig. 4 |
Fig. 4 |. Two-cell-signature genes are involved in telomere protection of ES cells.
a, Heat map displaying the expression levels of 2-cell-signature genes between control and OHT-treated ES cells (two independent cell lines) and FLICs (one cell line). Expression levels are normalized to the values of the control ES cell line. b, Representative immunofluorescence staining for ZSCAN4C in control and OHT-treated ES cells. Percentages of ZSCAN4-positive cells are shown in bottom left corner. c, Western blotting analysis of control and OHT-treated ES cells expressing either a control shRNA or two independent shRNAs against Zscan4c (sh3 and sh4). d, Metaphase spreads derived from ES cells of the indicated genotypes and treatment. Additional information is provided in Supplementary Table 1, Source Data for Fig. 4. e, Representative metaphases derived from doxycycline-inducible-ZSCAN4 (iZSCAN4) FLICs, treated with doxycycline (+Dox) or not, were collected 4 days after treatment with OHT. f, Scatter plot representing the distribution of telomeric fusions. Each dot represents the percentage of telomeres fused in one metaphase spread; for detailed information, see Supplementary Table 1 and Source Data for Fig. 4. All data panels in the figure are representative of at least three experiments. NS, non-significant (P ≥ 0.05), P < 0.05, ****P < 0.0001, one-way ANOVA.

References

    1. Celli GB & de Lange T DNA processing is not required for ATM-mediated telomere damage response after TRF2 deletion. Nat. Cell Biol. 7, 712–718 (2005). - PubMed
    1. de Lange T Shelterin: the protein complex that shapes and safeguards human telomeres. Genes Dev. 19, 2100–2110 (2005). - PubMed
    1. Artandi SE et al. Telomere dysfunction promotes non-reciprocal translocations and epithelial cancers in mice. Nature 406, 641–645 (2000). - PubMed
    1. Griffith JD et al. Mammalian telomeres end in a large duplex loop. Cell 97, 503–514 (1999). - PubMed
    1. Doksani Y, Wu JY, de Lange T & Zhuang X Super-resolution fluorescence imaging of telomeres reveals TRF2-dependent T-loop formation. Cell 155, 345–356 (2013). - PMC - PubMed

MeSH terms