. 2021 Jan;589(7840):131-136.
doi: 10.1038/s41586-020-2977-2. Epub 2020 Nov 25.

Commensal-driven immune zonation of the liver promotes host defence

Affiliations

Commensal-driven immune zonation of the liver promotes host defence

Anita Gola et al. Nature. 2021 Jan.

Erratum in

Abstract

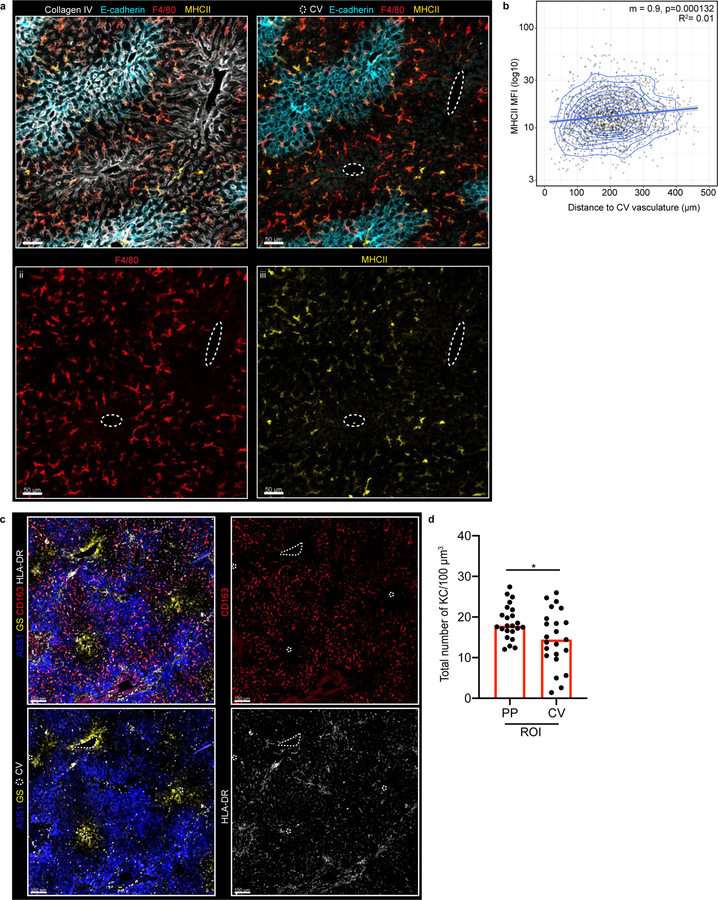
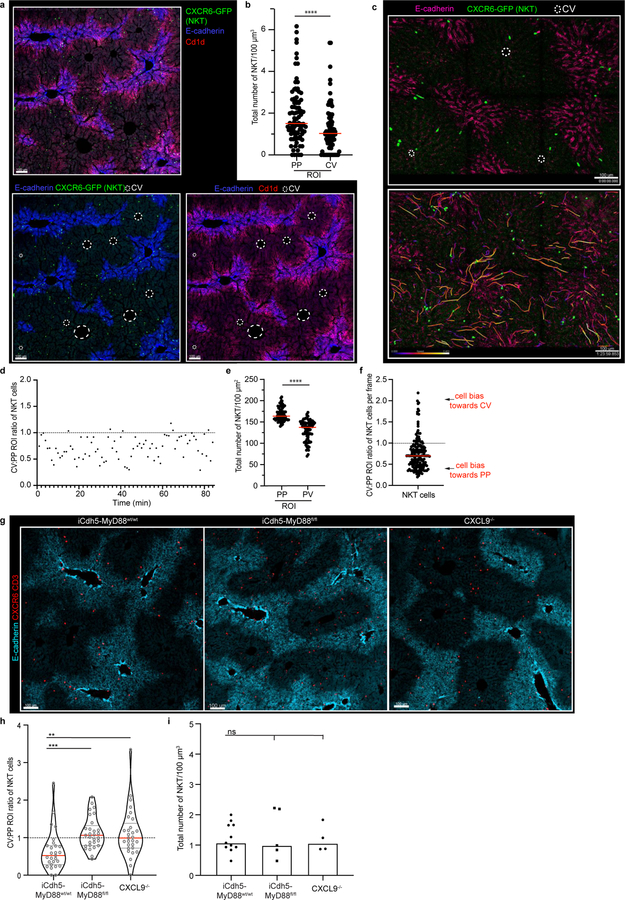
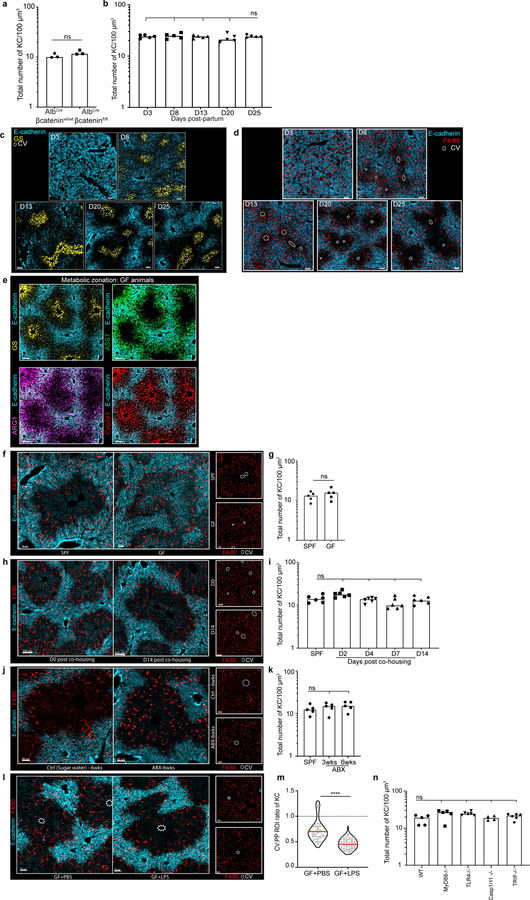
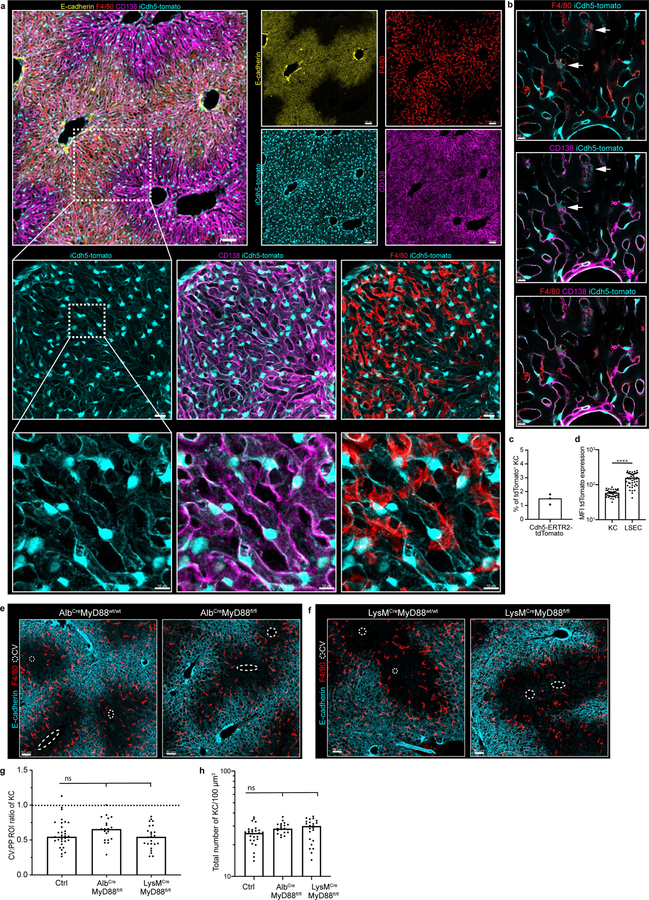
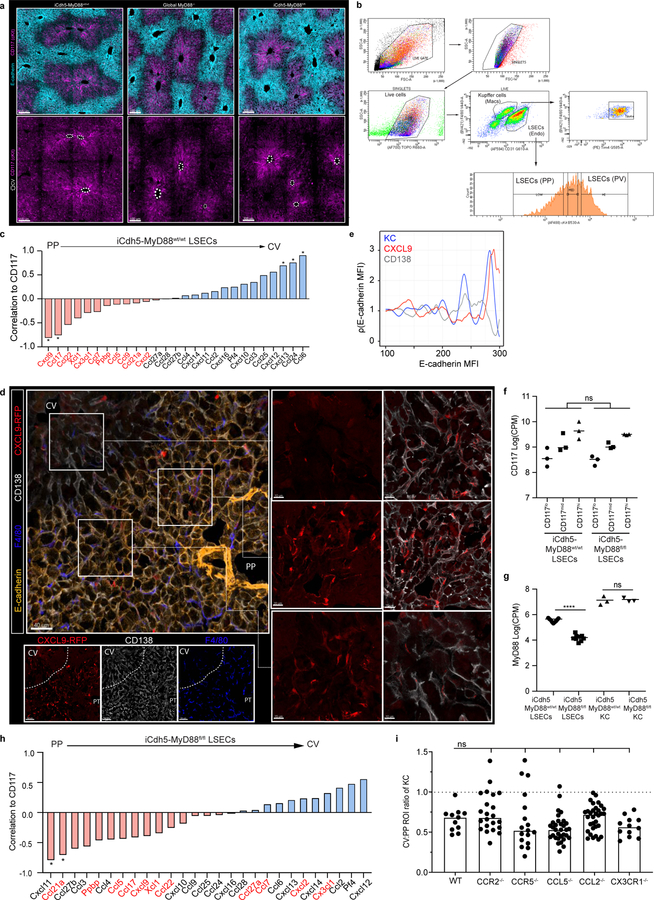
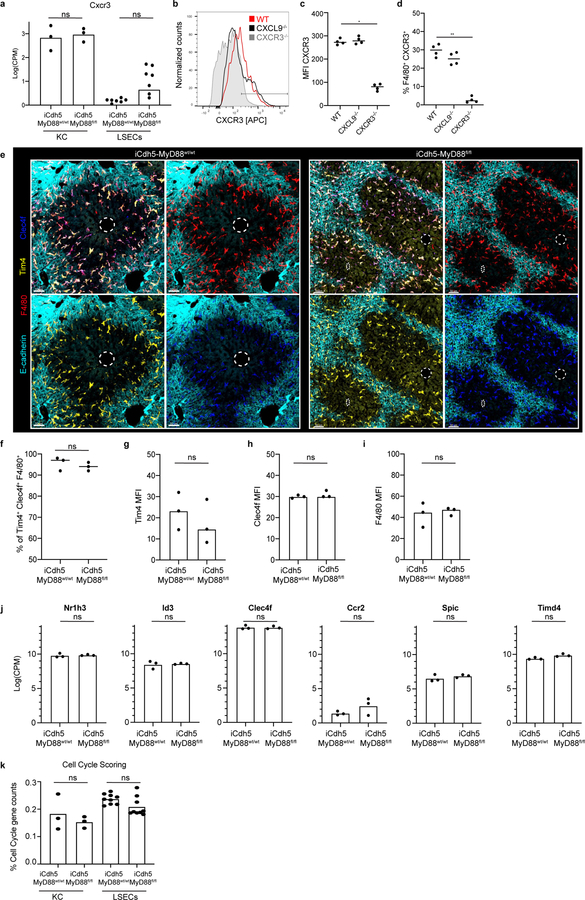
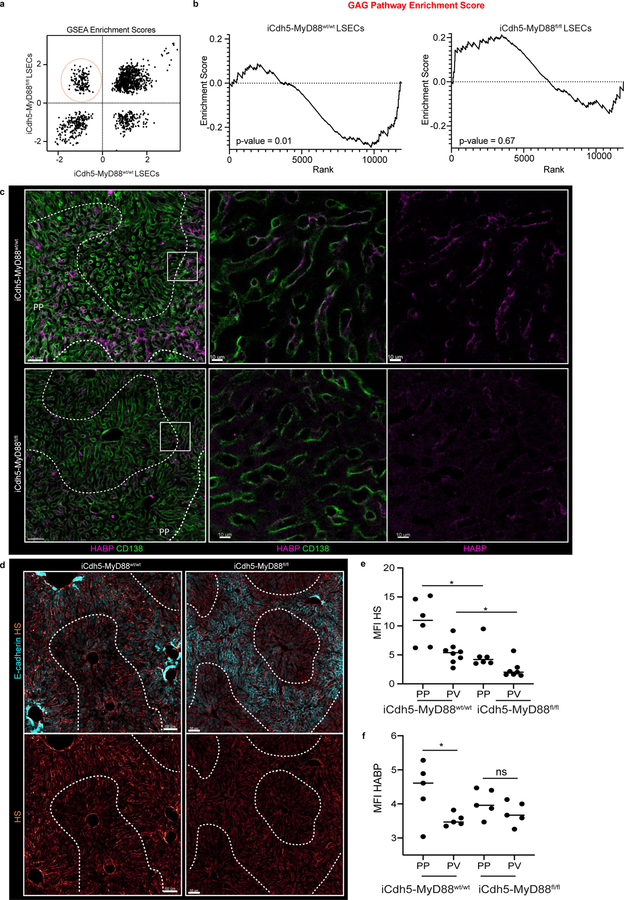
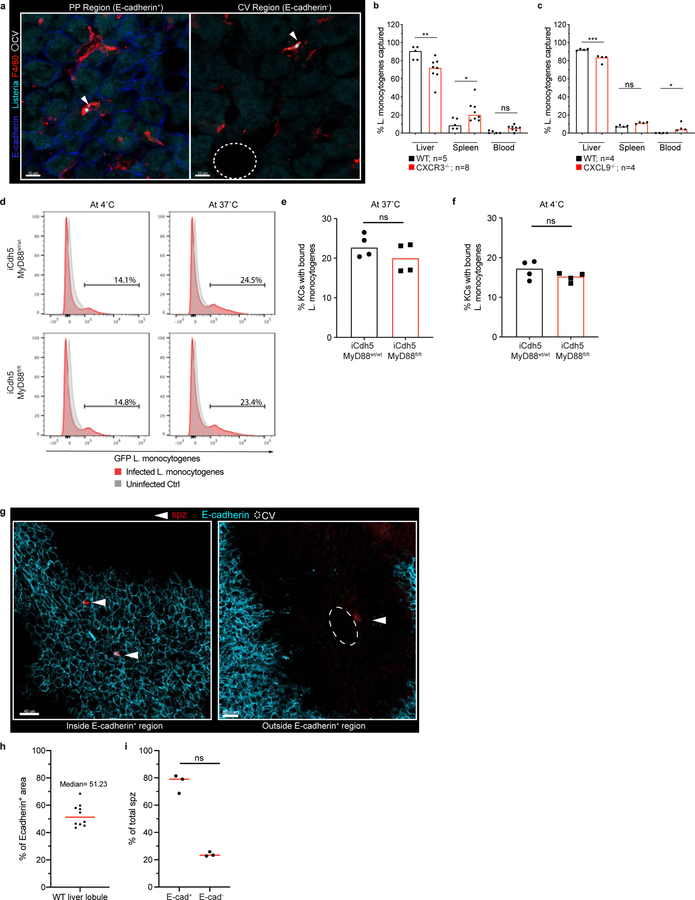
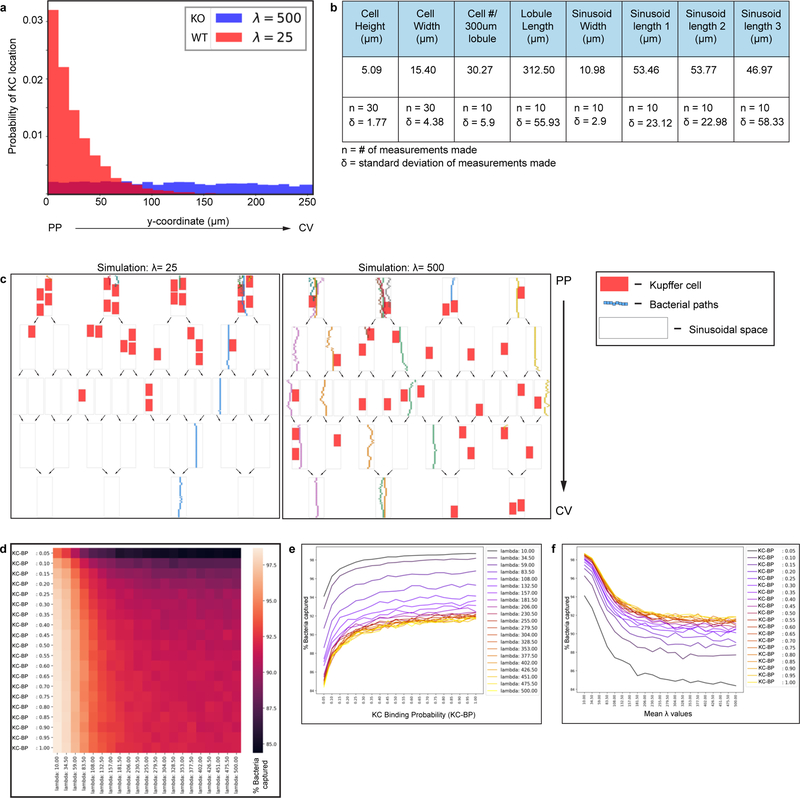
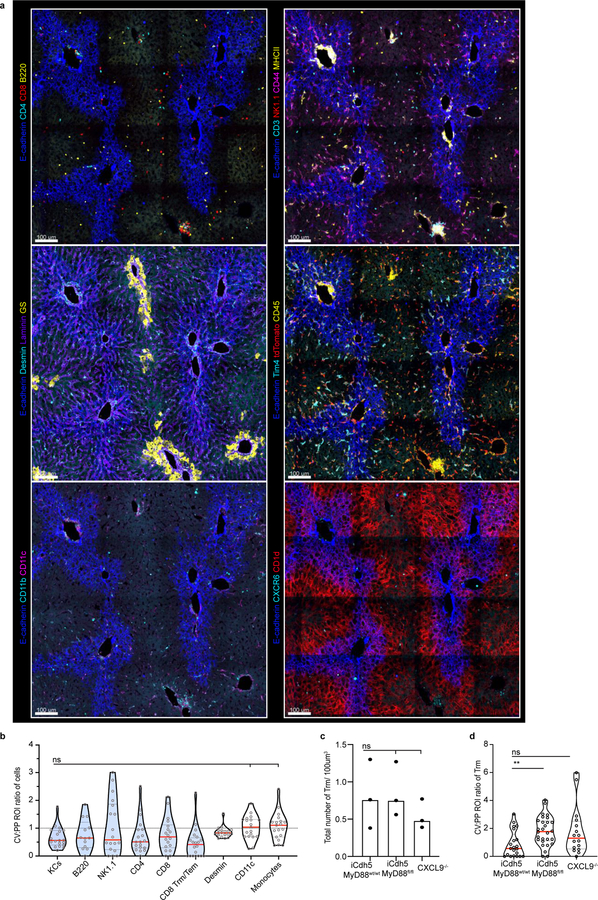
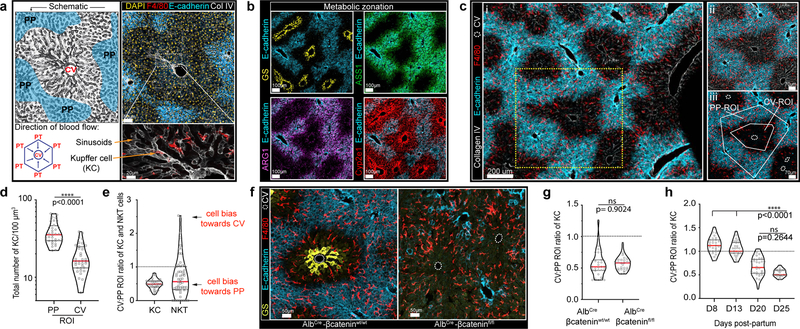
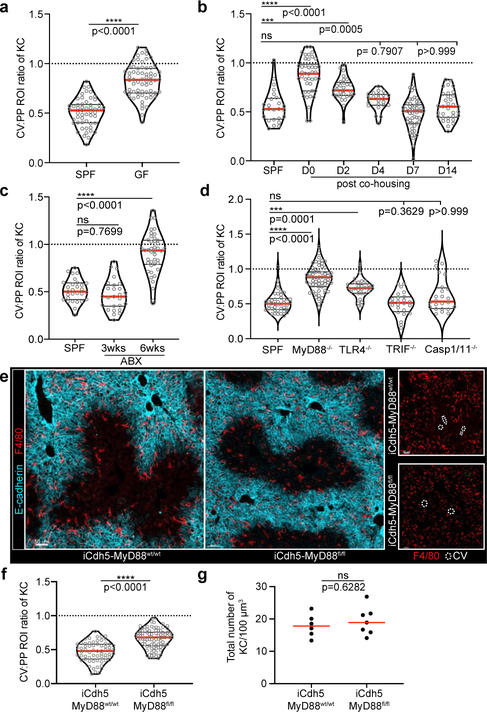
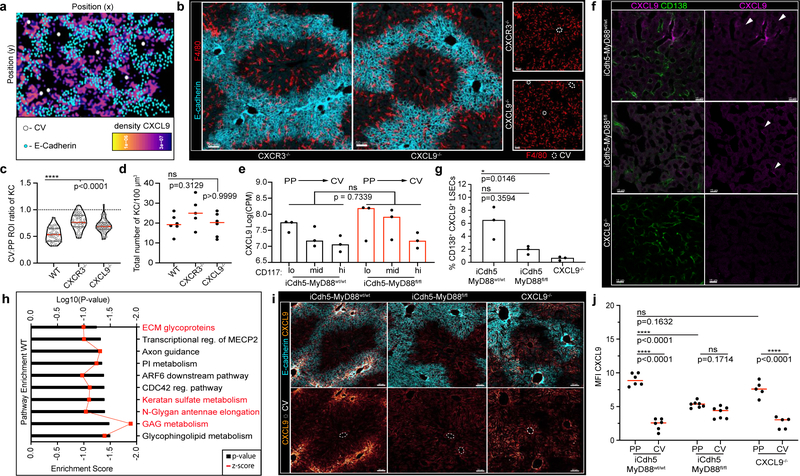
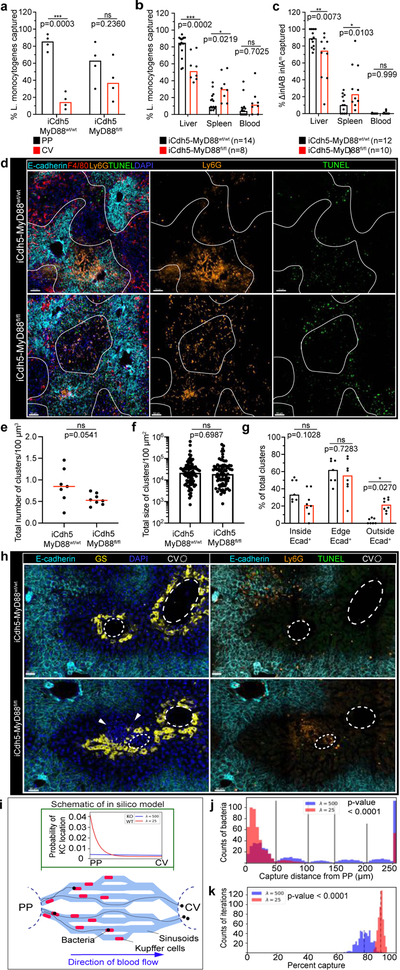
The liver connects the intestinal portal vasculature with the general circulation, using a diverse array of immune cells to protect from pathogens that translocate from the gut1. In liver lobules, blood flows from portal triads that are situated in periportal lobular regions to the central vein via a polarized sinusoidal network. Despite this asymmetry, resident immune cells in the liver are considered to be broadly dispersed across the lobule. This differs from lymphoid organs, in which immune cells adopt spatially biased positions to promote effective host defence2,3. Here we used quantitative multiplex imaging, genetic perturbations, transcriptomics, infection-based assays and mathematical modelling to reassess the relationship between the localization of immune cells in the liver and host protection. We found that myeloid and lymphoid resident immune cells concentrate around periportal regions. This asymmetric localization was not developmentally controlled, but resulted from sustained MYD88-dependent signalling induced by commensal bacteria in liver sinusoidal endothelial cells, which in turn regulated the composition of the pericellular matrix involved in the formation of chemokine gradients. In vivo experiments and modelling showed that this immune spatial polarization was more efficient than a uniform distribution in protecting against systemic bacterial dissemination. Together, these data reveal that liver sinusoidal endothelial cells sense the microbiome, actively orchestrating the localization of immune cells, to optimize host defence.


Conflict of interest statement

The authors declare no competing interests.

Figures

Extended Figure 1.
Extended Figure 1.. Kupffer cell MHCII expression and localization in mouse and human livers.
(a) Representative IF image of F4/80+, MHCII, Collagen IV, and E-cadherin expression in mouse liver lobule. (i-iii) Channel shown labelled in figures, CV highlighted by dashed circles in IFs. (b) Scatter plot of KC MHCII Mean Fluorescence Intensity (MFI) and distance to the centre of CV vasculature (μm) (n=3 mice, 2 lobules/mouse, each dot represents a KC). Linear regression model shown, intercept (m), p-value (Two-Tailed t-test) and R2 indicated in figure. (c) Representative IF human liver image of Kupffer cells (stained by CD163 and HLA-DR) and liver enzymes ASS1 and GS to identify the liver lobule (CV highlighted by dashed circles in IF images). (d) Total number of KCs cells in PP and CV regions normalized to volume, each dot represents an ROI; Median shown. Two-tailed Mann-Whitney; *p =0.0448. (n = 7 donors). Channels and CV as labelled in image.
Extended Figure 2.
Extended Figure 2.. NKT cells show peri-portal enrichment, and are disrupted in iCdh5-MyD88−/− and CXCL9−/− animals.
(a) Representative IF image with CXCR6-GFP (NKT), E-cadherin, and CD1d, CV highlighted by dashed circles in IF images. (b) Total number of NKT cells in PP and CV regions normalized to volume, each dot represents an ROI. n = 4 mice, Two-tailed Mann-Whitney, **** p<0.0001; Median shown. (c) Representative image from 2P-intravital movie of CXCR6-GFP animal showing E-Cadherin antibody injected intravenously i.v. and NKT cell positioning at time zero; Bottom: compiled NKT cell tracks. (d) Representative ratio of total NKT cell numbers in CV to PP ROIs per frame over time. (e) Total number of NKT cells in PP and CV regions normalized to volume for 2-P intravital movies, each dot represents an ROI. n = 3 mice, Two-tailed Mann-Whitney, **** p<0.0001; Median shown. (f) Ratio of total NKT cell numbers in CV to PP ROIs for 2-P intravital movies, each dot represents a frame. n = 3 mice. (g) Representative IF image CXCR6+ CD3+ cells (NKT cells), and E-cadherin in iCdh5-MyD88wt/wt, iCdh5-MyD88fl/fl and CXCL9−/− animals. (h) Ratio of total NKT cells in PP and CV regions normalized to volume, and (i) total number of cells per volume; each dot represents a lobule. n = 4 mice/condition, Kruskal-Wallis test, Dunn’s multiple comparison test, ***p= 0.0002, **p= 0.0013, ns (not significant) p>0.9999; Median and quartile range shown. Channels and CV as labelled in image.
Extended Figure 3.
Extended Figure 3.. IF images and total numbers of KCs in animals with distinct commensal microbiomes.
(a) Total number of KCs normalized to volume in AlbCre-βcateninwt/wt and AlbCre-βcateninfl/fl animals, eat dot represent a biological replicate, n = 3 mice/condition, Two-tailed Mann-Whitney test, ns p-value= 0.400; Median shown. (b) Representative IF images of mouse livers at days (D) 3, 8, 13, 20, and 25 post-partum. At D3, GS synthetase expression is absent and E-cadherin is homogenously expressed throughout the liver lobule; by D8 both molecules show zonation. (c) Same representative IF images of mouse livers at days (D) 3, 8, 13, 20, and 25 post-partum showing E-cadherin and F4/80+ KCs (for quantification, see Fig 1h). (d) Total number of KCs normalized to volume at days (D) 3, 8, 13, 20, and 25 post-partum, eat dot represent a biological replicate, n = 5 mice/time point. Kruskal-Wallis test with Dunn’s multiple comparison: For D25 vs D3/D8/D13: ns p-value> 0.9999, for D25 vs D20: ns p-value=0.8492; Median shown. Channels and CV as labelled in image. (e) Representative IF image showing normal germ-free animal liver lobule metabolic zonation depicting glutamine synthetase (GS), arginase 1 (ARG1), argininosuccinate synthase 1 (ASS1) and Cytochrome P450 2E (Cyp2e1) expression, for comparison: see SPF zonation gradients in Fig. 1b. (f-k) Representative IF images showing F4/80+ KC distribution within mouse liver (insets showing F4/80+ staining only) and total number of KCs normalized to volume in (f-g) GF and SPF animals (each dot present a biological replicate), n = 5 mice/condition; Two-Tailed Mann-Whitney test, ns p-value= 0.5159, Median shown; (h-i) GF animals after cohousing with SPF animals (each dot present a biological replicate), n = 6 mice/condition, Kruskal-Wallis test with Dunn’s multiple comparison. For SPF vs D4/D14: ns p-value>0.9999, for SPF vs D2 ns p-value=0.2650, for SPF vs D7 ns p-value=0.5255; Median shown. (j-k) SPF animals after antibiotic (ABX) treatment, (each dot presents a biological replicate), n = 6 mice/condition, Kruskal-Wallis test with Dunn’s multiple comparison. For SPF vs 3-wks: ns p-value=0.8725, for SPF vs 6-wks: ns p-value=0.2936; Median shown. (l) Representative IF image showing F4/80+ KC distribution of GF animals orally gavaged with LPS (two weeks post treatment), and PBS control animals (insets showing F4/80 staining only, CV highlighted by dashed circles in IFs). (m) Ratio of total KC numbers in CV to PP ROIs, each dot represents a lobule. n = 6 mice/condition, Two-tailed Mann-Whitney test, **** p<0.0001; Median and quartiles shown. (n) Total number of KCs normalized to volume in global knock-outs for MyD88, TRL4, TRIF and Caspase1/11 (each dot presents a biological replicate), n = 4 Caspase 1/11−/− mice, n= 5 MyD88−/− and WT mice, n= 6 TLR4−/− and TRIF−/− animals, Kruskal-Wallis test with Dunn’s multiple comparison test. For WT vs TRIF−/−/Caspase 1/11−/−: ns p-value>0.9999, for WT vs MyD88−/−: ns p-value=0.0776, WT vs TLR4−/−: ns p-value=0.0524; Median shown. Channels shown labelled in figures, CV highlighted by dashed circles in IFs.
Extended Figure 4.
Extended Figure 4.. iCdh5-Cre. Alb-Cre and LysM-Cre livers reporters: loss of MyD88 signalling in hepatocytes and KCs does not alter KC localization.
(a) Representative IF image showing iCdh5-Cre expression when crossed to a Rosa26-tdTomato reporter. (b) Zoomed in image: iCdh5-Cre-tdTomato is predominantly found on CD138+ LSECs, but can also be seen on a small number of KCs. (c) Percentage of total tdTomato+ KCs in iCdh5-Cre-tdTomato animals, each dot represents a biological replicate, n=3 mice. (d) MFI of tdTomato on tdTomato+ F4/80+ KCs and tdTomato+ LSECs from iCdh5-Cre-tdTomato (each dot represents a cell), n = 3 mice/condition, Two-tailed Mann-Whitney test, **** p<0.0001; Median shown. (e-f) Representative IF image showing F4/80+ KC distribution of (e) Alb-MyD88−/− and (f) LysM-MyD88−/− animals with littermate controls, CV highlighted by dashed circles in IFs. (g) Ratio of total KC numbers in CV to PP ROIs, (each dot represents a lobule), n = 4 mice/condition, Kruskal-Wallis test with Dunn’s multiple comparison test. For WT vs LysMCre-MyD88flfl-: ns p-value>0.9999, for WT vs AlbCre-MyD88fl/fl: ns p-value=0.2082; Median shown. (h) total KC numbers per volume; each dot represents a lobule. n = 4 mice/condition, Kruskal-Wallis test with Dunn’s multiple comparison test. For WT vs LysMCre-MyD88flfl-: ns p-value=0.0781, for WT vs AlbCre-MyD88fl/fl: ns p-value=0.0624; Median shown. Channels shown labelled in figures, CV highlighted by dashed circles in IFs.
Extended Figure 5.
Extended Figure 5.. Sort strategy for LSECs populations and CXCL9 translation and protein expression in iCdh5-MyD88wt/wt, iCdh5-MyD88fl/fl, and CXCL9−/− animals.
(a) Representative IF image of CD117 expression around the CV on iCdh5-MyD88wt/wt, Global MyD88−/− and iCdh5-MyD88fl/fl animals, n=2 mice. CV highlighted by dashed circles in IFs. (b) Representative flow-cytometry gating strategy for bulk RNAseq sort: cells were sorted on forward-side scatter, singlets and live. KCs were identified by expression of F4/80+ and Tim4+. LSECs were identified by CD31+ and sorted into low, medium and high CD117 populations. (c) Chemokine expression across the liver lobule as a correlate to CD117 in iCdh5-MyD88wt/wt animals. Statistical significance determined by edge-R glmLTR test, mean shown from 3 biological replicates; *p-values for: Cxcl9= 0.009785, Ccl17= 0.0147, Cxcl13= 0.03433, Ccl24= 0.01569, Ccl6= 0.0004875. (d) Representative IF image showing CXCL9-RFP expression on CD138+ LSECs in REX3 animals (Density plot of CXCL9 shown in Fig. 3a). (e) Non-parametric estimate of the spatial intensity of KC, CXCL9, and CD138, (ρ(E-cadherin)) as a value of spatial covariate E-cadherin MFI, see Methods for details. n = 3 mice/condition. (f-g) Log counts per million of (f) CD117 (ns p-value= 0.9695) and (g) MyD88 (ns p-value= 1, **** p= 3.549e-23) in LSECs and KCs. Statistical significance determined by edge-R glmLTR test, each dot represents a biological sample from sorted populations (n=3 mice/condition). (h) Chemokine expression across the liver lobule as a correlate to CD117 in iCdh5-MyD88fl/fl animals. In red are chemokines that are PP associated in WT animals. Statistical significance determined by edge-R glmLTR test; *p-values for: Cxcl11= 0.01102, Ccl21a= 0.03187. (i) Ratio of total KC numbers in CV to PP ROIs in global CCR2, CCR5, CCL5, CCL2, CX3CR1 knock-out animals (each dot represents a lobule), n = 4 mice/condition for knock-out animals, and n=3 mice for WT controls. Kruskal-Wallis test with Dunn’s multiple comparison test, for all comparisons: ns p-value>0.9999, with the exception of WT vs CCL5−/−: ns p-value=0.3098; Median shown. Channels shown labelled in figures, CV highlighted by dashed circles in IFs.
Extended Figure 6.
Extended Figure 6.. Expression of KC putative markers in iCdh5-MyD88wt/wt and iCdh5-MyD88fl/fl animals.
(a) Log counts per million of Cxcr3 in KCs and LSECs from MyD88wt/wt and iCdh5-MyD88fl/fl mice; biological replicates of sorted populations shown, statistical significance determined by edge-R glmLTR test; for all: ns p-value-values LSECs= 0.3191, and ns p-value-values KCs= 1. (b-d) CXCR3 expression on KCs of WT, CXCR3−/− and CXCL9−/− mice as determined by flow-cytometry: (b) Histogram of CXCR3, (c) Quantification of CXCR3 MFI and (d) % of F4/80+ CXCR3+ of total F4/80+ cells (each dot represents a biological replicate). n=4 mice/group; Kruskal-Wallis test with Dunn’s multiple comparison, *p =0.0310, **p= 0.0089; Median shown. (e) Representative IF image of Tim4, Clec4f and F4/80 expression in KCs of iCdh5-MyD88wt/wt and iCdh5-MyD88fl/fl animals. CV highlighted by dashed circles in IFs. Quantification of (f) Percent of Tim4+ Clec4f+ F4/80+ cells (ns p-value = 0.5) and MFI of (g) Tim4 (ns p-value = 0.7), (h) Clec4f (ns p-value = 0.4), and (i) F4/80 (ns p-value >0.9999); n= 3 mice/condition, Two-tailed Mann-Whitney test. (j) Log counts per million of Nr1h3, Id3, Clec4f, Ccr2, Spic, and Timd4 in KCs from MyD88wt/wt and iCdh5-MyD88fl/fl mice; biological replicates of sorted populations shown, statistical significance determined by edge-R glmLTR test; for all: ns p-value-values= 1. (k) Percent of counts associated with cell cycle from RNASeq in KCs and LSECs from MyD88wt/wt and iCdh5-MyD88fl/fl mice, biological replicates shown, Two-Way Anova with Sidak MC test, ns p-value-value for KCs= 0.4710, for LSECs= 0.1591.
Extended Figure 7.
Extended Figure 7.. RNAseq GAG pathway and histological ECM composition.
(a) GSEA Enrichment scores in relation to CD117 expression in LSECs from iCdh5-MyD88wt/wt (x-axis) and iCdh5-MyD88fl/fl (y-axis). Highlighted, pathways enriched towards the PP regions of iCdh5-MyD88wt/wt disrupted in iCdh5-MyD88fl/fl animals (Top 10 pathways shown in Fig. 3k). (b) GAG pathway enrichment score in iCdh5-MyD88wt/wt and iCdh5-MyD88fl/fl. iCdh5-MyD88wt/wt show strong PP GAG enrichment, lost and/or disrupted in iCdh5-MyD88fl/fl animals. (c) Representative IF image of Hyaluronic acid binding protein (HABP) detecting Hyaluronic acid (HA) in iCdh5-MyD88wt/wt and iCdh5-MyD88fl/fl. (d) Representative IF image of HS in iCdh5-MyD88wt/wt and iCdh5-MyD88fl/fl. (e-f) MFI of HS and HABP (respectively) in PP and CV ROIs of iCdh5-MyD88wt/wt and iCdh5-MyD88fl/fl animals, each dot represents an ROI; n=4 iCdh5-MyD88wt/wt mice and n= 5 iCdh5-MyD88fl/fl animals, Two-Way ANOVA with Sidak multiple comparison test; Median shown. (e) **p =0.0011, ns p-value-value= 0.0654. (f) *p =0.0348, ns p-value-value= 0.5972. Channels shown labelled in figures.
Extended Figure 8.
Extended Figure 8.. In vivo and in vitro capture of L. monocytogenes and malaria sporozoite spatial location upon following liver infection.
(a) Representative IF image showing L. monocytogenes-GFP captured by KCs in iCdh5-MyD88wt/wt either in PP Region (E-cadherin+) or CV Region (E-cadherin-) two hours post i.v. administration. Quantification and experimental details shown in Fig. 4a. (b-c) Percent of L. monocytogenes captured in liver, spleen and blood after portal vein injection in (b) CXCR3−/− (** p=0.0023, * p=0.0263, ns p-value= 0.7585) and (c) CXCL9−/− animals (*** p=0.0001, * p= 0.0102, ns p-value= 0.209); each dot represents a biological replicate, n= 4–8 animals/group, Two-way ANOVA with Sidak multiple; Median shown. (d-f) In vitro bacteria capture assay of L. monocytogenes-GFP using KCs extracted from iCdh5-MyD88wt/wt and iCdh5-MyD88fl/fl animals. (d) Representative flow cytometry histograms of infected and uninfected KCs at 4°C and 37°C showing L. monocytogenes-GFP intensity. (e-f) Quantification of flow-cytometry data showing percent of KCs with bound L. monocytogenes at 4°C and 37°C; each dot represents a biological replicate, n=4 mice/condition; Two-tailed Mann-Whitney test, ns p-value= 0.3429; Median shown. (g) Representative examples of sporozoites (spz) locations one-day post liver infection in naïve animals; spz stained with anti-CSP antibody. (h-i) Quantification of location of spz infection: (h) % of total liver in WT mice that is E-cadherin+, each dot represents a biological replicate, median shown. (i) % of total spz either in E-cadherin+ regions or outside E-cadherin+ regions; n=250 spz imaged, data pooled from 3 different mice- eat dot represents a mouse (see Methods section regarding quantification); Two-tailed Mann-Whitney (ns p-value= 0.1000).
Extended Figure 9.
Extended Figure 9.. In silico model of bacterial capture in sinusoidal network.
(a) Example of the exponential distribution used to sample the KC locations along the sinusoid. The two histograms refer to two different values of the mean of the exponential distribution: λ=25 (red- simulating a WT distribution) and λ=500 (blue- simulating a KO distribution). (b) Parameters used to constrain model simulations, obtained from analyzing confocal images, mean number displayed (n= number of measurements made for each parameter, δ= standard deviation of measurements made). (c) Illustrations of two example simulations in which the KC locations are sampled from an exponential distribution with mean λ=25 (left) and λ=500 (right). The top part of the graph corresponds to the PP region, the bottom part to the CV. White rectangles represent sinusoidal segments. Arrows schematically indicate the splitting and merging of vessels. Red rectangles symbolize KCs, while small colored rectangles are representative of bacteria. The path of each bacterium is described by the string of rectangles of the same color. All bacteria start their motion at the top of the graph (PP region) and only bacteria that are not successfully stopped by KCs reach the bottom (CV). In both simulations we show the path of 10 bacteria. (d-f) Simulating varying KC distributions (λ) and KC bacterial binding probability in parameter space: the network’s capturing capacity is proportional to increases of KC binding probability while inversely proportional to increases of λ values. Average percent of stopped bacteria as a function of KC binding probability (KC-BP - a probabilistic value of KC capture from 0–1), and of the mean of the exponential distribution λ. (d) Results reported in a heat map in which the color corresponds to the average percentage of stopped bacteria, as detailed by the color bar, rows correspond to KC-BP values and columns to different λ-values. (e-f) Results reported as line graphs with average percentages of stopped bacteria reported and increasing values of (e) KC binding probability (KC-BP) or (f) λ-values. Colour of each line corresponds to either changes of KC binding probability or λ-value respectively.
Extended Figure 10.
Extended Figure 10.. Multi-parameter, iterative staining (IBEX) of Prime and Target vaccinated animals.
(a) Representative IF image of Prime and Target vaccinated animal showing expression of a diverse set of immune and non-parenchymal associated markers in relationship to E-cadherin acquired via IBEX staining (Channels shown labelled in figures). (b) Ratio of total cell numbers in CV to PP ROIs, each dot represents a lobule (each dot represents a lobule); n = 3 mice/condition, Kruskal-Wallis test, Dunn’s multiple comparison test; Median shown. KC vs Desmin: ns p-value=0.3071, KC vs CD11c: ns p-value= 0.0549, KC vs Monocytes: ns p-value=0.0510. (c) Total number of Trm (CD8+ CD44+ CXCR6+ CD69+ T-cells) per volume in iCdh5-MyD88wt/wt, iCdh5-MyD88fl/fl and CXCL9−/− animals (each dot represents a biological replicate). n = 3 mice/condition; Kruskal-Wallis test, Dunn’s multiple comparison test; Median shown, ns p-value>0.9999. (d) Ratio of Trm numbers in CV to PP ROIs, each dot represents a lobule. n = 3 mice/condition; Median shown, Kruskal-Wallis test, Dunn’s multiple comparison test, **p= 0.0035, ns p-value=0.1275.
Figure 1.
Figure 1.. KCs become enriched around liver peri-portal areas during weaning.
(a) Representative schematic (left) and immunofluorescent (IF) image (right) of mouse liver lobule showing E-cadherin enrichment in PP regions (blue), F4/80+ KCs, Collagen (Col) IV lining LSECs and location of PTs and CV. Bottom left, direction of portal blood flow towards the CV. (b) Liver lobule metabolic zonation depicting enzymes GS, ARG1, ASS1 and Cyp2e1. (c, i) Representative IF image showing KC distribution within liver, (ii) inset, (iii) quantification method: regions of interest (ROIs) for PP and CV lobular areas, total number of segmented KCs is quantified. (d) Total number of KCs in PP and CV regions normalized to volume (dots: ROIs, n= 4 mice). (e) Ratio of total KC and NKT cell numbers in PP and CV ROIs (dots: lobules, n= 4 mice). (f) Representative IF image of AlbCre-βcateninfl/fl animals and littermate controls showing loss of metabolic (GS) zonation and (g) quantification of ratio of KC numbers in CV to PP ROIs (dots: lobules, n= 3 mice/condition). (h) Ratio of total KCs numbers in CV to PP ROIs at days (D) 3, 8, 13, 20, and 25 post-partum (dots: lobules, n= 5 mice/time point). For all: data pooled from 2-independent experiments; Median± quartiles, (d, g) Two-tailed Mann-Whitney, (i) Kruskal-Wallis with Dunn’s multiple comparison (MC). Channel colours and CV as labelled.
Figure 2.
Figure 2.. Germ-free animals lack KC peri-portal concentration.
Ratio of total KC numbers in CV to PP ROIs (IF images: Extended Fig. 4), dots represent lobules of (a) SPF or GF animals, n= 5 mice/condition; (b) GF animals post co-housing with SPF animals, n= 6 mice/condition; (c) post-antibiotic (ABX) treatment, n= 6 mice/condition, and (d) global MyD88, TLR4, TRIF, Caspase1/11 knock-out animals, n = 4 Caspase1/11−/− mice, n= 5 MyD88−/− and WT mice, n= 6 TLR4−/− and TRIF−/− mice. (e) Representative IF image showing KC distribution of iCdh5-MyD88fl/fl and iCdh5-MyD88wt/wt. (f) Ratio of total KC numbers in CV to PP ROIs (dots: lobules), and (g) total numbers of KCs per volume in iCdh5-MyD88wt/wt and iCdh5-MyD88fl/fl animals (dots: biological replicates); n= 6 iCdh5-MyD88wt/wt mice, 7 iCdh5-MyD88fl/fl mice. For all: data pooled from 2–3 independent experiments; Median± quartiles, (a, f-g) Two-tailed Mann-Whitney, (b-d) Kruskal-Wallis with Dunn’s MC. Channel colours and CV as labelled.
Figure 3.
Figure 3.. Loss of LSECs MyD88 signalling results in KC spatial disruption.
(a) Representative probability density plot of CXCL9 in REX3 animals, CXCL9 depicted by heat map (IF images: Extended Fig. 6). (b) Representative IF image showing KC distribution of CXCR3−/− and CXCL9−/− animals. (c) Ratio of total KC numbers in CV to PP ROIs of CXCR3−/− and CXCL9−/− animals (dots: lobules), and (d) total numbers of KCs per volume (dots: biological replicates); n= 5 WT, CXCR3−/− mice, 6 CXCL9−/− mice. (e) Log counts per million of CXCL9 in LSECs of iCdh5-MyD88wt/wt and iCdh5-MyD88fl/fl (dots: biological replicates, n= 3 mice/condition); glmLTR by edge-R. (f) Representative IF image of CXCL9 Opal staining in iCdh5-MyD88wt/wt, iCdh5-MyD88fl/fl, and CXCL9−/− animals; single-slice images. (g) Frequency of CD138+ CXCL9+ LSECs (equal image volumes analysed, dots= biological replicates, n= 3 animals/condition). (h) Enrichment score (black bars) and log10 adjusted p-value (red line) for top 10 GSEAs PP pathways in iCdh5-MyD88wt/wt LSECs dysregulated in iCdh5-MyD88fl/fl animals (Details: Extended Fig. 8). (i) Representative IF images showing CXCL9 distribution and intensity in iCdh5-MyD88wt/wt, iCdh5-MyD88fl/fl and CXCL9−/− animals following intra-portal CXCL9 injection, and (j) quantification of CXCL9 MFI in respective PP and CV ROIs (dots: ROIs, n= 3 mice/condition). For all: data pooled from 2–3 independent experiments, Median± quartiles, (c, d, g) Kruskal-Wallis with Dunn’s MC. (j) Two-Way ANOVA with Sidak’s MC. Channel colours and CV as labelled.
Figure 4.
Figure 4.. KC localization plays a critical role in preventing pathogen dissemination.
(a) Percent of Listeria captured around PP (E-cadherin+) and CV (E-cadherin-) regions in iCdh5-MyD88wt/wt and iCdh5-MyD88fl/fl animals 2-hours post i.v. injection, n= 4 animals/group. (b-c) Percent of Listeria captured after (b) PP injection, or (c) oral gavage, in liver, spleen and blood from iCdh5-MyD88wt/wt and iCdh5-MyD88fl/fl animals; n shown in figure. (d-g) iCdh5-MyD88wt/wt and iCdh5-MyD88fl/fl animals D1 post i.v. injection of Listeria. (d) Representative IF image of showing TUNEL+ and Ly6G infectious clusters. Quantification of (e) total number of clusters per volume, (f) total size (dots: clusters), and (g) percent location of total clusters; n= 7 animas/group. (h) Representative IF image of iCdh5-MyD88wt/wt and iCdh5-MyD88fl/fl liver showing infectious clusters around CV. (i) Schematic of in silico bacteria capture model: sinusoidal network from PP to CV, with KCs (red) and bacterial-tracks (black line), and final position of each bacteria (black dot). Green window: schematic of exponential distributions used to sample KC locations along sinusoids, λ=25 (red- WT) and λ=500 (blue- KO). (j) Distributions of the captured bacterial distance from PP using λ=500 or λ=25 for KC locations. Last bin of histogram: number of bacteria that are not captured. Two-tailed t-test (excluding last bin). (k) Distributions of the average percent capture of bacteria by KCs from sampled locations from exponential distributions λ=500, or λ=25. Mean- black dashed line; Two-tailed t-test. Experimental data: pooled from 2–4 independent experiments; Median shown, (a-c, e, g) dots represent biological replicates. (a-c, g) Two-Way ANOVA with Sidak’s MC, (e-f) Two-tailed Mann-Whitney. Channel colours and CV as labelled.

Comment in

References

    1. Kubes P & Jenne C Immune Responses in the Liver. Annu Rev Immunol 36, 247–277, doi: 10.1146/annurev-immunol-051116-052415 (2018). - DOI - PubMed
    1. Kastenmuller W, Torabi-Parizi P, Subramanian N, Lammermann T & Germain RN A spatially-organized multicellular innate immune response in lymph nodes limits systemic pathogen spread. Cell 150, 1235–1248, doi: 10.1016/j.cell.2012.07.021 (2012). - DOI - PMC - PubMed
    1. Baptista AP et al. The Chemoattractant Receptor Ebi2 Drives Intranodal Naive CD4(+) T Cell Peripheralization to Promote Effective Adaptive Immunity. Immunity 50, 1188–1201 e1186, doi: 10.1016/j.immuni.2019.04.001 (2019). - DOI - PubMed
    1. Doi Y et al. Development of complementary expression patterns of E- and N-cadherin in the mouse liver. Hepatol Res 37, 230–237, doi: 10.1111/j.1872-034X.2007.00028.x (2007). - DOI - PubMed
    1. Braeuning A et al. Differential gene expression in periportal and perivenous mouse hepatocytes. FEBS J 273, 5051–5061, doi: 10.1111/j.1742-4658.2006.05503.x (2006). - DOI - PubMed

Methods References

    1. Groom JR et al. CXCR3 chemokine receptor-ligand interactions in the lymph node optimize CD4+ T helper 1 cell differentiation. Immunity 37, 1091–1103, doi: 10.1016/j.immuni.2012.08.016 (2012). - DOI - PMC - PubMed
    1. Sorensen I, Adams RH & Gossler A DLL1-mediated Notch activation regulates endothelial identity in mouse fetal arteries. Blood 113, 5680–5688, doi: 10.1182/blood-2008-08-174508 (2009). - DOI - PubMed
    1. Li W, Germain RN & Gerner MY Multiplex, quantitative cellular analysis in large tissue volumes with clearing-enhanced 3D microscopy (Ce3D). Proc Natl Acad Sci U S A 114, E7321–E7330, doi: 10.1073/pnas.1708981114 (2017). - DOI - PMC - PubMed
    1. Goddard ET, Fischer J & Schedin P A Portal Vein Injection Model to Study Liver Metastasis of Breast Cancer. J Vis Exp, doi: 10.3791/54903 (2016). - DOI - PMC - PubMed
    1. Pentecost M, Kumaran J, Ghosh P & Amieva MR Listeria monocytogenes internalin B activates junctional endocytosis to accelerate intestinal invasion. PLoS Pathog 6, e1000900, doi: 10.1371/journal.ppat.1000900 (2010). - DOI - PMC - PubMed

MeSH terms

Substances