. 2020 Dec;588(7837):337-343.
doi: 10.1038/s41586-020-2962-9. Epub 2020 Nov 25.

A map of cis-regulatory elements and 3D genome structures in zebrafish

Affiliations

A map of cis-regulatory elements and 3D genome structures in zebrafish

Hongbo Yang et al. Nature. 2020 Dec.

Abstract

The zebrafish (Danio rerio) has been widely used in the study of human disease and development, and about 70% of the protein-coding genes are conserved between the two species1. However, studies in zebrafish remain constrained by the sparse annotation of functional control elements in the zebrafish genome. Here we performed RNA sequencing, assay for transposase-accessible chromatin using sequencing (ATAC-seq), chromatin immunoprecipitation with sequencing, whole-genome bisulfite sequencing, and chromosome conformation capture (Hi-C) experiments in up to eleven adult and two embryonic tissues to generate a comprehensive map of transcriptomes, cis-regulatory elements, heterochromatin, methylomes and 3D genome organization in the zebrafish Tübingen reference strain. A comparison of zebrafish, human and mouse regulatory elements enabled the identification of both evolutionarily conserved and species-specific regulatory sequences and networks. We observed enrichment of evolutionary breakpoints at topologically associating domain boundaries, which were correlated with strong histone H3 lysine 4 trimethylation (H3K4me3) and CCCTC-binding factor (CTCF) signals. We performed single-cell ATAC-seq in zebrafish brain, which delineated 25 different clusters of cell types. By combining long-read DNA sequencing and Hi-C, we assembled the sex-determining chromosome 4 de novo. Overall, our work provides an additional epigenomic anchor for the functional annotation of vertebrate genomes and the study of evolutionarily conserved elements of 3D genome organization.


Conflict of interest statement

Declaration of interests

The authors declare no competing financial interests.

Figures
Extended Data Figure 1.
Extended Data Figure 1.. Tissue-specific gene expression in zebrafish.
a, Clustering analysis of transcripts from RNA-seq data in embryonic and adult tissues (n=31,842). b and c, Gene Ontology and KEGG pathway analysis for the tissue-specific genes in adult brain, heart and testis (the number of tissue-specific genes in these two figures are, Brain=3,693, Heart=392, Testis=1,605). d, Distribution of H3K4me3 signals surrounding the known and predicted novel transcripts. e, Human orthologs of zebrafish tissue-specific genes were more tissue-specific compared to human orthologs of non-tissue-specific zebrafish genes (n=14,764, 3,739, 6,043, Mann-Whitney U Test, two-sided, ***P value<2.2×10⁻¹⁶).
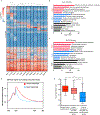
Extended Data Figure 2.
Extended Data Figure 2.. Comparative analysis of zebrafish cis-regulatory elements.
a, Comparison of the predicted regulatory elements identified with previous data. Enhancers were based on H3K27ac signals in the same four tissues (brain, heart, intestine, testis) from Perez-Rico et al. 2017. Note the data we generated is from Tübingen zebrafish strain and the published results were from the AB strain. b, Number of predicted cis-regulatory elements in each tissue. E-brain stands for 1 dpf embryonic neuron cells. E-trunk stands for 1 dpf zebrafish whole trunk region. c, An example showing genes with active promoters have higher expression level. Blue hollow bar indicates the known mrpl39 promoter. Orange hollow bar indicates the potential novel promoter. Note that the mrpl39 promoter has H3K4me3 peaks in both muscle and brain, but only has strong H3K27ac signals in muscle and its expression is higher (4.43-fold). d, Gene Ontology results for the muscle-specific enhancers and skin-specific enhancers. We used the GREAT tool for this analysis (the numbers of tissue-specific enhancers used in this figure are muscle=813, skin=512).
Extended Data Figure 3.
Extended Data Figure 3.. Enhancer reporter assay for tissue-specific enhancers.
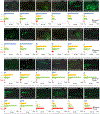
In total, 28 of 32 predicted tissue-specific enhancers showed consistent GFP signals in the corresponding tissues. For the eight brain enhancers tested, 63/95, 51/86, 85/119, 112/143, 27/45, 34/48, 27/41, 62/77, and 37/45 embryos, respectively, had green signals in the brain region. For the six tested heart enhancers, 64/94, 52/85, 79/121, 20/41, 51/95, 32/55 and 20/31 embryos, respectively had green signals in the heart region. For the six tested muscle enhancers, 52/57, 26/30, 107/124, 53/63, 93/114, 61/67 and 66/78 embryos, respectively had green signals in the trunk muscle. For the four selected kidney enhancers, 47/82, 35/67, 44/62, 15/42 and 56/110 embryos, respectively had green signals in the kidney region.
Extended Data Figure 4.
Extended Data Figure 4.. Single cell ATAC-seq in zebrafish brain.
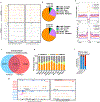
a, Barcode selection of single cell ATAC-seq. The x-axis represents the log value of the number of unique molecular identifiers (UMI); the y axis represents the ratio of fragments in promoter regions; the red lines represent threshold, and the grey shadows represent that the barcode passed the filter. b, Genomic distribution of all differentially accessible (DA) peaks. c, Overlap of all differentially accessible peaks with enhancers predicted in bulk brain. d, Top panel, the cluster distribution in the tSNE projection. Bottom left, pileups of differentially accessible ATAC-seq signals for each cluster. Shown in the figure is the +/− 10kb flanking region surrounding peak centers. Bottom right, most significantly enriched transcription factor motif for each cluster. e, tSNE projection of all scATAC-seq cells colored by Z-score of peak enrichment. f, Motif enrichment of known neuron-specific TFs in scATAC-seq predicted clusters (n=19,955)
Extended Data Figure 5.
Extended Data Figure 5.. Heterochromatin annotation in adult tissues.
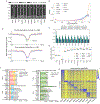
a, WashU Epigenome Browser screenshot of H3K9me3 and H3K9me2 histone ChIP-seq signals in 11 zebrafish adult tissues. The values on the y-axis were input-normalized. b, Distribution of H3K9me3 and H3K9me2 sites in the zebrafish genome. c, Venn Diagram shows the overlap between H3K9me3 and H3K9me2 sites in zebrafish genome. d, Overlapping percentile of H3K9me3 and H3K9me2 peaks in adult tissues. e, H3K9me3 and H3K9me2 sites were depleted of ATAC-seq, H3K4me3 and H3K27ac ChIP-seq signals (n= 68,789 H3K9me3 sites and n=73,777 H3K9me2 sites). f, Overlap of H3K9me3 sites, H3K9me2 sites, and ATAC-seq peaks with repetitive elements (The total number of each bar, from left to right, 68,789, 73,777 and 436,036). g, Examples of H3K9me3 sites in one tissue found to be active regions in other tissues. Horizontal scale 0–20 for H3K27ac and H3K4me3, 0–10 for RNA-seq, 0–5 for H3K9me3 and H3K9me2.
Extended Data Figure 6.
Extended Data Figure 6.. DNA methylation level and distribution in adult tissues.
a, Fraction of total CpGs with low (< 25%), medium (≥ 25% and < 75%), and high (≥ 75%) methylation levels and mean CpG methylation levels (mCG/CG) in zebrafish adult tissues (the mCG/CG ration, from left to right, 0.788, 0.859, 0.790, 0.777, 0.791, 0.797, 0.781, 0.777, 0.804, 0.789, 0.781). b, Distribution of CpG methylation levels across zebrafish adult tissues. c, The distribution of non CpG methylation in 11 adult tissues. d, Mean methylation levels of the tissue-specific gene promoters. n represents the number of tissue-specific gene promoter. e, Mean methylation level of CpGs overlapping different genomic features or repetitive element classes. CDS, coding sequence. f, Number of UMRs and LMRs in zebrafish tissues and their overlap with enhancer and promoters (left panel) (number of UMR and LMR, from top to bottom, 14,990, 10,569, 14,569, 14,587, 14,831, 14,289, 13,842, 13,569, 14,424, 14,374, 13,908, 30,009, 7,916, 19,038, 21,411, 22,591, 16,796, 14,961, 16,268, 17,481, 15,932, 15,665) and ATAC-seq peaks (right panel)( numbers of UMR and LMR are the same with left panel). f, Clustering of tissue-specific hypoDMRs. Values in the heatmap are mean methylation levels of hypoDMRs (n=17,654, number of tissue-specific hypoDMRs).
Extended Data Figure 7.
Extended Data Figure 7.. De novo assembly of zebrafish chromosome 4 of the Tübingen strain.
a, WashU Epigenome Browser snapshot showing that heterochromatic marks H3K9me2 and H3K9me3 signals were enriched on chromosome 4 in zebrafish testis. The values on the y-axis were input-normalized. b, H3K9me2, H3K9me3, and DNA methylation level on chr4 long arm are significantly higher than other regions in all tissues (n=11, two-sided, t-test). c, Overall strategy of de novo assembly of the Tübingen chr4 by integrating 10X, Nanopore, Bionano, and Hi-C data. d, Bionano long molecule sequencing data shows that there were many SVs on chr4 when mapped to the GRCz11 reference genome. e, SVs on chr4 detected by Bionano when the data were mapped to the de novo assembled chr4.
Extended Data Figure 8.
Extended Data Figure 8.. Conservation of CREs from zebrafish to other vertebrates.
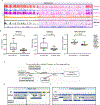
a, Percentage of zebrafish enhancers whose sequences were conserved in human (the number of each bar, from left to right, 13,307, 7,018, 11,940, 7,499, 14,783, 14,272, 8,995, 13,777, 10,757, 15,505, 1,734, 4,011, 5,247). b and c, Similar to Fig. 4a. Percentage of zebrafish exons and CREs that have orthologous sequences in mouse and other fish species. Total number of each bar, from left to right: 1,000, 25593, 58,065, 1,000. For exons and random, we randomly sample 1000 elements and computed their conservation percentage. The simulations were performed 20 times and the average percentage was presented. d, Another example of ultra-conserved non-coding element (UCNE). This element (FOXP1_Finn_1) is predicted to be a muscle enhancer in zebrafish, mouse, and human. Grey vertical bar marks the ultra-conserved region. Red vertical bar is the enhancer sequence in the human genome that was validated as a limb enhancer by transgenic mouse reporter assay in the VISTA Enhancer Browser (#hs956).
Extended Data Figure 9.
Extended Data Figure 9.. Distal ATAC-seq peak-to-gene pairs, enhancer-to-gene pairs, and transcriptional regulation network.
a and b, Distance distribution of CREs to their linked gene TSS. c, Correlation of ATAC-seq peak-to-gene pairs and Enhancer-to-gene pairs (n from left to right=3,292, 3,827, 3,544, 3,281, 3,008, 2,795, 2,357, 2,001, 1,106). d, Validation of predicted enhancer-to-gene pairs by Hi-C interaction counts in muscle. e, mef2d is a regulator in both zebrafish muscle and heart, but it regulates different downstream targets by motif prediction analysis. f, The overall structure of the regulatory network is conserved between human and zebrafish. FFL connection analysis was performed, in this analysis, there are three types of nodes: A, driver node that regulates B and C; B, middle node, regulated by A but regulating node C; C, passenger node, regulated by both A and B.
Extended Data Figure 10.
Extended Data Figure 10.. Compartment and TADs in zebrafish.
a, Heatmap of genome-wide Hi-C interaction matrices in zebrafish brain (blue) and muscle (red). b, Active marks (H3K4me3, H3K27ac, and ATAC-seq) were enriched in compartment A and depleted in compartment B. Repressive marks (H3K9me2 and H3K9me3) were enriched in compartment B. Error bands represent standard error of the mean. c, Genome browser snapshot of A/B compartment in brain and muscle. The blue vertical shaded area marks a region that is located in compartment B in brain but in compartment A in muscle. As expected, A compartment which is associated with more ATAC-seq peaks, H3K27ac and RNA-seq signals. d, Examples of shared TADs between zebrafish brain and muscle. e, Average DI scores surrounding TAD boundaries identified in brain (upper panel) and muscle (lower panel). f, ChIP-seq data shows that CTCF binding sites were enriched at TAD boundaries. g, Footprint analysis of ATAC-seq peaks in the TAD boundaries shows enrichment of CTCF binding motif (number of each bar, from left to right, 0.213, 0.24, 0.22, 0.237, 0.251, 0.232, 0.24, 0.262, 0.271, 0.281, 0.37, 0.27, 0.253, 0.25, 0.252, 0.253, 0.26, 0.23, 0.238, 0.24, 0.22). h, Repetitive elements enriched at TAD boundaries (left panel) and loop anchors (right panel).
Extended Data Figure 11.
Extended Data Figure 11.. Comparing zebrafish evolutionary breakpoints with TAD annotation.
a. Similar to Fig. 5d. Enrichment of evolutionary breakpoints at TAD boundaries. Relative positions of evolutionary breakpoints to TADs in 15 vertebrates. In all cases, we found that the evolutionary breakpoints were enriched at zebrafish TAD boundaries and depleted from the center of TADs. Grey vertical bar labels the TAD body area. b, By comparing zebrafish with 17 vertebrates, H3K4me3 signals were found to be more enriched at TAD boundaries with breakpoints than those without breakpoints. Orange vertical bar labels the TAD boundaries. c, Higher H3K4me3 levels at breakpoint-containing TAD boundaries when using TADs annotation from zebrafish muscle were found as well, similar to Fig. 5g. d, H3K4me3 enrichment in human ESCs (H1) TAD boundaries with or without zebrafish-to-human breakpoints. e, H3K4me3 enrichment in mouse ESCs TAD boundaries with or without zebrafish-to-mouse breakpoints. f, H3K4me3 enrichment in human ESCs (H1) TAD boundaries with or without mouse-to-human breakpoints.
Extended Data Figure. 12.
Extended Data Figure. 12.. TADs with and without breakpoints.
a, H3K27ac and ATAC-seq signals do not show differences at TAD boundaries with breakpoints compared to those without breakpoints. Orange vertical bar labels the TAD boundaries. b, Sizes of TADs with and without evolutionary breakpoints were similar (n=573, 777, two-sided, t-test). c, Enrichment of transcription at breakpoints (BP) that overlap with CTCF TAD boundaries in K562 cells (the number of breakpoints in blue line is 639, red line is 625). d, In 17 vertebrates, TADs without evolutionary breakpoints (bottom panel) have stronger interaction frequencies in the middle than TADs with evolutionary breakpoints (upper panel). Breakpoints in these 17 vertebrates were defined by comparing their genomes to the zebrafish genome. e, Distribution of correlations between the expression pattern of each pair of paralogs across 11 adult zebrafish tissues. f, Correlations between pairs of paralogs located on the same chromosome. Among them, 17 pairs were located within the same TAD, and the rest of the 65 pairs were located in different TADs. As a control, we randomly sampled 100 genes. Number of each bar, from left to right, 17, 65, 100.
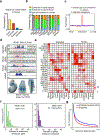
Fig. 1 |
Fig. 1 |. Identification of cis-regulatory elements in the zebrafish genome.
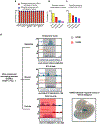
a, Tissues analyzed and techniques performed in this study. b, WashU Epigenome Browser snapshot of an example region, showing Hi-C, ChIP-seq, ATAC-seq, WGBS, and RNA-seq data in adult zebrafish brain, muscle and liver. The values on the y-axis for ChIP-seq were input-normalized. c, Expression of myh6 is heart-specific in both zebrafish and human (n=2). The expression values in human expression were from GTEx. Error bars represent standard error of the mean. d, Boxplot of the expression of brain-specific genes in zebrafish (upper panel) (n=2,481) and the expression of their orthologs in human (lower panel) (n=2,481). e, An example of a predicted novel transcript. Vertical scale 0–20 for H3K27ac and H3K4me3, 0–10 for RNA-seq. f, RNA-seq and H3K4me3 ChIP-seq signals for the predicted 8,311 novel transcripts across all the tissues. For all boxplots in this manuscript: horizontal line, median; box, interquartile range (IQR); whiskers, the values are between 5th and 95th percentiles
Fig. 2 |
Fig. 2 |. Characterization of tissue-specific cis-regulatory elements.
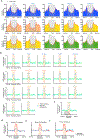
a, Number of ATAC-seq peaks predicted in each tissue and their genomic distribution. b and c, Tissue specificity of proximal and distal ATAC-seq peaks in 11 adult tissues. d, Clustering analysis identified tissue-specific enhancers. Values in the heatmap were input-normalized H3K27ac intensity (Number of the enhancer, n=58,226). e, Normalized ATAC-seq intensity in the corresponding enhancer elements shown in d. f, Examples of validated tissue-specific enhancers by GFP reporter assay in zebrafish embryos. For brain-enhancer 5, 112 out of 143 surviving embryos showed similar patterns. For heart-enhancer 7, 61 out of the 67surviving embryos showed similar patterns. For muscle-enhancer 5, 53 out of the 63 surviving embryos showed similar patterns. For kidney-enhancer 1, 47 out of the 82 surviving embryos showed similar patterns. Scale bar: 200 μm. g, Pearson correlation coefficient (PCC) between aggregated signals of scATAC-seq and bulk ATAC-seq data. Values are the sums of the reads in continuous 10 kb bins, normalized by sequencing depth. h, The overlap between peaks predicted in bulk and scATAC-seq data. i, t-SNE(t-Distributed Stochastic Neighbor Embedding) analysis identified 25 clusters in the scATAC-seq data in zebrafish adult brain (n=19,955). j, Examples of enriched motifs in different clusters from scATAC-seq peaks (n=19,955).
Fig. 3 |
Fig. 3 |. Analysis of heterochromatin and repetitive elements and de novo assembly of zebrafish chromosome 4.
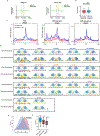
a, Comparison of H3K9me2 and H3K9me3 sites with active marks (ATAC-seq, H3K4me3, or H3K27ac peaks) from the same tissue (left panel) and active marks in other tissues (right panel). The number of heterochromatin regions in each tissue: Testis 36,672; Spleen 20,813; Skin 24,687; Muscle 25,692; Liver 29,117; Kidney 21,821; Intestine 24,072; Heart 14,706; Colon 22,426; Blood 19,082; and Brain 21,596. b, Repetitive elements enrichment analysis for predicted enhancers, H3K9me3, and H3K9me2 sites. Color and size indicate fold enrichment. c, DNA methylation levels, H3K27ac ChIP-seq, and ATAC-seq signals for tissue-specific hypoDMRs. Tissue-specific hypoDMRs cluster size, Muscle=1,912, Heart=1,708, Liver=3,386. d, Examples of tissue-specific hypoDMRs. Vertical scale 0–300 for H3K4me3, 0–100 for H3K27ac and ATAC-seq, 0–1 for WGBS, 0–40 for RNA-seq. e, Brain Hi-C data mapped to GRCz10, GRCz11, and the de novo assembled chr4. Aberrant Hi-C signals were observed when Hi-C reads were mapped to the GRCz10 or GRCz11 reference genome but were not visible when mapped to the de novo assembled chr4. f, Alignment of the de novo assembled chr4 to the GRCz11 reference genome (alignment of 2 kb bins by LASTZ).
Fig. 4 |
Fig. 4 |. Conservation of zebrafish cis-regulatory elements and transcriptional networks.
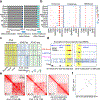
a, Percentage of zebrafish exons and CREs that have orthologous sequences in human. Total number for each bar: Exon 1,000; Promoter 25593; Enhancer 58,065; and Random 1,000. For exons and random, we randomly sampled 1000 elements and computed their conservation percentage. The simulations were performed 20 times and the average percentage shown. b, Percentage of human orthologous sequences of zebrafish enhancers that were predicted as enhancers in human tissues (total number of each bar: Brain 1,241; Blood 748; Colon 775; Heart 839; Intestine 564; Kidney 173; Liver 402; Muscle 591; Skin 356; and Spleen 1,000). c, Fish phyloP score for the zebrafish enhancers whose sequences were not conserved in human (number of enhancers in red line is 51,446, blue line is 50,000). d, An ultra-conserved non-coding element predicted as a brain enhancer in zebrafish, mouse, and human. This enhancer element has been validated by transgenic reporter assay in mouse (#hs1056 in the VISTA Enhancer Browser). e, Heatmap showing TF motif enrichment in tissue-specific enhancers in zebrafish and human. f, Linking distal enhancers to their target genes by correlation of tissue-specific activity. (Left) Distribution of the predicted number of enhancers per gene. (Right) Distribution of predicted number of genes per enhancer. g, Validation of the predicted enhancer-to-gene pairs by Hi-C interaction counts in brain.
Fig. 5 |
Fig. 5 |. Higher-order chromatin structure and zebrafish genome evolution.
a, Aggregate Peak Analysis (APA) plot and motif analysis of tissue-specific or shared chromatin loops. In each panel, n is the number of loops in that group. b, (Left) Annotation of cis-elements in the predicted loop anchors in brain with total number of loops in pie chart, 7,710. (Right) Comparison of promoter-enhancer chromatin loops with correlation-based linkage between ATAC-Seq or histone modification-based enhancer-to-gene pairs with total number of loops in pie chart, 4,996. c, Examples of shared, brain-specific and muscle-specific chromatin loops. d, Relative position of evolutionary breakpoints to TADs. Breakpoints were between zebrafish and mouse (left) or between zebrafish and human (right). In all cases, we found that the evolutionary breakpoints were enriched at zebrafish TAD boundaries and depleted from the center of TADs. Kb, kilobases. e, TADs without breakpoints (upper panel) have stronger interactions inside than TADs with breakpoints (lower panel). f, Expression pattern of genes in TADs without evolutionary breakpoint is more conserved than genes in TADs with a breakpoint inside. For each gene, we collected its expression profile across the same 10 tissues in both zebrafish and human, and computed a Spearman Correlation Co-efficient (SCC) between the profiles for each gene. The number of gene pairs without BPs, 4,625, the number with BPs 3,918 (3.56×10⁻²⁶, Mann-Whitney U Test, two-sided). g, H3K4me3 signals were higher in TAD boundaries with breakpoints than TAD boundaries without breakpoints. h, Higher transcriptional activities at TAD boundaries with breakpoints and containing CTCF binding sites in human GM12878 cells (the number of breakpoints in blue line is 639, red line is 625) (K562 data in Extended Data Fig. 12c). *Note: Results from 17 additional vertebrates are shown in Extended Data Fig. 11a, b and Extended Fig. 12d.

References

    1. Howe K. et al. The zebrafish reference genome sequence and its relationship to the human genome. Nature 496, 498–503, doi:10.1038/nature12111 (2013). - DOI - PMC - PubMed
    1. Gerhard GS et al. Life spans and senescent phenotypes in two strains of Zebrafish (Danio rerio). Experimental gerontology 37, 1055–1068 (2002). - PubMed
    1. Lamason RL et al. SLC24A5, a putative cation exchanger, affects pigmentation in zebrafish and humans. Science 310, 1782–1786, doi:10.1126/science.1116238 (2005). - DOI - PubMed
    1. Vastenhouw NL et al. Chromatin signature of embryonic pluripotency is established during genome activation. Nature 464, 922–926, doi:10.1038/nature08866 (2010). - DOI - PMC - PubMed
    1. Bogdanovic O. et al. Dynamics of enhancer chromatin signatures mark the transition from pluripotency to cell specification during embryogenesis. Genome Res 22, 2043–2053, doi:10.1101/gr.134833.111 (2012). - DOI - PMC - PubMed

Publication types

MeSH terms

Substances