. 2020 Dec;588(7837):303-307.
doi: 10.1038/s41586-020-2971-8. Epub 2020 Nov 25.

The gut microbiota is associated with immune cell dynamics in humans

Affiliations

The gut microbiota is associated with immune cell dynamics in humans

Jonas Schluter et al. Nature. 2020 Dec.

Abstract

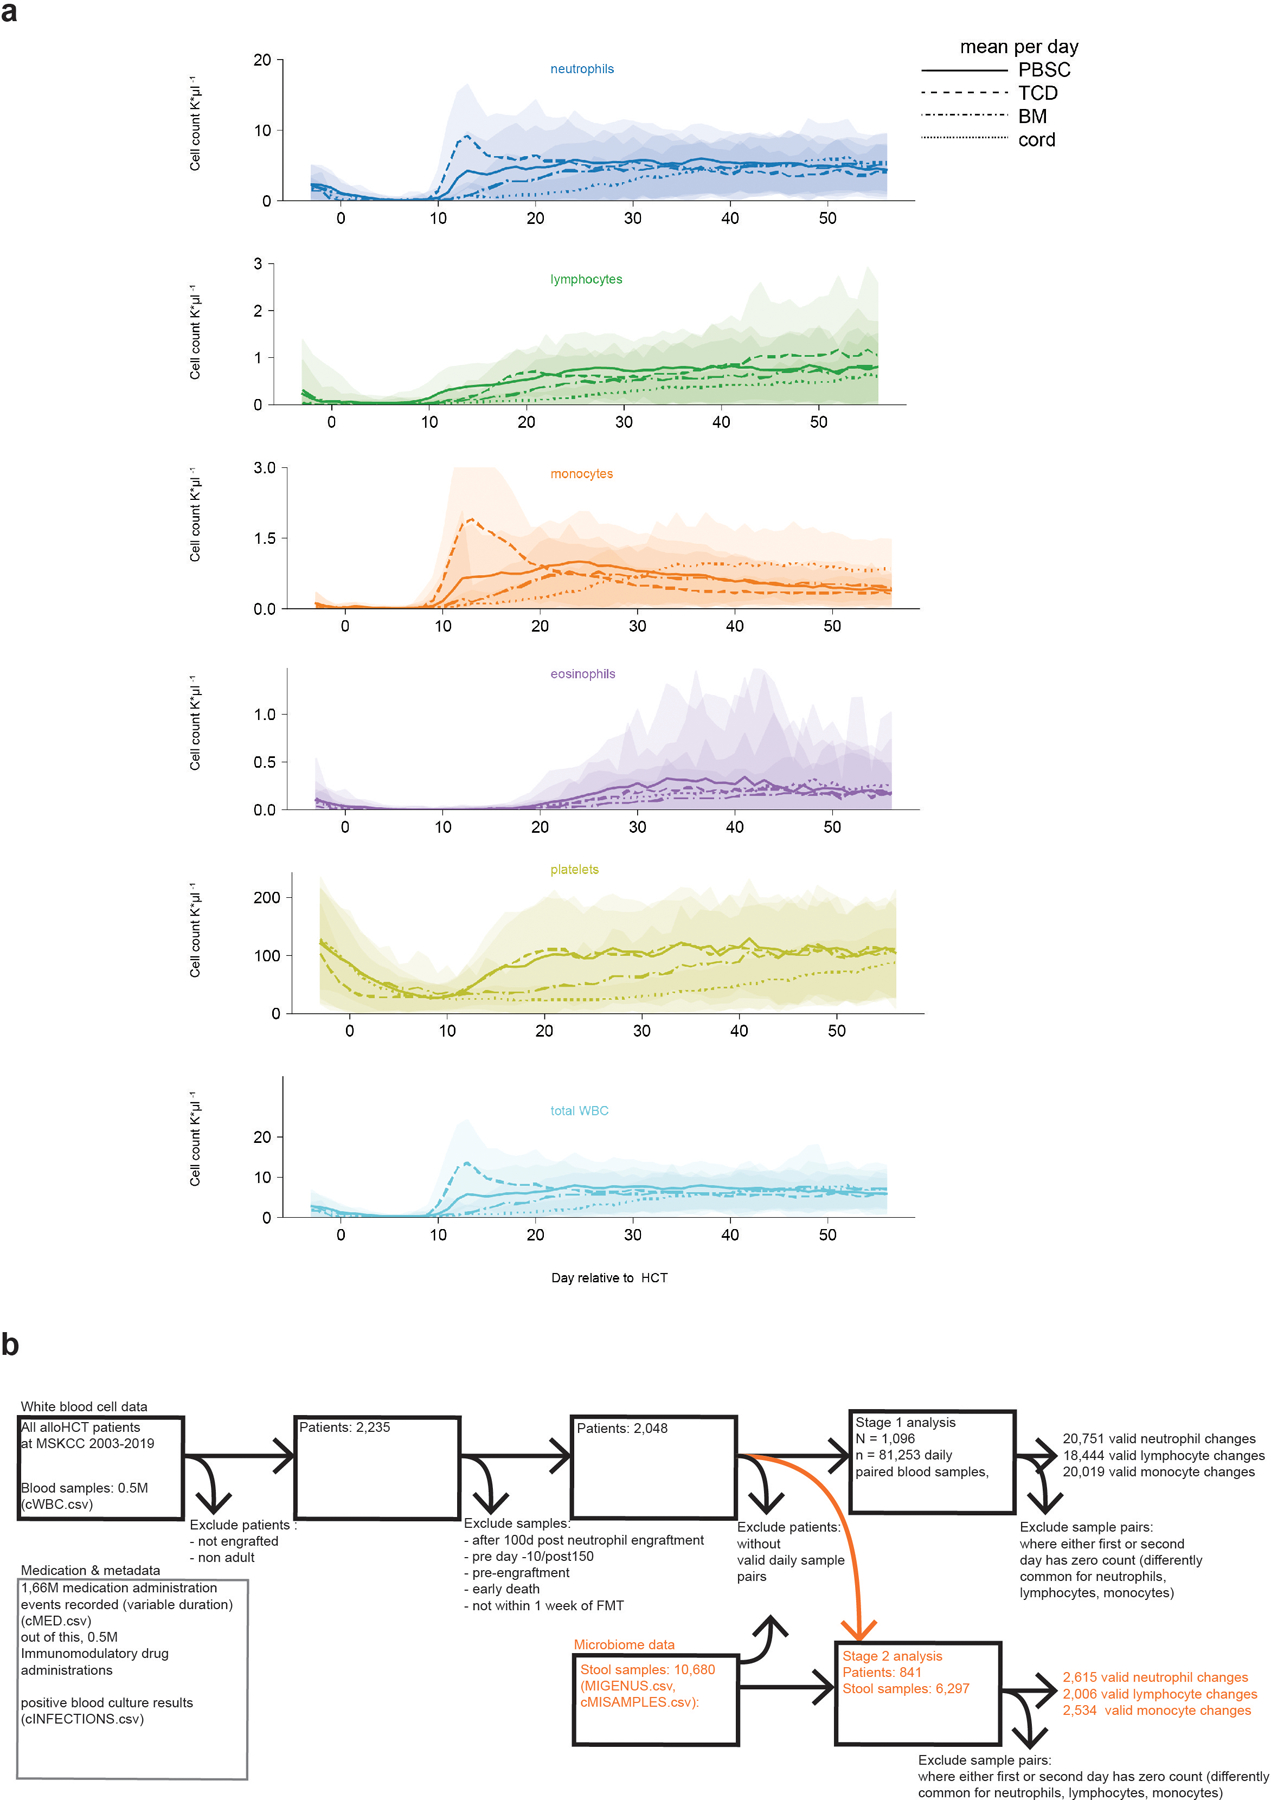
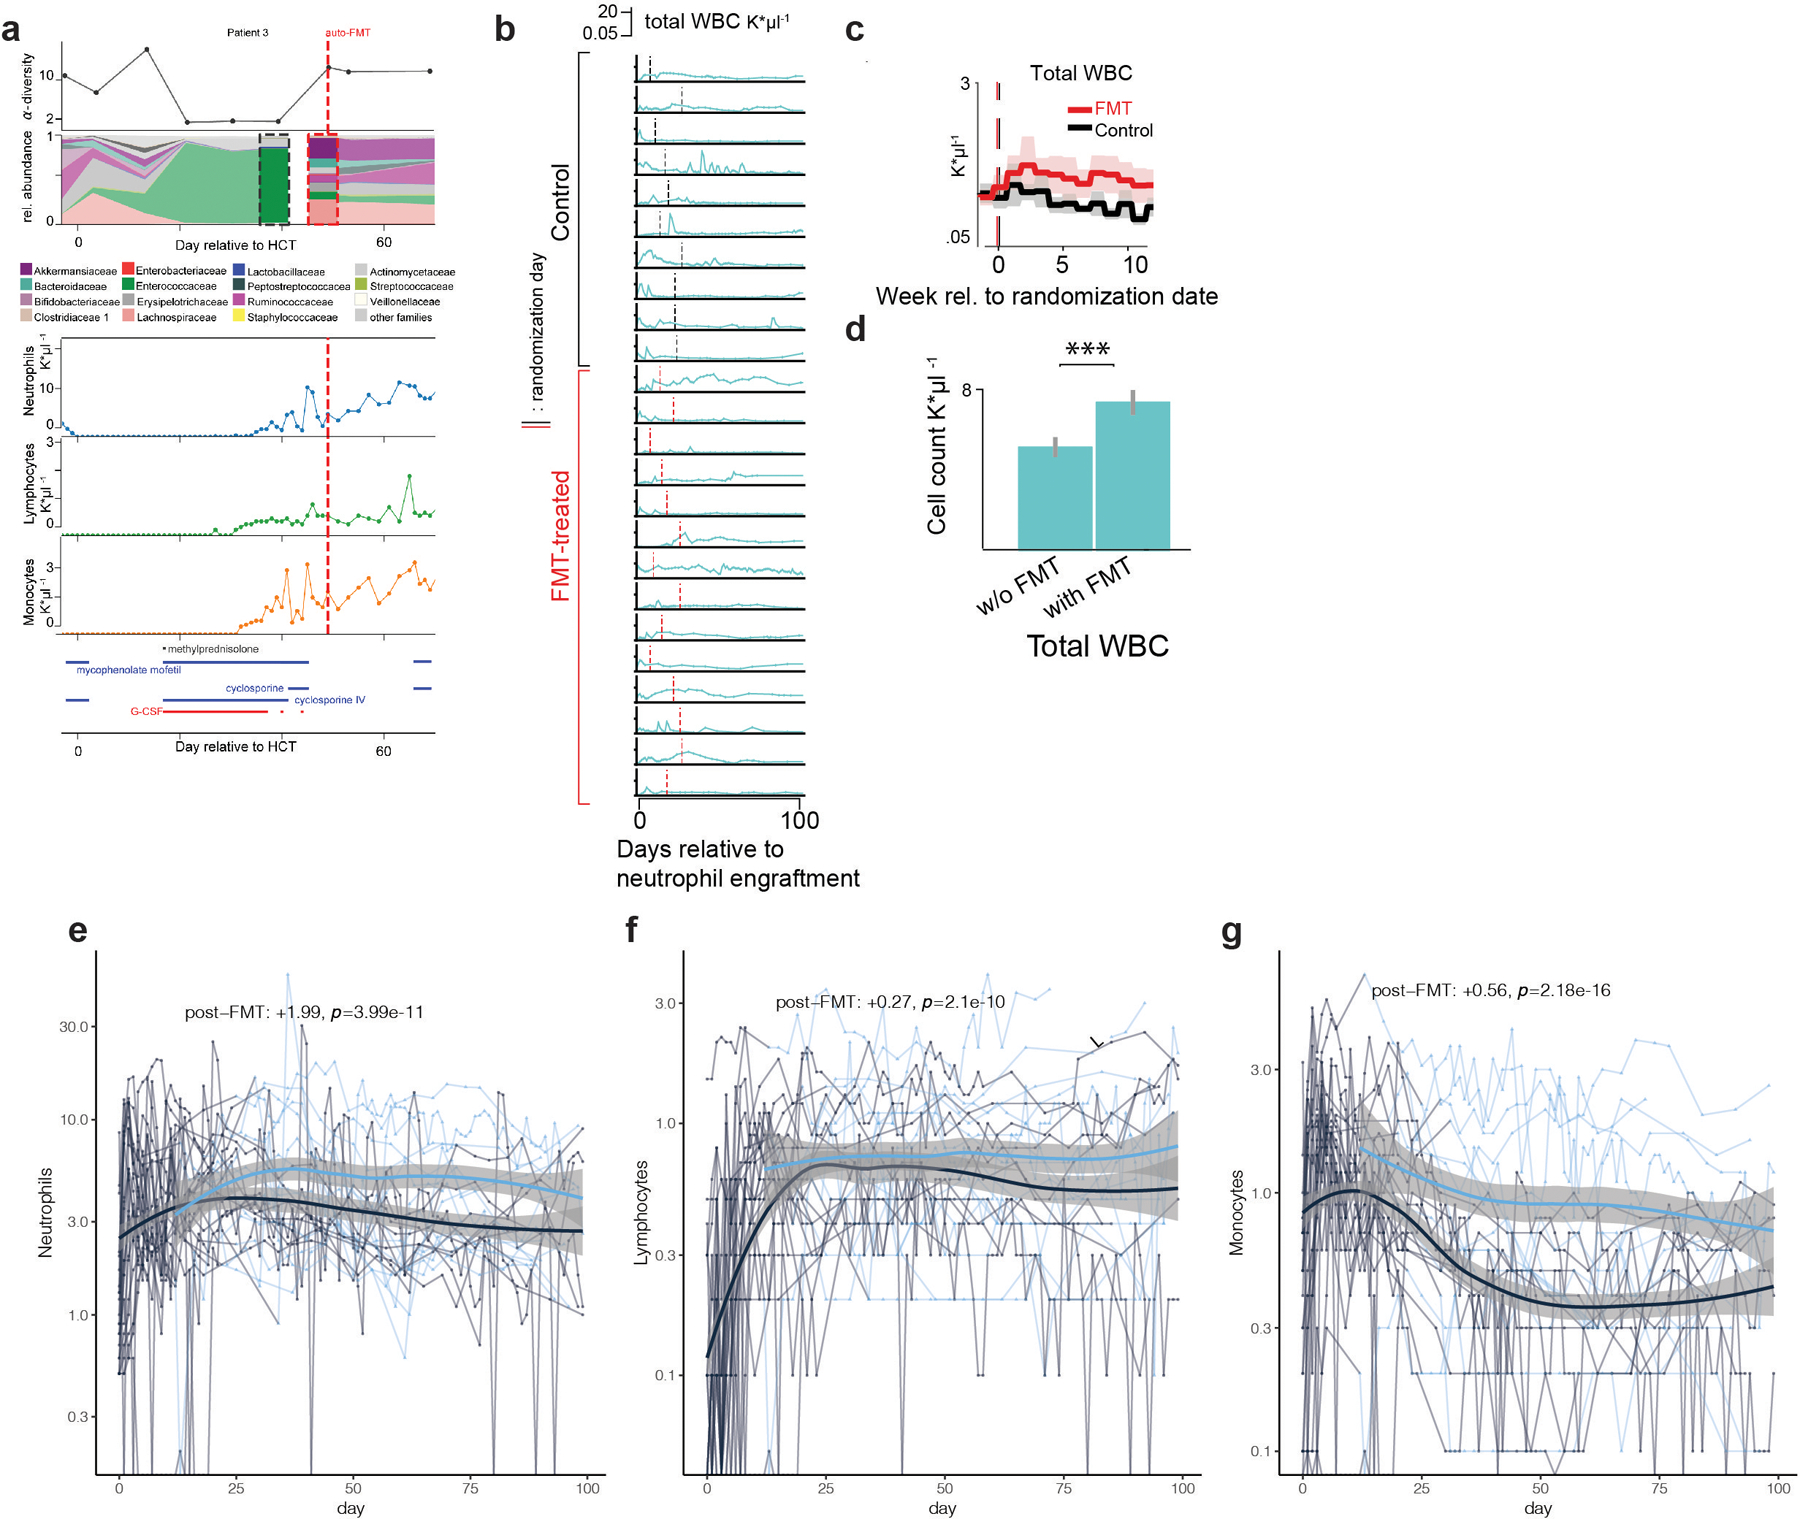
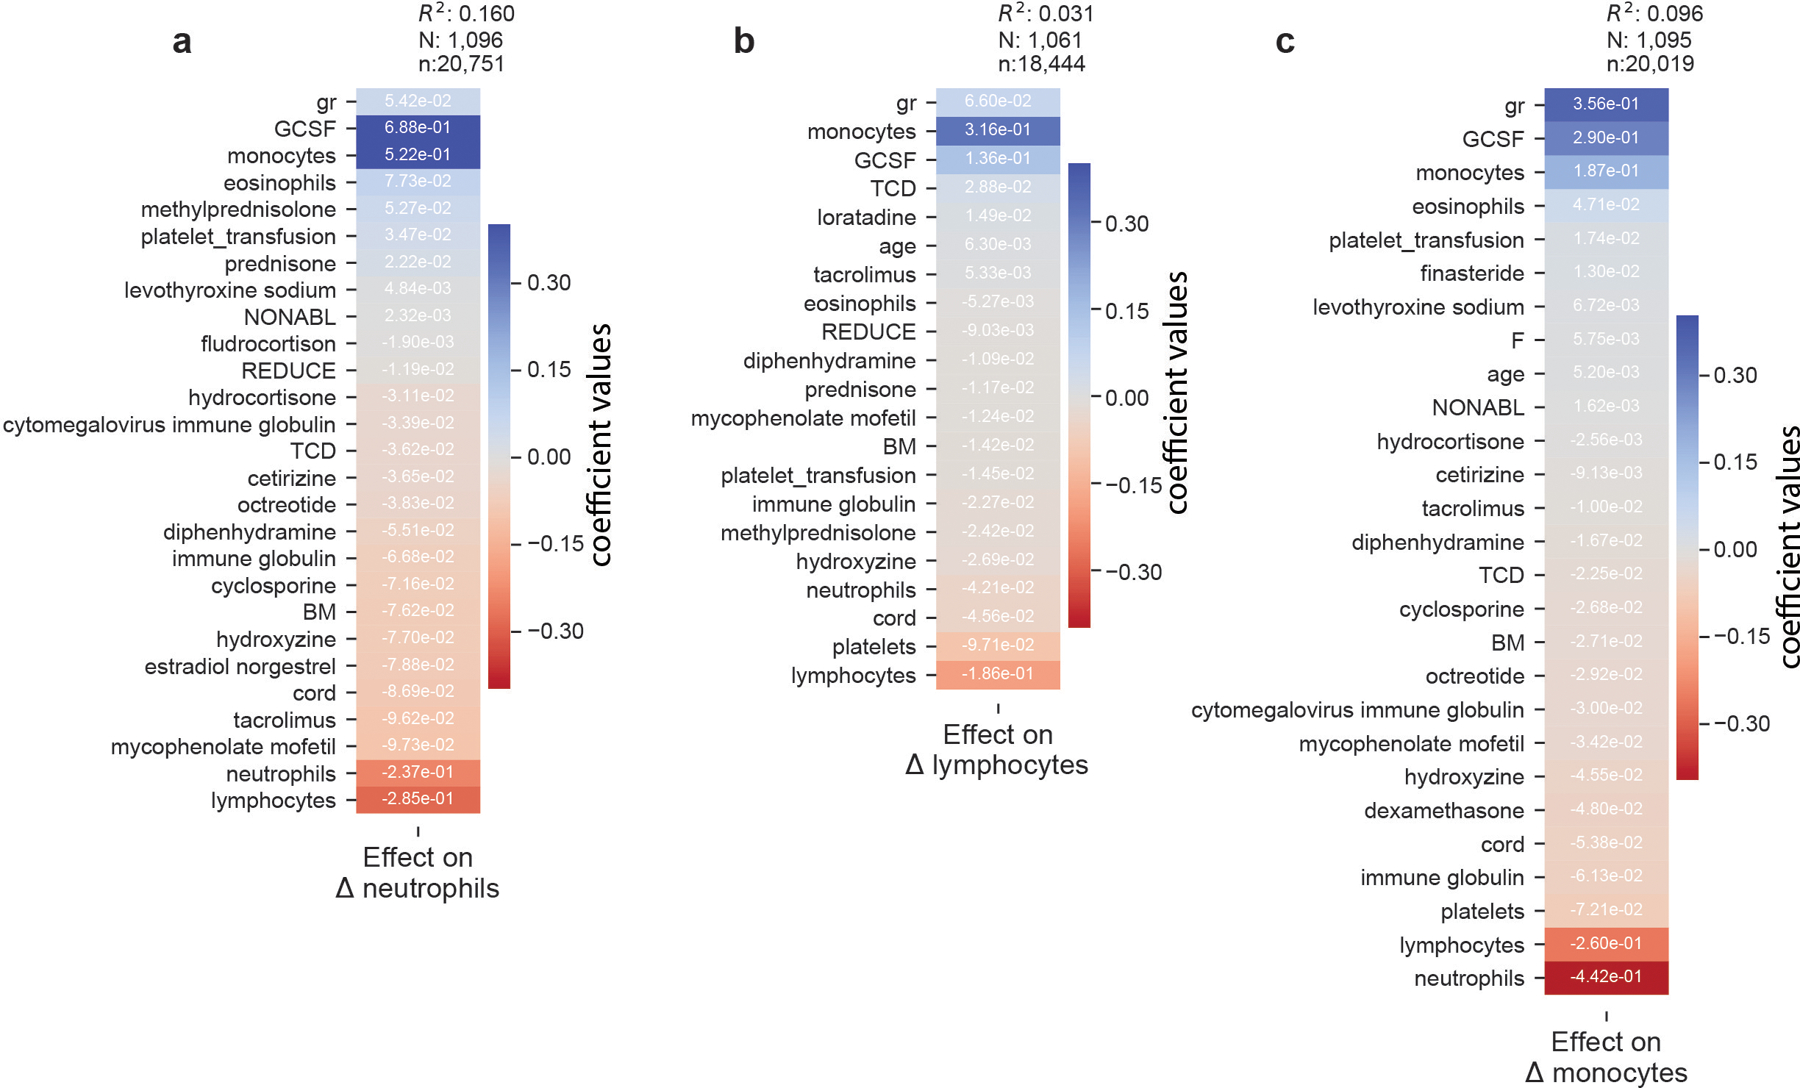
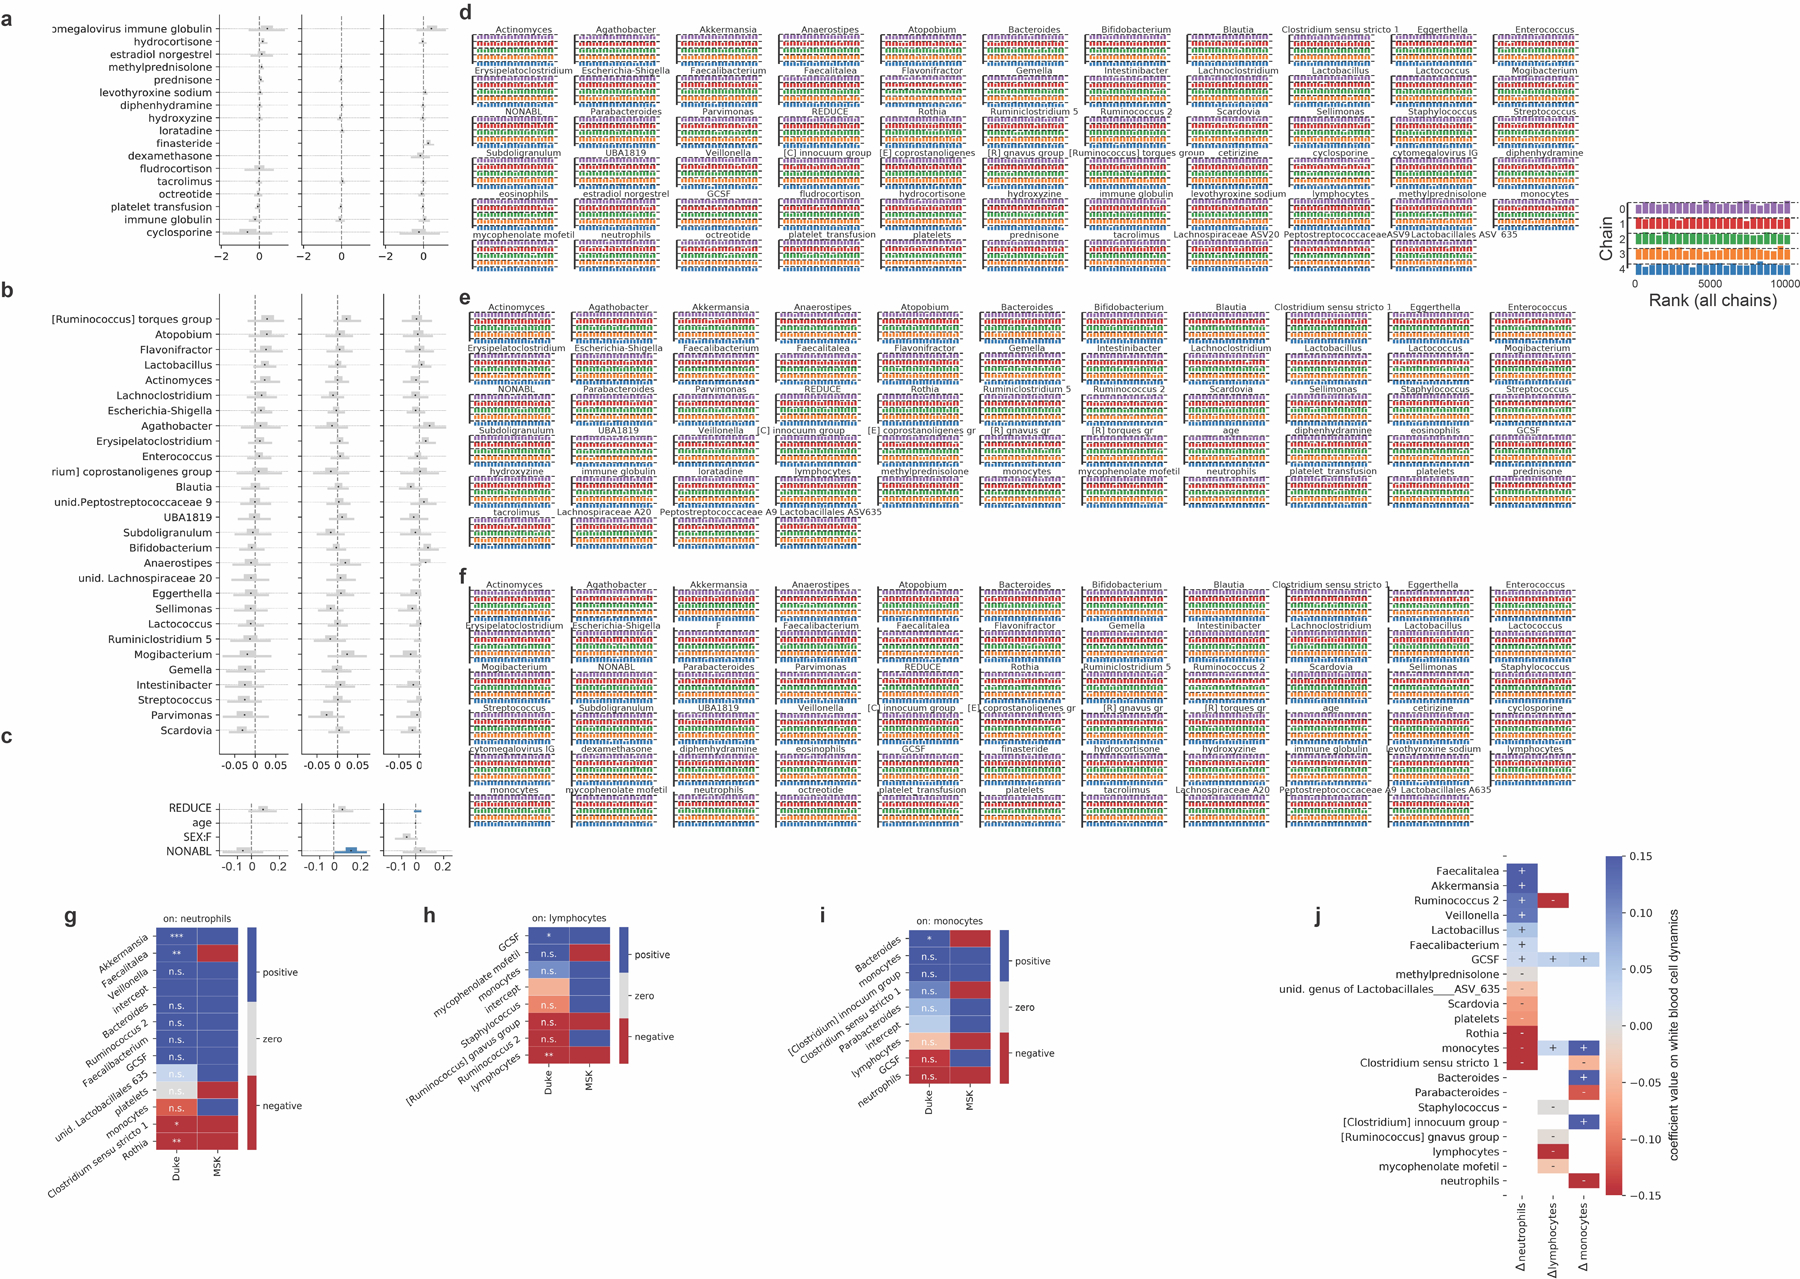
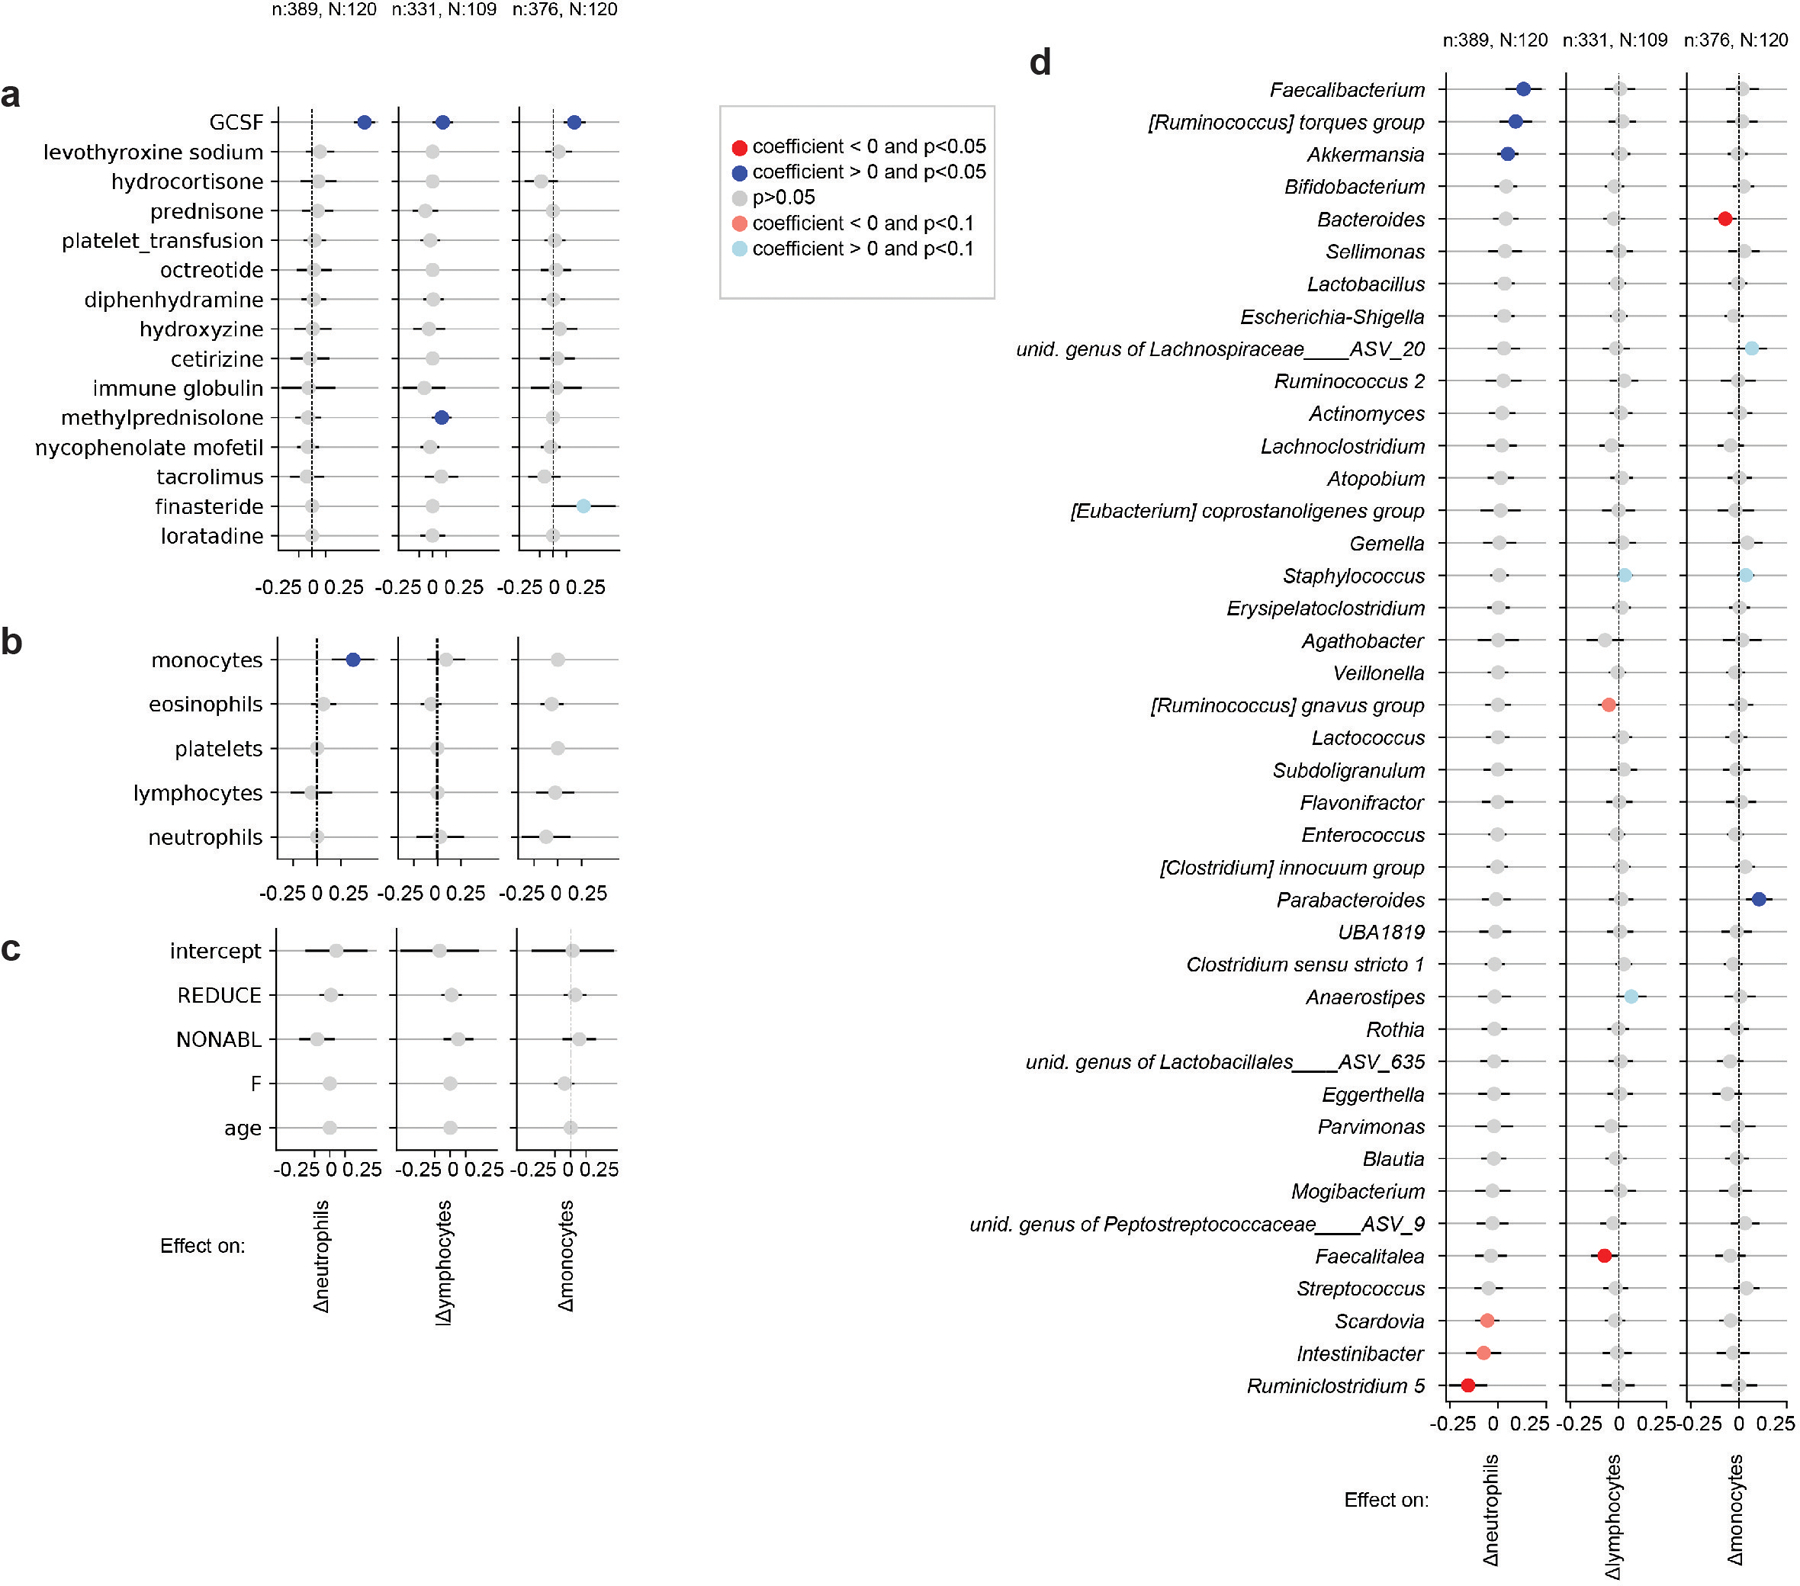
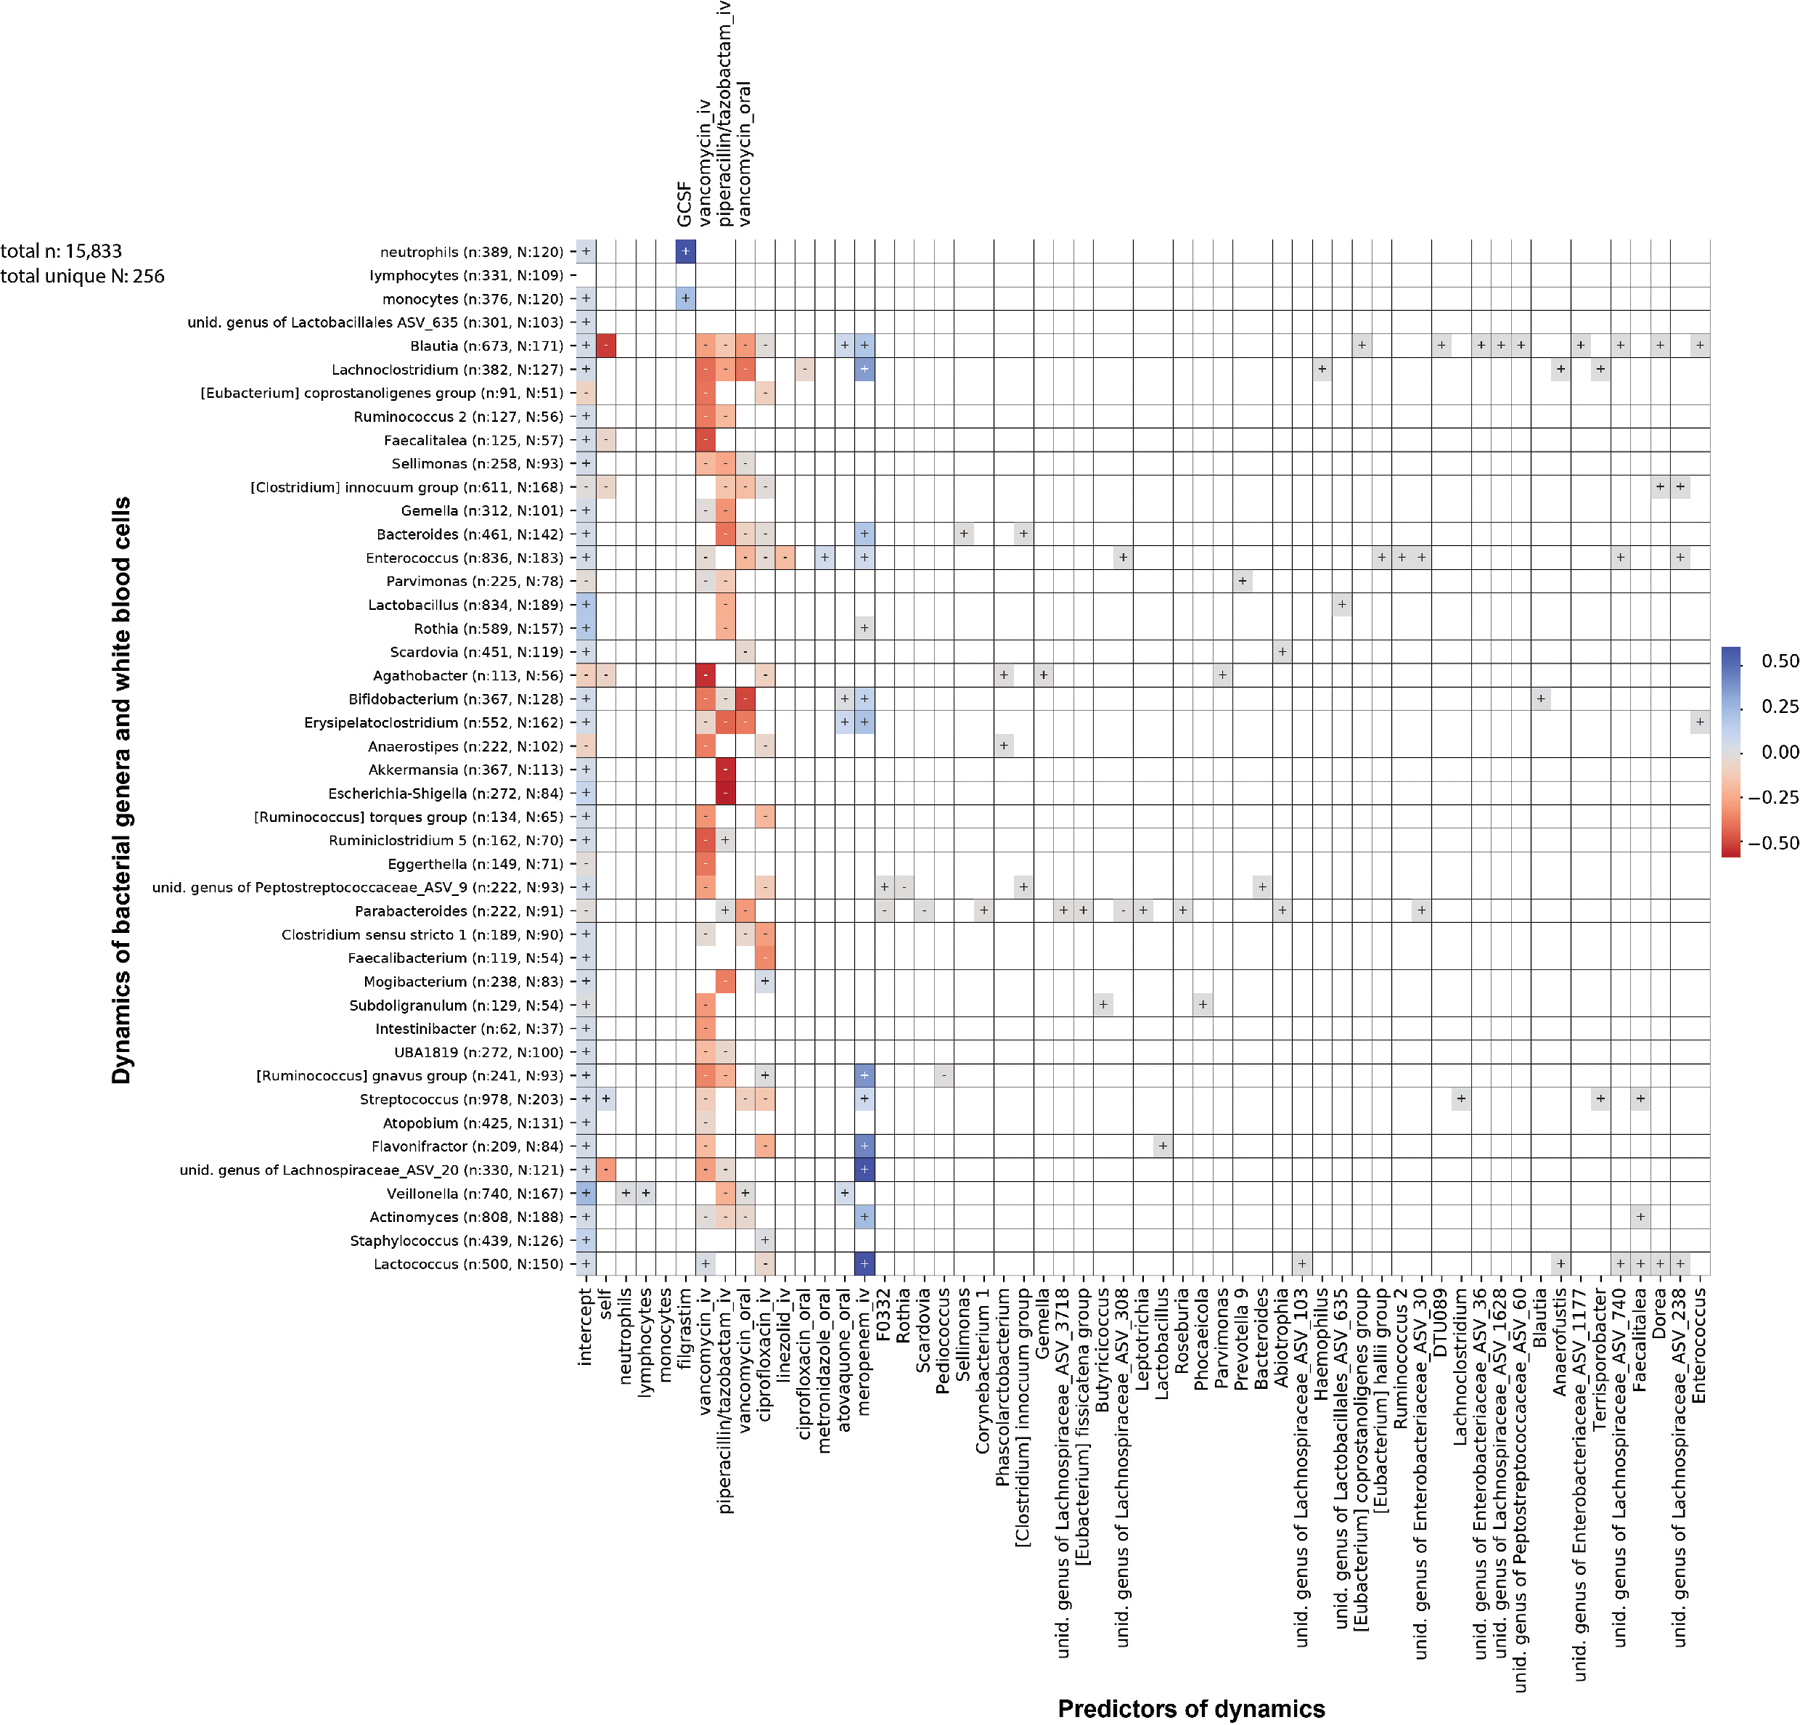
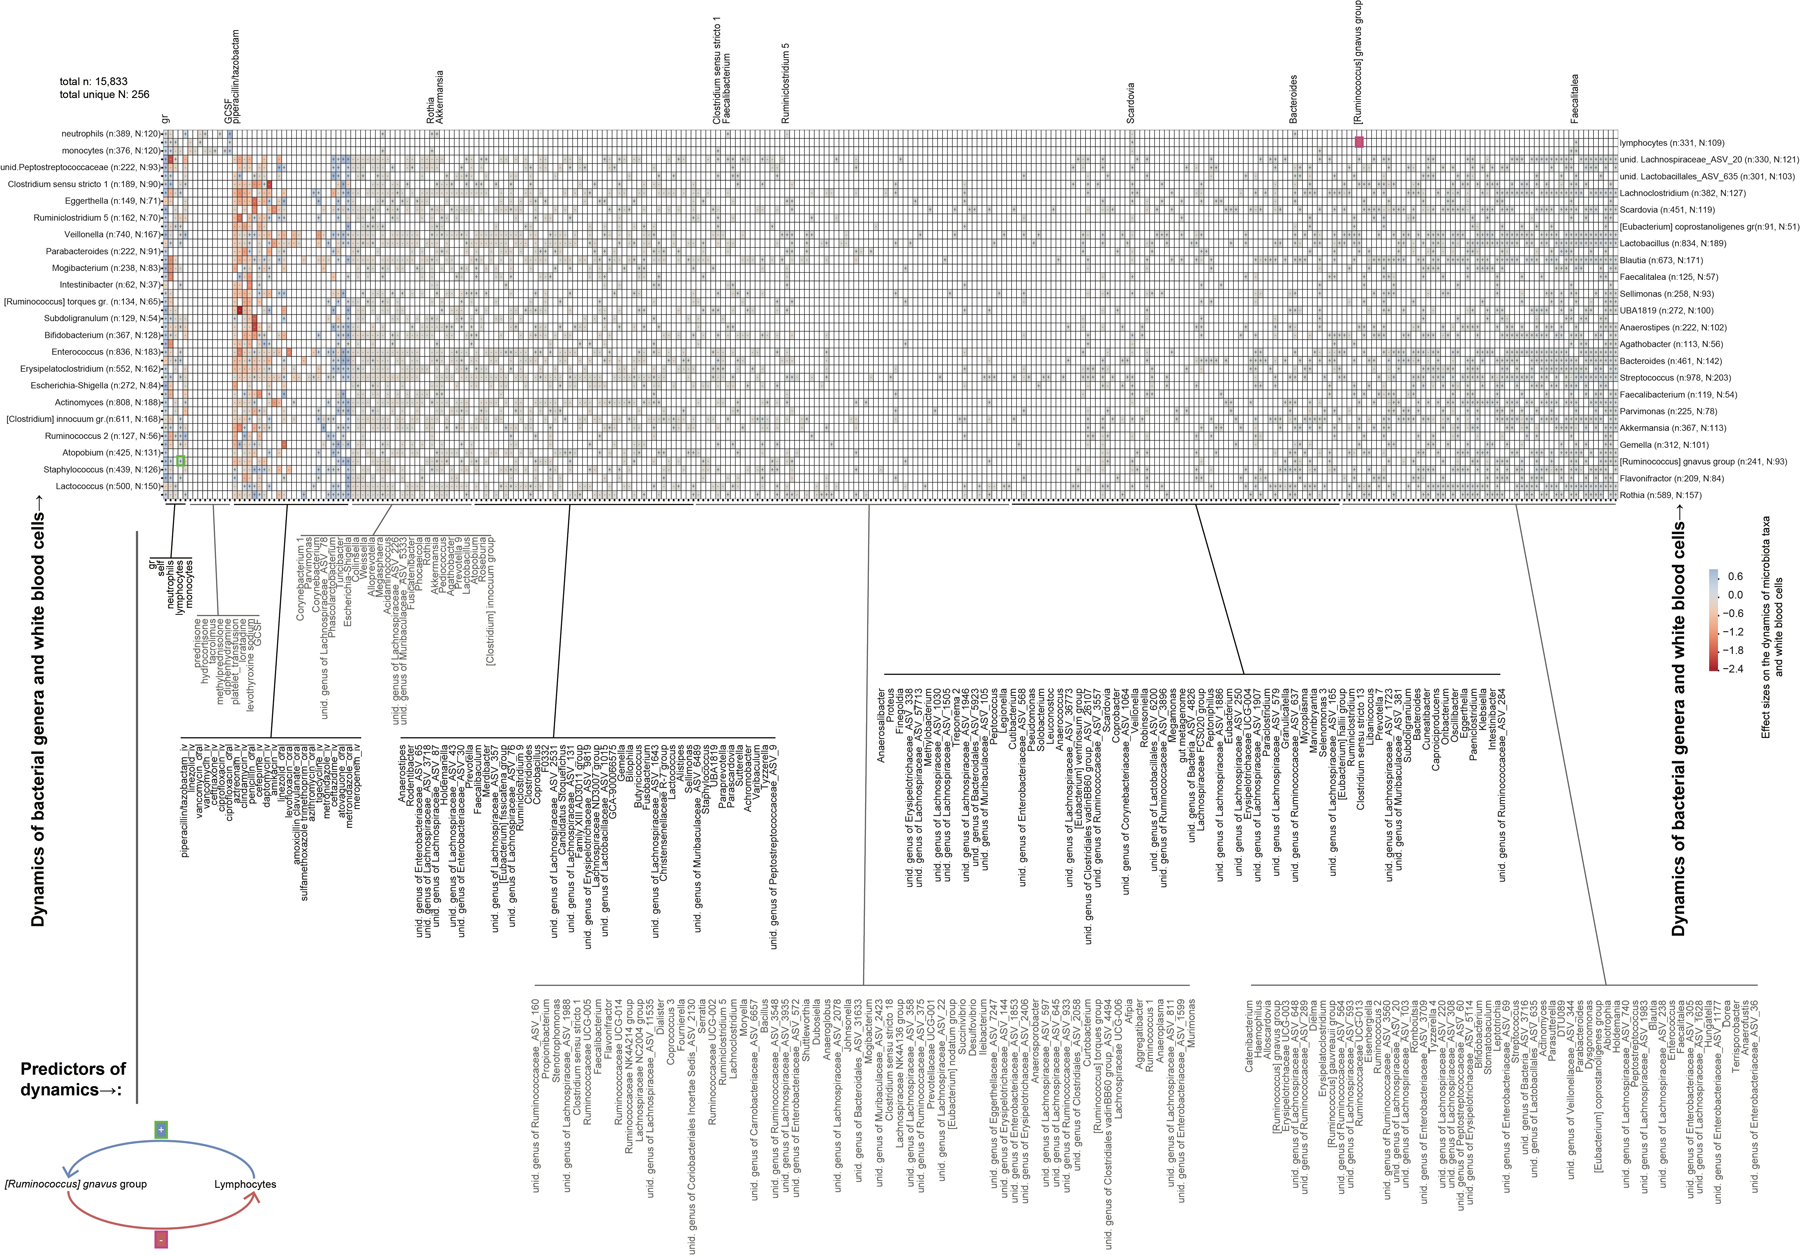
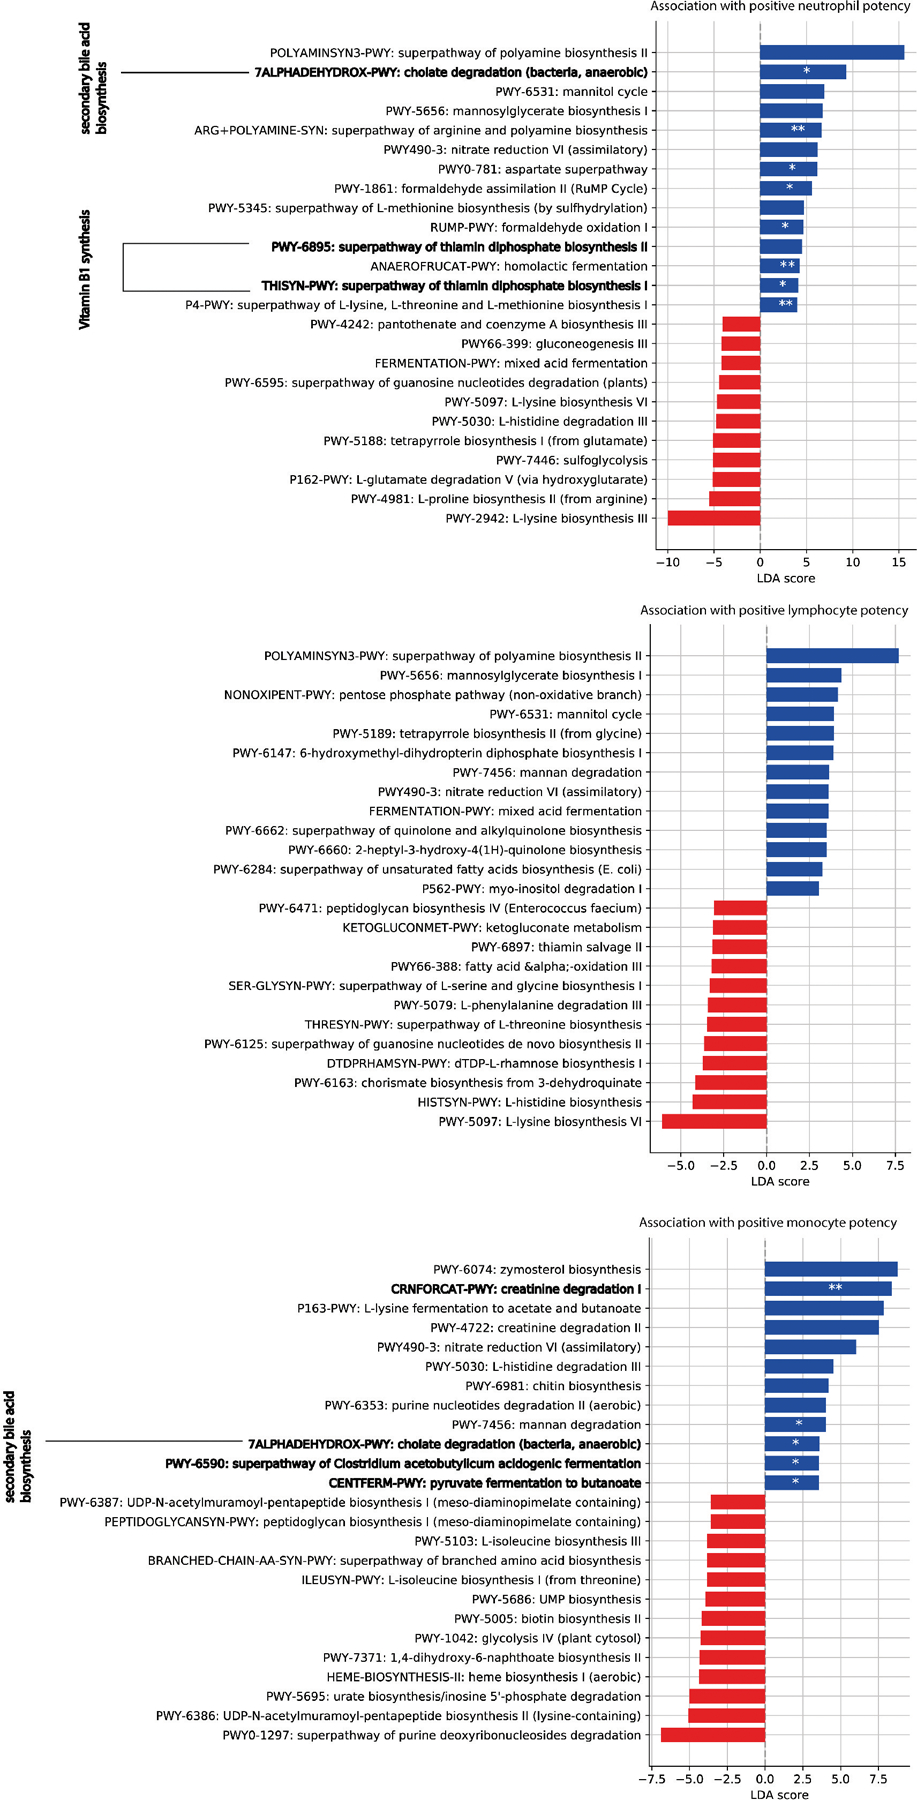
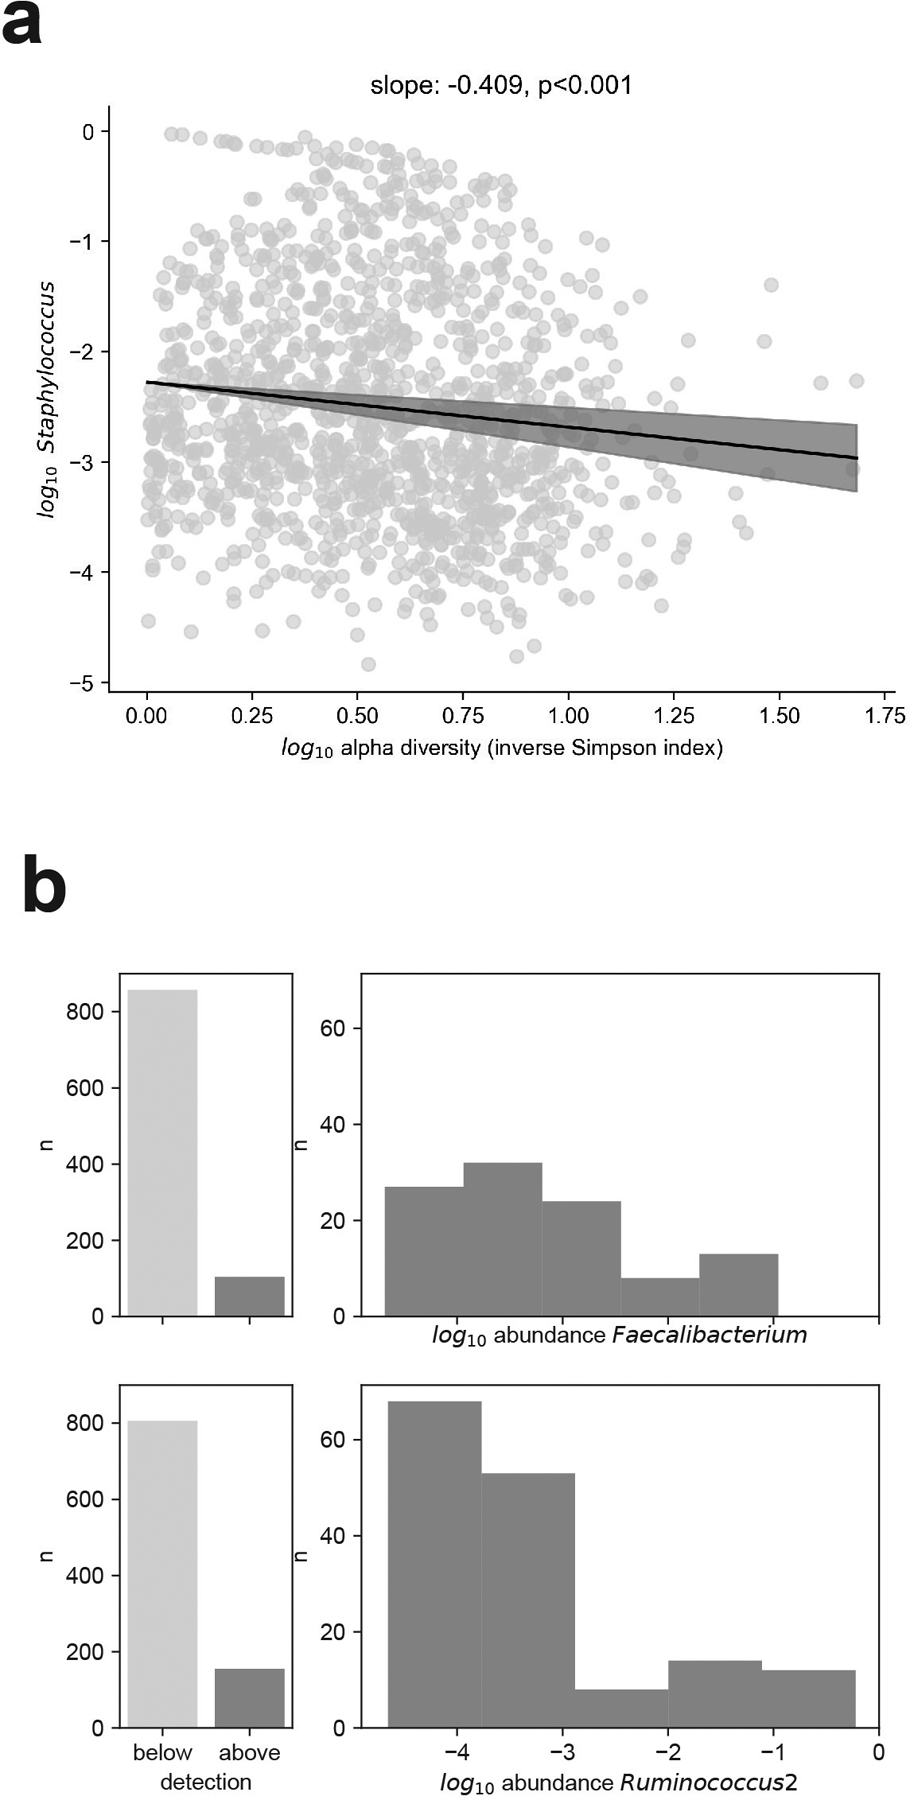
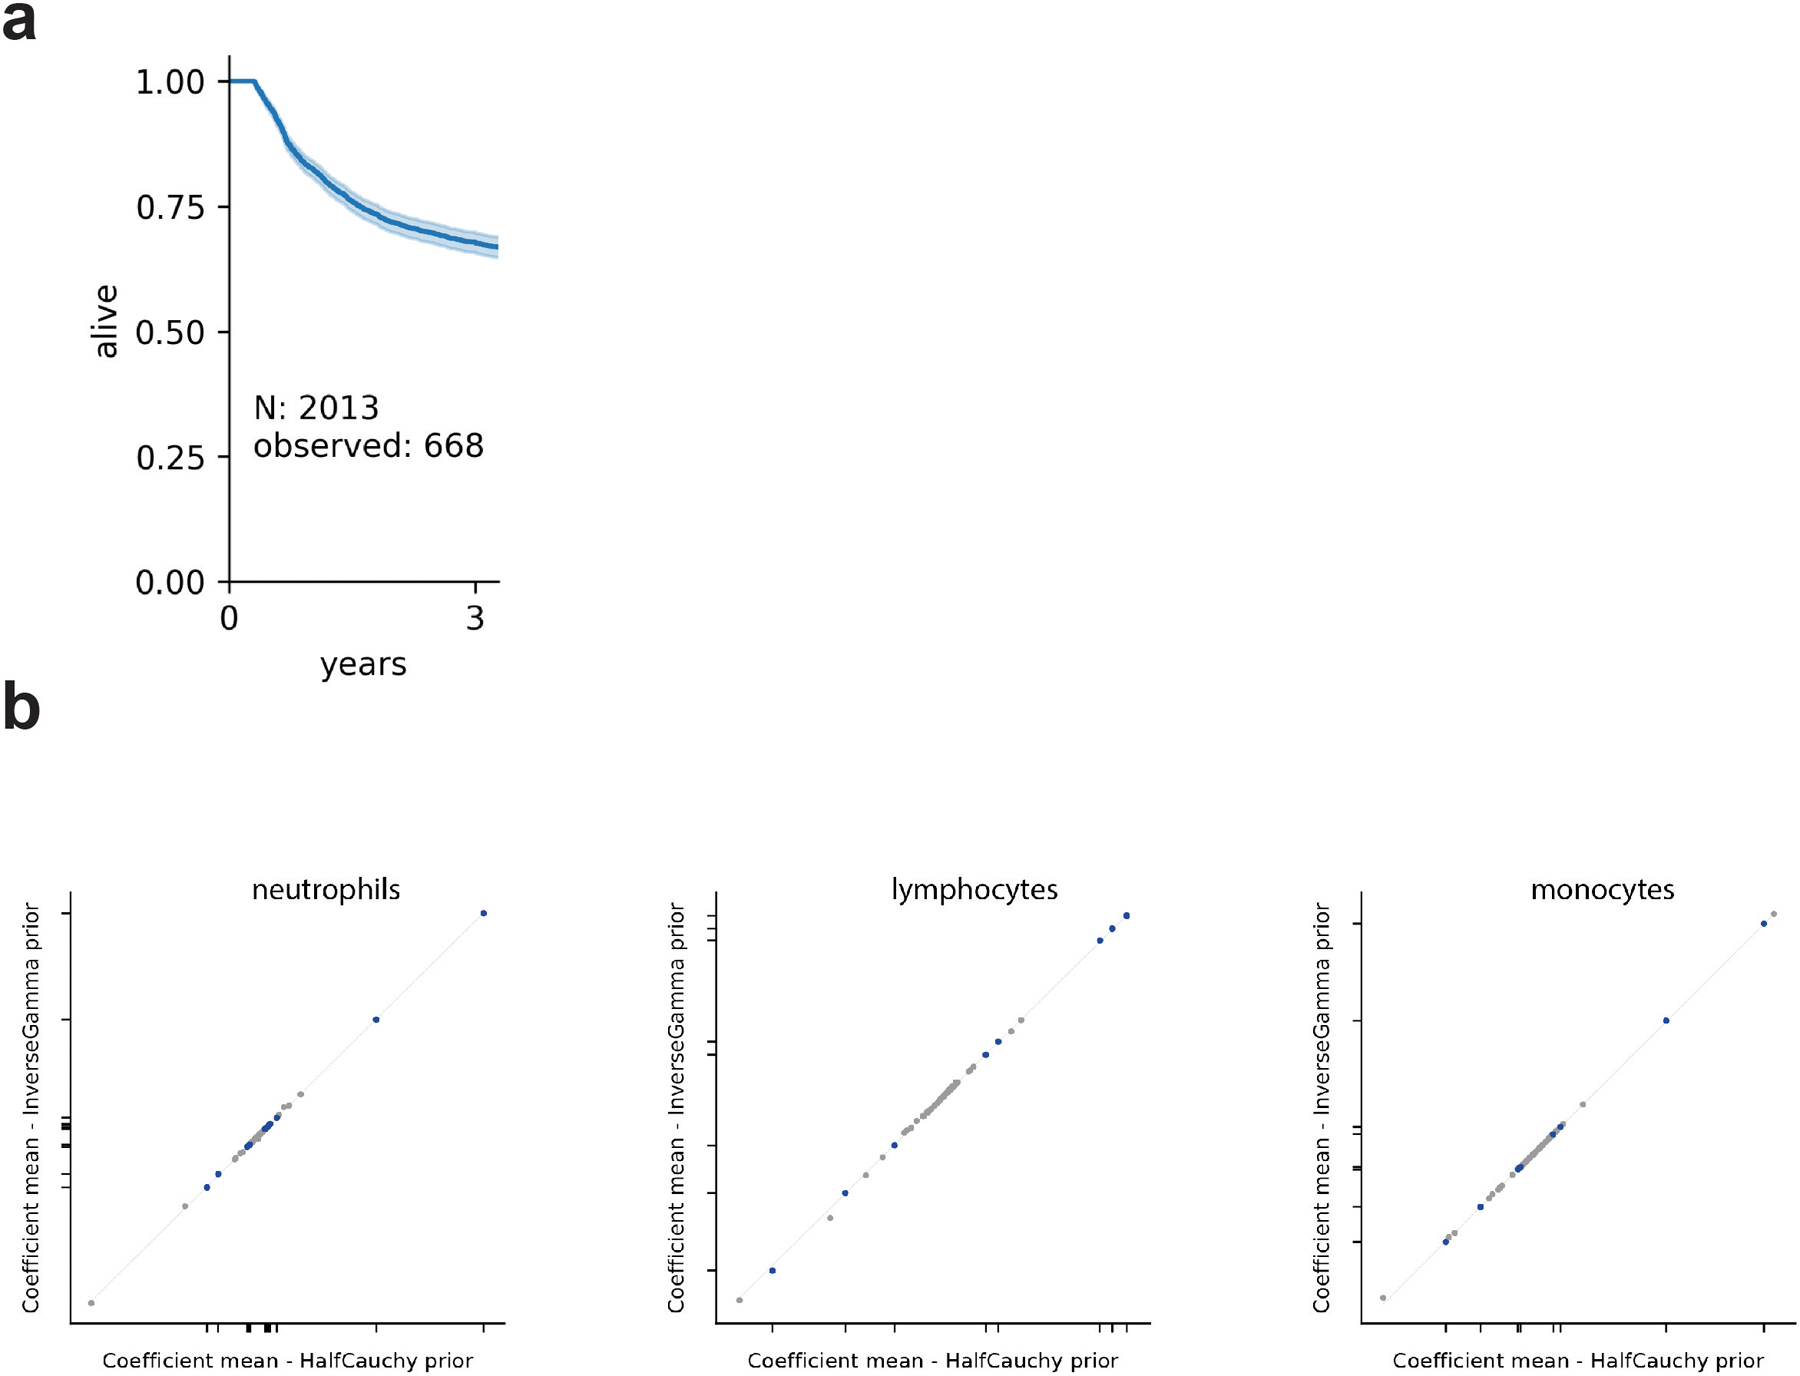
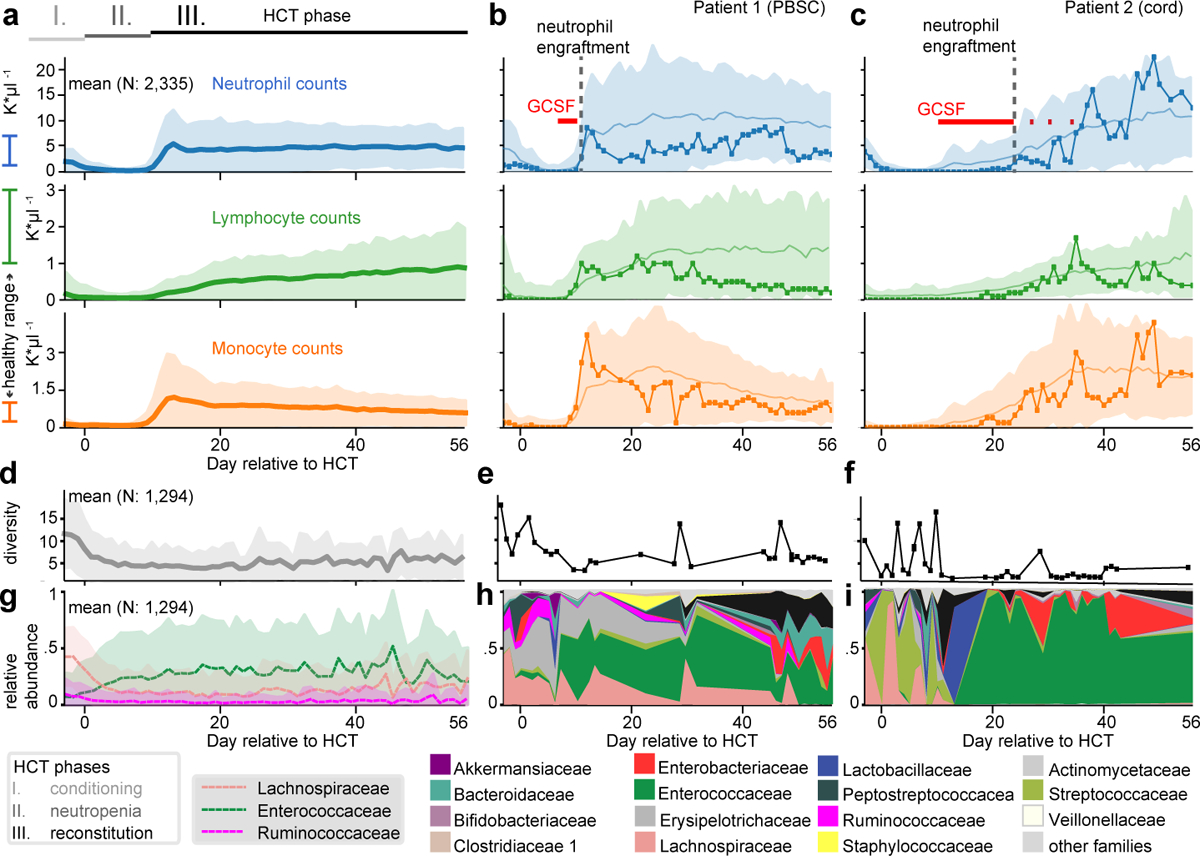
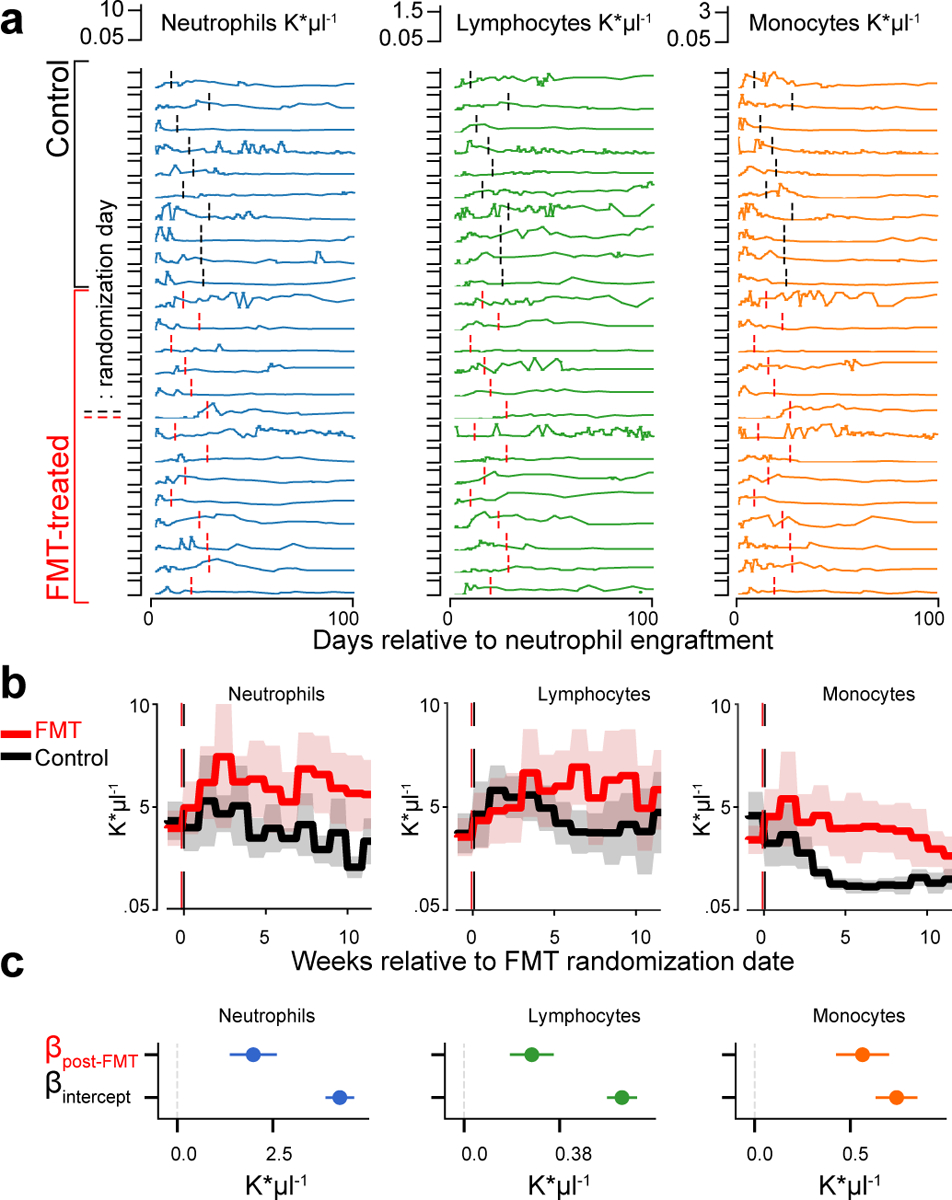
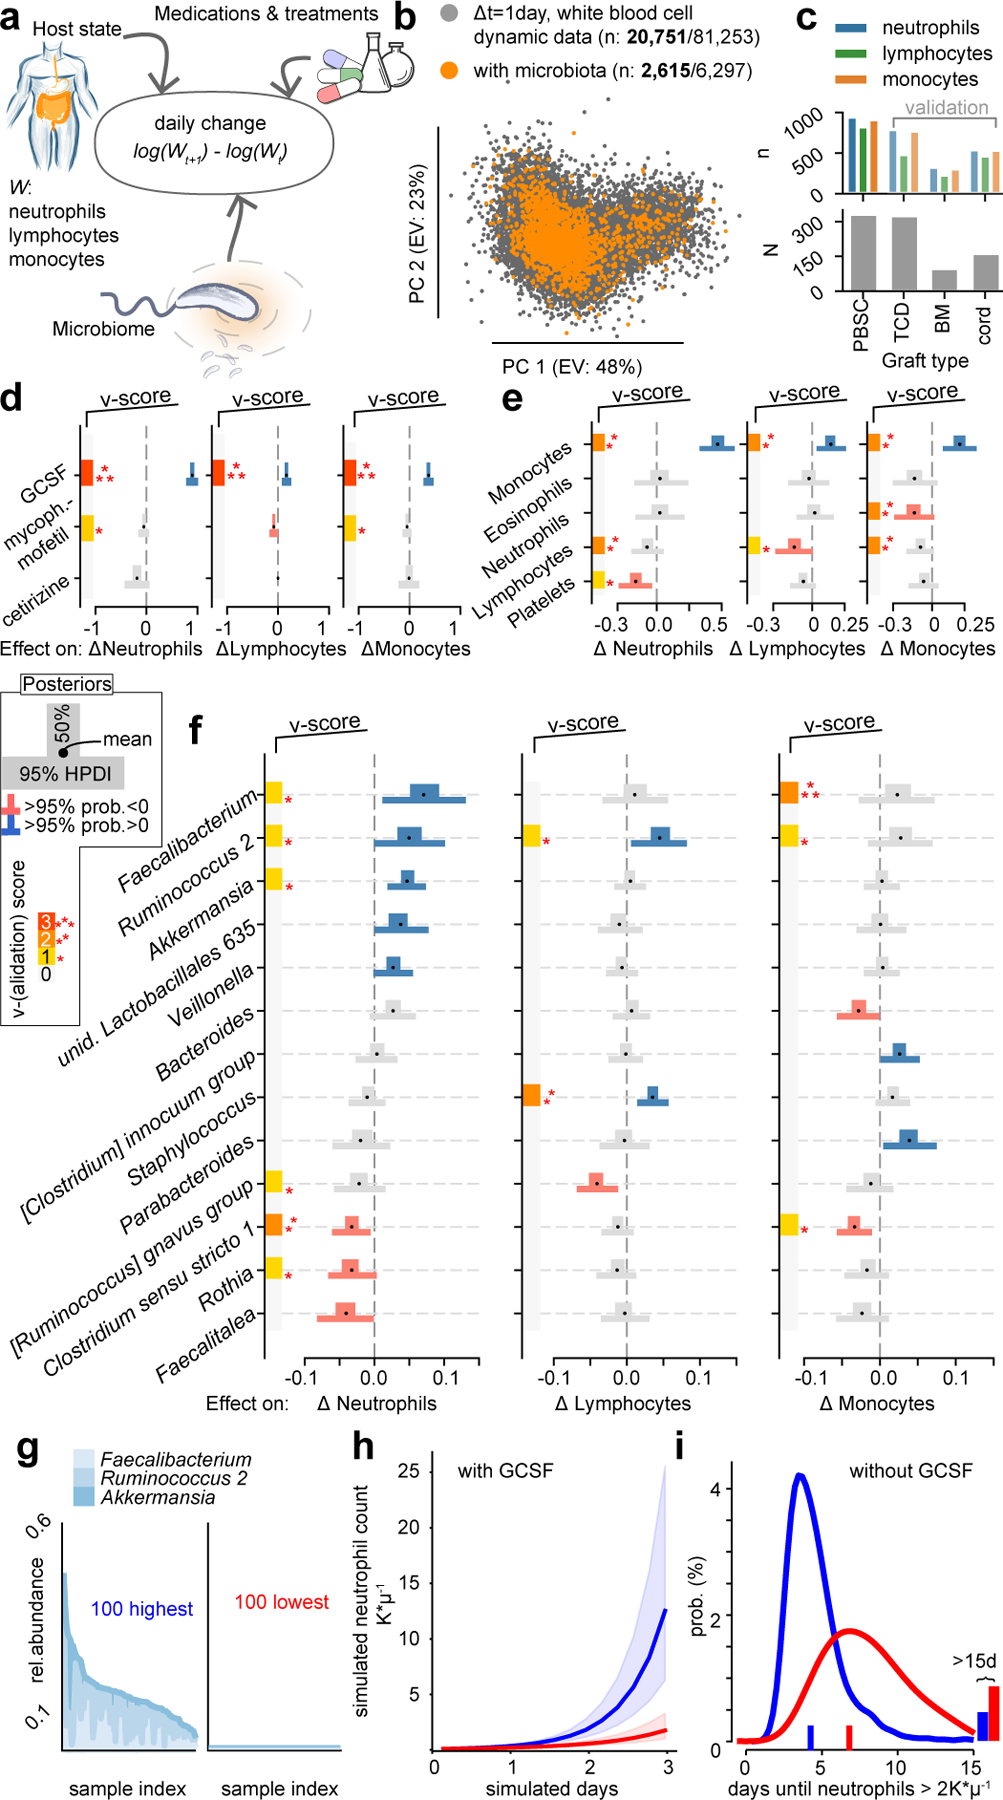
The gut microbiota influences development1-3 and homeostasis4-7 of the mammalian immune system, and is associated with human inflammatory8 and immune diseases9,10 as well as responses to immunotherapy11-14. Nevertheless, our understanding of how gut bacteria modulate the immune system remains limited, particularly in humans, where the difficulty of direct experimentation makes inference challenging. Here we study hundreds of hospitalized-and closely monitored-patients with cancer receiving haematopoietic cell transplantation as they recover from chemotherapy and stem-cell engraftment. This aggressive treatment causes large shifts in both circulatory immune cell and microbiota populations, enabling the relationships between the two to be studied simultaneously. Analysis of observed daily changes in circulating neutrophil, lymphocyte and monocyte counts and more than 10,000 longitudinal microbiota samples revealed consistent associations between gut bacteria and immune cell dynamics. High-resolution clinical metadata and Bayesian inference allowed us to compare the effects of bacterial genera in relation to those of immunomodulatory medications, revealing a considerable influence of the gut microbiota-together and over time-on systemic immune cell dynamics. Our analysis establishes and quantifies the link between the gut microbiota and the human immune system, with implications for microbiota-driven modulation of immunity.


Conflict of interest statement

Competing Interests

MRMvdB and JUP received financial support from Seres Therapeutics. M-AP has received honoraria from AbbVie, Bellicum, Bristol-Myers Squibb, Incyte, Merck, Novartis, Nektar Therapeutics, and Takeda; has received research support for clinical trials from Incyte, Kite (Gilead) and Miltenyi Biotec; and serves on data and safety monitoring boards for Servier and Medigene and scientific advisory boards for MolMed and NexImmune.

Figures

Extended Data Fig. 1:
Extended Data Fig. 1:. Blood cell counts over time.
a, White blood cell counts and platelet counts per graft source over the first 100 days post HCT per day relative to HCT from N=2,235 adult patients (detailed demographics in supplementary table 1); lines: mean, shaded: ± standard deviations. b, data exclusion diagram.
Extended Data Fig. 2:
Extended Data Fig. 2:. FMT increases WBC counts.
a, HCT patient who received an autologous fecal microbiota transplant (auto-FMT, dashed red line) that restored commensal microbial families and ecological diversity in the gut microbiota, with concurrent cell counts of peripheral neutrophils, lymphocytes and monocytes and immunomodulatory drug administrations. b, total white blood cell counts in 24 enrolled patients (10 control, 14 treated) post-neutrophil engraftment; vertical lines indicate randomization dates. c, weekly mean WBC counts aligned to the randomization date (FMT-treated: red, control: black). Line: mean per week, shaded region: 95%-CI. d, coefficient estimates (mean vs. mean + FMT effect) from linear mixed effects models of total WBC counts over time indicate an auto-FMT-induced increase of WBCs (βFMT: p=7×10–14). e, f, g, respectively: neutrophil, lymphocyte and monocyte count trajectories of 24 FMT trial patients. Thin lines: raw data (blue: post-FMT); thick black: mean per day, thick blue: mean+post-FMT coefficient. Means and confidence intervals (shaded region) without (black) and after FMT (blue), as well as the coefficient estimate for FMT treatment and its p-value from a linear mixed effects model relating cell counts over time to the FMT treatment (methods).
Extended Data Fig. 3:
Extended Data Fig. 3:. Results of the feature selection stage 1 regression.
a-c, “Stage 1” regression on neutrophil, lymphocyte, and monocyte dynamics, respectively, on patients without microbiome data. Coefficients from 10-fold cross-validated elastic net regression daily changes in neutrophils. gr: intercept; TCD: T-cell depleted graft (ex-vivo) by CD34+selection; PBSC: peripheral blood stem cells; BM: bone marrow; cord: umbilical cord blood; NONABL: Nonmyeloablative; REDUCE: reduced-intensity conditioning regimen; F: female; N: patients, n: samples (daily changes in neutrophils).
Extended Data Fig. 4:
Extended Data Fig. 4:. Additional coefficients, posterior convergence evaluation and validation.
a-c, Additional posterior coefficient estimates of medications, additional genera and HCT metadata from the Bayesian stage 2 regression, see also Fig. 3. REDUCE: reduced-intensity conditioning regimen; NONABL: non-myeloablative conditioning regimen. F: female. d-f, posterior sampling convergence. Histograms of the ranked posterior draws from the model of neutrophil, lymphocyte and monocyte dynamics, respectively, in PBSC patients (ranked over all chains), plotted separately for each chain show no substantial differences between chains. g-i, Predictors of white blood cell dynamics using data from patients treated at Duke. Heatmaps indicate the slope coefficients from individual univariate regressions of microbiome and clinical predictors with changes in neutrophils, lymphocytes and monocyte, and for comparison the corresponding coefficients signs from the Bayesian multiple linear regressions in stage 2 of the analysis of white blood cell dynamics in MSK patients (Fig. 3). P-values were adjusted for multiple hypothesis testing using Bonferroni correction: ***<0.001, **<0.01, *<0.05; p>0.05: n.s. Sign of coefficients from MSK PBSC patients for comparison. j, equivalent validation analysis from patients treated at Duke using partial least squares regression of microbiome and clinical predictors identified in stage 2 of our analysis on daily changes in neutrophils, lymphocytes and monocyte.
Extended Data Fig. 5:
Extended Data Fig. 5:. Validation using absolute instead of relative abundance bacterial genus data.
a-d Validation analysis of the main model using absolute bacterial abundances as predictors instead of relative abundances in Fig. 3. Results show inferred coefficients and p-values from multiple linear regressions. One regression per analyzed white blood cell type dynamics, i.e. neutrophil, lymphocyte and monocyte daily log-changes, was conducted, and coefficients for medications (A), white blood cell feedbacks (B) metadata (C) and total genus abundances (D) are shown. This was only possible for only a subset of the data used in the main analysis for which we obtained absolute bacterial abundance estimates (methods), n: samples, N: patients.
Extended Data Fig. 6:
Extended Data Fig. 6:. Jointly inferred association network between white blood cell and bacterial genus dynamics (methods).
Strong regularization yields few non-zero coefficients and antibiotics dominate the dynamics.
Extended Data Fig. 7:
Extended Data Fig. 7:. Jointly inferred association network between white blood cell and bacterial genus dynamics with reduced regularization.
Reducing regularization strength (methods) indicates potential bidirectional feedbacks, e.g. between lymphocytes and [Ruminococcus] gnavus group (highlighter green boxes, and cartoon).
Extended Data Fig. 8:
Extended Data Fig. 8:. Functional analysis of microbiota samples.
To distinguish samples predicted to increase rates of white blood cells, a microbiota potency score was calculated from posterior coefficients (Fig. 3, methods) and the relative abundance of taxa in samples. Bars show linear discriminant analysis (LDA) scores of MetaCyc pathway profiles from 124 shotgun sequenced samples that distinguished positive and negative potency samples the most (LDA-score magnitude in the 95th percentile). Highlighted pathways are discussed in the main text. For each pathway, we tested if pathway presence was enriched (depleted) in positive (negative) potency samples using one-sided Fisher’s exact test; p-value <0.001: ***, <0.01:**, <0.05:*.
Extended Data Fig. 9:
Extended Data Fig. 9:. Abundance profiles of bacterial genera across analyzed samples.
a, The relative non-zero abundance of Staphylococcus is inversely related to microbiome alpha diversity, bold line: regression line from a linear model of the mean of the log10 Staphylococcus relative abundance, shaded: 95% confidence intervals (n=1,381 samples with non-zero Staphylococcus abundances). b, c, Abundance profiles of the two genera, Faecalibacterium (b) and Ruminococcus 2 (c), most strongly associated with white blood cell increase; number of times detected (left) and log10 abundance distribution when above detection (right).
Extended Data Fig. 10:
Extended Data Fig. 10:. Survival analysis and confirmation of model results with different priors.
a, Kaplan-Meier plot of patient 3-year survival with sufficient available blood data (Supplementary Information, Extended Data Fig. 1). b, posterior association coefficients do not depend on the choice of prior for σ in the main Bayesian model. Plotted are the posterior means from our main analysis against the equivalent inference with an inverse Gamma prior (alpha=1, beta=1).
Figure 1:
Figure 1:. Immune reconstitution and microbiome dynamics after HCT.
a Major periods of HCT: I) immunoablation during conditioning before HCT on day 0 followed by II) post-HCT neutropenia and III) reconstitution. Mean counts (shaded: ±1 standard deviation, σ) of neutrophils, lymphocytes and monocytes per day relative to HCT from patients transplanted between 2003 and 2019 (a), contrasted with individual patients (b,c) representative of the recovery trajectories for different stem cell graft sources; patient 1 received a PBSC graft and patient 2 received umbilical cord blood (line with circles: patient data, solid line and shaded region: mean±1σ of all PBSC/cord patients, red: GCSF administration). d-f) Loss of microbial diversity during HCT, measured by 16S rRNA gene sequencing of fecal samples, confirming previous smaller studies, (d, line: mean per day, shaded: ±1σ; e,f: individual patients) coincides with loss of g-i commensal families (g, line: mean relative abundances of bacterial families, shaded: ±1σ); h,i: individual patients), often replaced by Enterococcaceae domination.
Figure 2:
Figure 2:. Neutrophil, lymphocyte and monocyte counts increased in FMT-treated patients in weeks following treatment.
a Absolute counts of neutrophils (blue), lymphocytes (green) and monocytes (orange) in 10 control, 14 FMT-treated patients post-neutrophil engraftment; vertical lines indicate randomization dates. b Weekly mean cell counts aligned to the randomization date (FMT-treated: red, control: black). Line: mean per week, shaded region: 95%-CI. c Coefficient estimates from linear mixed effects models of neutrophils, lymphocytes and monocytes over time indicate an auto-FMT-induced increase of each white blood cell type (βFMT: p=4×10⁻¹¹, p=2×10⁻¹⁰, p=2×10⁻¹⁶, respectively, full regression results in SI; b, c: N=24 subjects, n=921 blood samples).
Figure 3:
Figure 3:. Bayesian inference reveals associations between the microbiota and dynamics of circulatory white blood cell counts.
a Cartoon of the model: observed changes in WBC counts between two consecutive days are associated with the current state of the host in the form of blood cell counts in circulation, immunomodulatory medications, clinical metadata, and the state of the microbiome. b Visualization of the data of WBC dynamics; scatter plot of the principal components (PC) of observed daily changes of neutrophils, lymphocytes and monocytes without (grey) and with (orange) available concurrent microbiota samples (bold: post neutrophil-engraftment samples). c PBSC patients (N=312) provided most paired blood dynamics and microbiota samples (n=995); TCD, BM and cord patient data sets were used for validation. d-f Bayesian inference results from PBSC patient data; posterior coefficient distributions of associations between treatments (d), WBC counts (e), and log10-relative abundances of microbial genera (f) and daily changes in neutrophils, lymphocytes and monocytes. v-score: number of validation cohorts confirming associations, set to zero if invalidated by validation cohorts (additional coefficients in Extended Data Fig. 4a–c). g 100 microbiota samples with highest (left) or lowest (right) abundances of Faecalibacterium, Ruminococcus 2 and Akkermansia. h Simulation of neutrophil dynamics in presence of GCSF and microbiota compositions sampled either from those high (blue) or low (red) in Faecalibacterium, Ruminococcus 2 and Akkermansia relative abundance as shown in g); line: median of 1,000 simulations, shaded regions: interquartile range of simulated trajectories. i Time until neutrophil counts first reach >2K*μl−1 in equivalent simulations without GCSF.

Comment in

References

    1. Mazmanian SK, Liu CH, Tzianabos AO & Kasper DL An immunomodulatory molecule of symbiotic bacteria directs maturation of the host immune system. Cell 122, 107–118 (2005). - PubMed
    1. Gomez de Agüero M et al. The maternal microbiota drives early postnatal innate immune development. Science 351, 1296–1302 (2016). - PubMed
    1. Olin A et al. Stereotypic immune system development in newborn children. Cell 174, 1277–1292.e14 (2018). - PMC - PubMed
    1. Tan TG et al. Identifying species of symbiont bacteria from the human gut that, alone, can induce intestinal Th17 cells in mice. Proc. Natl. Acad. Sci. USA 113, E8141–E8150 (2016). - PMC - PubMed
    1. Deshmukh HS et al. The microbiota regulates neutrophil homeostasis and host resistance to Escherichia coli K1 sepsis in neonatal mice. Nat. Med 20, 524–530 (2014). - PMC - PubMed

Publication types