Comparative Study
. 2020 Dec;588(7837):277-283.
doi: 10.1038/s41586-020-2961-x. Epub 2020 Nov 25.

Multiple wheat genomes reveal global variation in modern breeding

Sean Walkowiak #  1   2 Liangliang Gao #  3 Cecile Monat #  4 Georg Haberer  5 Mulualem T Kassa  6 Jemima Brinton  7 Ricardo H Ramirez-Gonzalez  7 Markus C Kolodziej  8 Emily Delorean  3 Dinushika Thambugala  9 Valentyna Klymiuk  1 Brook Byrns  1 Heidrun Gundlach  5 Venkat Bandi  10 Jorge Nunez Siri  10 Kirby Nilsen  1   11 Catharine Aquino  12 Axel Himmelbach  4 Dario Copetti  13   14 Tomohiro Ban  15 Luca Venturini  16 Michael Bevan  7 Bernardo Clavijo  17 Dal-Hoe Koo  3 Jennifer Ens  1 Krystalee Wiebe  1 Amidou N'Diaye  1 Allen K Fritz  3 Carl Gutwin  10 Anne Fiebig  4 Christine Fosker  17 Bin Xiao Fu  2 Gonzalo Garcia Accinelli  17 Keith A Gardner  18 Nick Fradgley  18 Juan Gutierrez-Gonzalez  19 Gwyneth Halstead-Nussloch  13 Masaomi Hatakeyama  12   13 Chu Shin Koh  20 Jasline Deek  21 Alejandro C Costamagna  22 Pierre Fobert  6 Darren Heavens  17 Hiroyuki Kanamori  23 Kanako Kawaura  15 Fuminori Kobayashi  23 Ksenia Krasileva  17 Tony Kuo  24   25 Neil McKenzie  7 Kazuki Murata  26 Yusuke Nabeka  26 Timothy Paape  13 Sudharsan Padmarasu  4 Lawrence Percival-Alwyn  18 Sateesh Kagale  6 Uwe Scholz  4 Jun Sese  25   27 Philomin Juliana  28 Ravi Singh  28 Rie Shimizu-Inatsugi  13 David Swarbreck  17 James Cockram  18 Hikmet Budak  29 Toshiaki Tameshige  15 Tsuyoshi Tanaka  23 Hiroyuki Tsuji  15 Jonathan Wright  17 Jianzhong Wu  23 Burkhard Steuernagel  7 Ian Small  30 Sylvie Cloutier  31 Gabriel Keeble-Gagnère  32 Gary Muehlbauer  19 Josquin Tibbets  32 Shuhei Nasuda  26 Joanna Melonek  30 Pierre J Hucl  1 Andrew G Sharpe  20 Matthew Clark  16 Erik Legg  33 Arvind Bharti  33 Peter Langridge  34 Anthony Hall  17 Cristobal Uauy  7 Martin Mascher  4   35 Simon G Krattinger  8   36 Hirokazu Handa  23   37 Kentaro K Shimizu  13   15 Assaf Distelfeld  38 Ken Chalmers  34 Beat Keller  8 Klaus F X Mayer  5   39 Jesse Poland  3 Nils Stein  4   40 Curt A McCartney  41 Manuel Spannagl  42 Thomas Wicker  43 Curtis J Pozniak  44
Affiliations
Comparative Study

Multiple wheat genomes reveal global variation in modern breeding

Sean Walkowiak et al. Nature. 2020 Dec.

Abstract

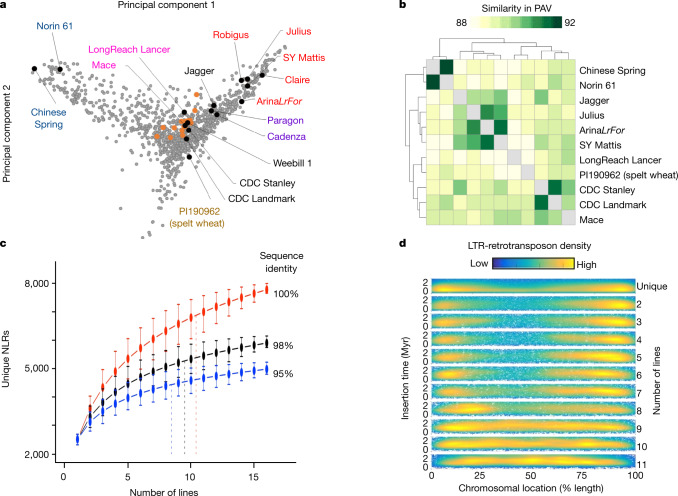
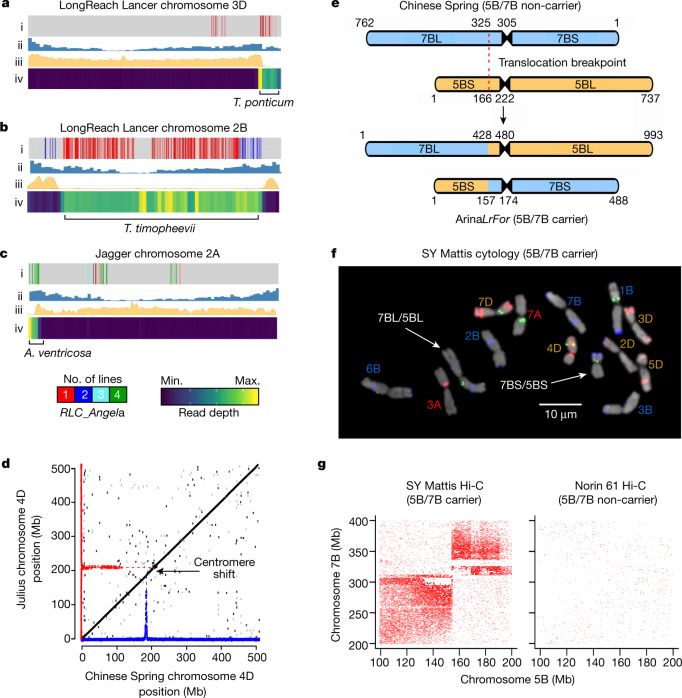
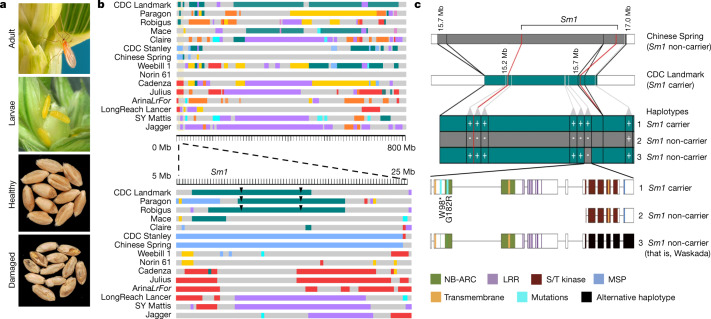
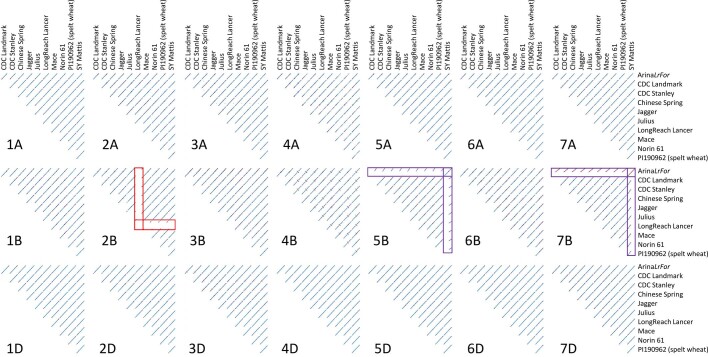
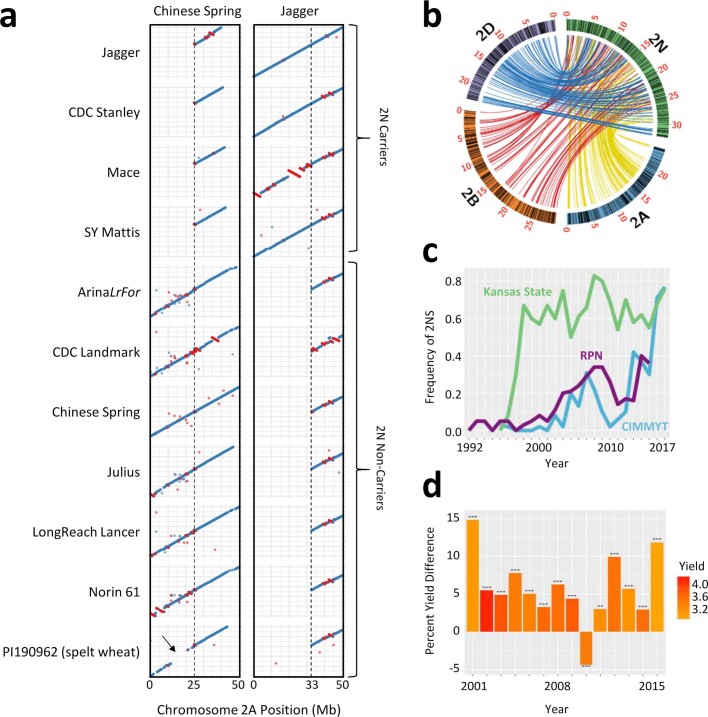
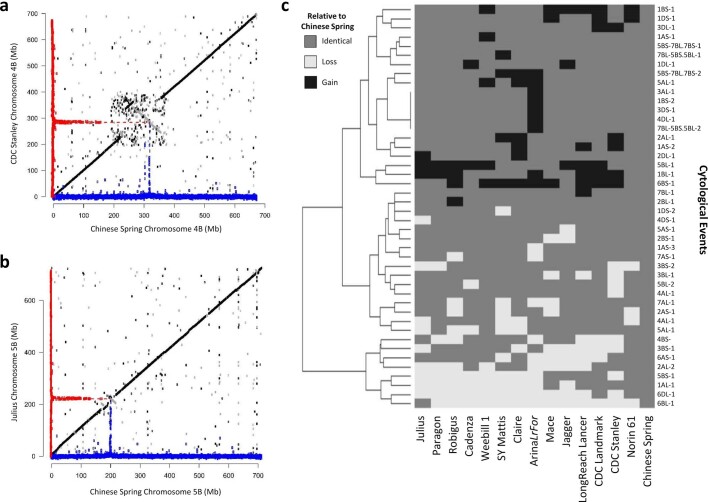
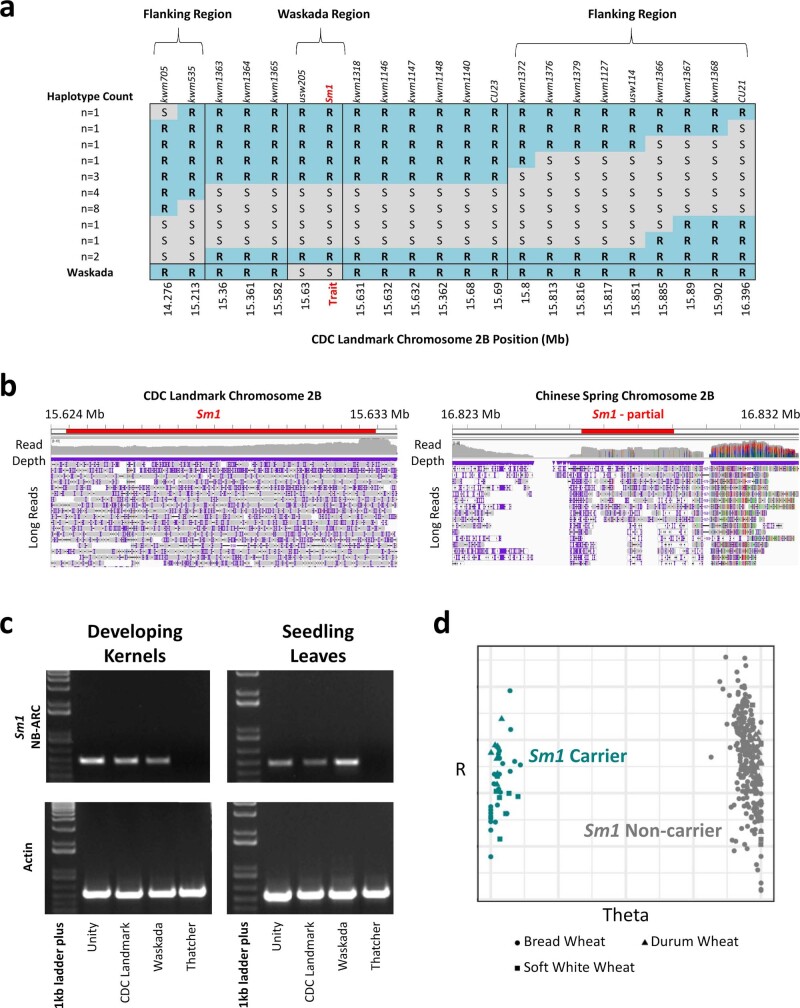
Advances in genomics have expedited the improvement of several agriculturally important crops but similar efforts in wheat (Triticum spp.) have been more challenging. This is largely owing to the size and complexity of the wheat genome1, and the lack of genome-assembly data for multiple wheat lines2,3. Here we generated ten chromosome pseudomolecule and five scaffold assemblies of hexaploid wheat to explore the genomic diversity among wheat lines from global breeding programs. Comparative analysis revealed extensive structural rearrangements, introgressions from wild relatives and differences in gene content resulting from complex breeding histories aimed at improving adaptation to diverse environments, grain yield and quality, and resistance to stresses4,5. We provide examples outlining the utility of these genomes, including a detailed multi-genome-derived nucleotide-binding leucine-rich repeat protein repertoire involved in disease resistance and the characterization of Sm16, a gene associated with insect resistance. These genome assemblies will provide a basis for functional gene discovery and breeding to deliver the next generation of modern wheat cultivars.


Conflict of interest statement

The authors declare no competing interests.

Figures

Fig. 1
Fig. 1. Patterns of variation in the wheat genome.
a, Principal component analysis of polymorphisms from exome-capture sequencing of about 1,200 lines (grey markers), 16 lines from whole-genome shotgun resequencing (orange markers) and our new assemblies (black markers). Text colours reflect different geographical locations and winter or spring growth. b, Dendrogram of pairwise Jaccard similarities for gene PAV between all RQA assemblies. c, Number of unique NLRs at different per cent identity cut-offs as the number of genomes increases. Dashed vertical lines represent 90% of the NLR complement. Markers indicate the mean values of all permutations of the order of adding genomes. Whiskers show maximum and minimum values based on one million random permutations. d, Chromosomal location versus insertion age distribution of unique to (reading downward) increasingly shared syntenic full-length LTR retrotransposons.
Fig. 2
Fig. 2. Introgressions and large-scale structural variation in wheat.
ac, T. ponticum introgression on chromosome 3D in LongReach Lancer (a), T. timopheevi introgression on chromosome 2B in LongReach Lancer (b) and A. ventricosa introgression on chromosome 3D in Jagger (c). Track i, map of polymorphic RLC-Angela retrotransposon insertions (legend at bottom); track ii, density of projected gene annotations from Chinese Spring (blue bars, scaled to maximum value); track iii, per cent identity to Chinese Spring based on chromosome alignment (yellow; scale is 0–100%); track iv, read depth of wheat wild relatives (blue–yellow heat map; legend at bottom). d, Dot plot alignment showing chromosome-level collinearity (black) with relative density of CENH3 ChIP–seq mapped to 100-kb bins for Chinese Spring (blue) and Julius (red); the arrow indicates a centromere shift. e, Robertsonian translocation between chromosomes 5B and 7B in ArinaLrFor. f, g, Cytology (f) and Hi-C (g) confirm the 5B/7B translocation in SY Mattis (left) compared with the non-carrier Norin 61 (right). In f, five independent cells were observed; the translocation was confirmed independently ten times. Scale bar, 10 μm.
Fig. 3
Fig. 3. Cloning of the gene Sm1.
a, The orange wheat blossom midge oviposits eggs on wheat spikes and the larvae feed on developing wheat grains, resulting in moderate to severe damage to mature kernels. b, Top, sections of chromosome 2B of the same colour in the same position share haplotypes (based on 5-Mb bins), with the exception of those in grey, which indicates a line-specific haplotype. The position of Sm1 is indicated with respect to the CDC Landmark assembly. Bottom, zoomed-in view of haplotype blocks (based on 250-kb bins) from 5 to 25 Mb positions on chromosome 2B, surrounding Sm1. CDC Landmark, Robigus and Paragon all carry the same haplotype surrounding Sm1 (teal). c, Top, anchoring of the Sm1 fine map to the physical maps of Chinese Spring and CDC Landmark and graphical genotypes of three haplotypes critical to localizing the Sm1 candidate gene. Bottom, annotation of the Sm1 candidate gene, which encodes NB-ARC and LRR motifs in addition to the integrated serine/threonine (S/T) kinase and MSP domains. Two independent ethyl-methanesulfonate-induced mutations (W98* and G182R) result in loss of function and susceptibility to the orange wheat blossom midge (light blue lines). An alternative haplotype was observed in the kinase region of Waskada (black).
Extended Data Fig. 1
Extended Data Fig. 1. Chromosome-scale collinearity between the RQA.
Genomes were aligned chromosome by chromosome using MUMmer and are represented as dot plots. The introgression on chromosome 2B of LongReach Lancer (red rectangles) and 5B/7B translocation in SY Mattis and ArinaLrFor (purple rectangles) are indicated.
Extended Data Fig. 2
Extended Data Fig. 2. Evaluation of the CDC Landmark RQA using Oxford Nanopore Long Reads.
a, Scaffold-scaffold long read contact map showing shared read IDs between scaffold ends along the ordered scaffolds in the CDC Landmark pseudomolecules. The diagonal pattern indicates that adjacent scaffolds share the same long reads and are therefore properly ordered and oriented by Hi-C in the RQA. b, Characterization of inversion events on chromosomes 2A, 3A, and 3D. The directionality biases estimated from alignments of Hi-C data against Chinese Spring (left, top), and chromosome alignment of the inversion events between CDC Landmark and Chinese Spring RQAs (left, bottom) are shown. Long reads spanning the inversion events and magnified views of the reads aligning to the left and right boundaries of the inversions (right) are provided.
Extended Data Fig. 3
Extended Data Fig. 3. Diversity of genes and TEs.
a, Average pairwise genetic diversity of the homeologues (coding sequences only) of the A, B and D subgenomes. The mode of the A, B and D subgenome is 0.00057, 0.00082, and 0.0002, respectively. b, Tajima’s D estimates of coding sequences for each wheat subgenome. The lower and upper range of the boxplot hinges correspond to the first and third quartiles (the 25th and 75th percentiles). Boxplots show centre line, median; box limits, upper and lower quartiles; whiskers, 1.5 × interquartile range. c, Total gene counts and orthologues for the RQA. Genes in orthologous groups with exactly one gene for each line (Complete; dark brown), genes contained in unambiguous orthologous groups missing an orthologue for at least one line, that is, PAV (2-10 Lines; light brown), and genes with ambiguous orthologues or CNV (Other; pink) are indicated. d, Per cent of pairwise shared syntenic fl-LTRs between wheat lines.
Extended Data Fig. 4
Extended Data Fig. 4. Evolutionary relationships among PPR and mTERF gene sequences.
a, The RFL clade is in blue and all remaining P-class PPRs are in green. b, Clustered mTERF sequences are in blue and the remaining mTERFs are shown in green. The scale bar represents number of substitutions per site. c, Sequence inversions and copy number variation at the Rf3 locus on chromosome 1B. RFL genes are shown as light pink triangles above the chromosome scale. Conserved non-PPR genes used as syntenic anchors are shown on the chromosome scale as coloured triangles. The total number (T) and the number of putatively functional RFL genes with 10 or more PPR motifs (F) are indicated on the right side of each panel.
Extended Data Fig. 5
Extended Data Fig. 5. Identification of alien introgressions from wheat relatives.
A feature of foreign chromosomal introgressions is that they contain unique patterns of TE insertions. Shown are stretches of >20 Mb containing multiple polymorphic RLC-Angela retrotransposons that are found only in one or a few (≤4) of the sequenced lines. One representative chromosome for each wheat subgenome is shown. Individual polymorphic retrotransposons are indicated as coloured vertical lines. Colours correspond to the number of cultivars a foreign segment is found in. Regions of particular interest are indicated by black rectangles. These include the 2NvS alien introgression from A. ventricosa at the end of chromosome 2A in Jagger, Mace, SY Mattis and CDC Stanley, as well as introgression in the central region of chromosome 2B from T. timopheevi in LongReach Lancer, and introgression at the end of chromosome 3D from T. ponticum in LongReach Lancer.
Extended Data Fig. 6
Extended Data Fig. 6. Detailed characterization of the 2NvS introgression from A. ventricosa.
a, Pairwise alignments of the first 50 Mb of chromosome 2A. The black arrow indicates a possible unique haplotype within spelt. b, Orthologous genes between the 2NvS introgression from A. ventricosa in Jagger and the genes on chromosomes 2A, 2B, and 2D in Chinese Spring. c, Frequency of 2NvS introgression carriers in North American datasets from CIMMYT, Kansas State, and the USDA Winter Wheat Regional Performance Nursery (RPN) over time. d, Per cent yield difference in lines that carry the 2NvS introgression. Two sided t-tests were performed to test for the significance of the impact of the 2NvS introgression. **P < 0.01; ***P < 0.001.
Extended Data Fig. 7
Extended Data Fig. 7. Centromere positions and karyotype variation.
Functional centromere positions in the RQA have undergone structural and positional rearrangement. Chromosome alignments showing collinearity (black scaffolds in same orientation, grey scaffolds in opposite orientation) with relative density of CENH3 ChIP–seq mapped to 100 kb genomic bins for Chinese Spring (blue) and a representative genome of comparison (red) for chromosome 4B of CDC Stanley (a), and chromosome 5B of Julius (b). c, Detailed list and clustering of cytological features carried by each wheat line (Supplementary Note 6). Features that are identical (dark grey) or have a gain (black) or loss (light grey) relative to Chinese Spring are indicated.
Extended Data Fig. 8
Extended Data Fig. 8. Hi-C validates inversions identified from pairwise chromosome alignments.
Pairwise alignments of chromosome 6B from the RQA and Chinese Spring are shown. Above each alignment dot plot, the directionality biases estimated from alignments of Hi-C data against Chinese Spring are shown. Boundaries of diagonal segments are indicative of inversions and coincide with inversion boundaries identified from the chromosome alignments.
Extended Data Fig. 9
Extended Data Fig. 9. Characterization of a translocation involving wheat chromosomes 5B and 7B.
a, Cytogenetic karyotypes of Forno (left) and Arina (right), the parents of ArinaLrFor. Note that the large recombinant chromosome 7B is represented by a distinct peak. b, Sequence of the translocation breakpoint on chromosome 7B of ArinaLrFor. Note that the exact breakpoint lies in a sequence gap (stretch of Ns). The bp positions are indicated at the left. Forward PCR primers are shown in red and reverse primers in blue. The overlap of the two reverse primers is shown in purple. The outer primer pair was used for PCR, while the inner pair was used for a nested PCR. c, PCR amplification of the fragment spanning the translocation breakpoint. The nested PCR yielded a ~5 kb fragment that spanned the translocation breakpoint and its identity was confirmed by sequencing. Both PCR and nested PCR were performed in duplicate; both replicates of the nested PCR were sequenced using the Sanger method. For gel source data, see Supplementary Fig. 1. d, Mapping of Illumina reads from the cultivars Arina and Forno on to the pseudomolecules of ArinaLrFor. Sequence derived from Forno is shown in blue, while sequenced derived from Arina is in red. Note that chromosomes 5B and 7B are derived from both parents, indicating that these parental chromosomes can recombine freely, despite the presence of a large 5B/7B translocation in Arina.
Extended Data Fig. 10
Extended Data Fig. 10. Confirmation of gene expression and gene structure for Sm1.
a, Critical recombinants from the 99B60-EJ2G/Infinity and 99B60-EJ2D/Thatcher populations used to fine map Sm1. The 99B60-EJ2G/Infinity cross had 5,170 F2 plants, while 99B60-EJ2D/Thatcher cross had 5,264 F2 plants; only recombinant haplotypes between orange wheat blossom midge resistant (R) and susceptible (S) genotypes are shown. b, Oxford Nanopore long read confirmation of the Sm1 gene candidate in the CDC Landmark RQA (left), and alternative haplotype in Chinese Spring (right). Vertical coloured lines indicate sequence variants. c, Amplification of cDNA for the NB-ARC domain of the Sm1 gene candidate (top) and actin control (bottom) derived from RNA isolated from developing kernels (left) and wheat seedlings (right). Unity and CDC Landmark are carriers of Sm1. Waskada carries an alternative haplotype and does not carry Sm1 (see main text). Thatcher was used as a susceptible parent for fine mapping of Sm1 and does not contain the associated NB-ARC domain. The experiment was replicated on four independent biological samples for each condition. d, Distribution of an Sm1 allele-specific PCR marker in a diverse panel of >300 wheat lines.

References

    1. The International Wheat Genome Sequencing Consortium Shifting the limits in wheat research and breeding using a fully annotated reference genome. Science. 2018;361:eaar7191. - PubMed
    1. Montenegro JD, et al. The pangenome of hexaploid bread wheat. Plant J. 2017;90:1007–1013. - PubMed
    1. International Wheat Genome Sequencing Consortium (IWGSC) A chromosome-based draft sequence of the hexaploid bread wheat (Triticum aestivum) genome. Science. 2014;345:1251788. - PubMed
    1. He F, et al. Exome sequencing highlights the role of wild-relative introgression in shaping the adaptive landscape of the wheat genome. Nat. Genet. 2019;51:1194–1194. - PubMed
    1. Pont C, et al. Tracing the ancestry of modern bread wheats. Nat. Genet. 2019;51:905–911. - PubMed

Publication types

MeSH terms