. 2020 Nov 10:14:475948.
doi: 10.3389/fnsys.2020.475948. eCollection 2020.

Cerebellar Cortex 4-12 Hz Oscillations and Unit Phase Relation in the Awake Rat

Affiliations

Cerebellar Cortex 4-12 Hz Oscillations and Unit Phase Relation in the Awake Rat

Maxime Lévesque et al. Front Syst Neurosci. .

Abstract

Oscillations in the granule cell layer (GCL) of the cerebellar cortex have been related to behavior and could facilitate communication with the cerebral cortex. These local field potential (LFP) oscillations, strong at 4-12 Hz in the rodent cerebellar cortex during awake immobility, should also be an indicator of an underlying influence on the patterns of the cerebellar cortex neuronal firing during rest. To address this hypothesis, cerebellar cortex LFPs and simultaneous single-neuron activity were collected during LFP oscillatory periods in the GCL of awake resting rats. During these oscillatory episodes, different types of units across the GCL and Purkinje cell layers showed variable phase-relation with the oscillatory cycles. Overall, 74% of the Golgi cell firing and 54% of the Purkinje cell simple spike (SS) firing were phase-locked with the oscillations, displaying a clear phase relationship. Despite this tendency, fewer Golgi cells (50%) and Purkinje cell's SSs (25%) showed an oscillatory firing pattern. Oscillatory phase-locked spikes for the Golgi and Purkinje cells occurred towards the peak of the LFP cycle. GCL LFP oscillations had a strong capacity to predict the timing of Golgi cell spiking activity, indicating a strong influence of this oscillatory phenomenon over the GCL. Phase-locking was not as prominent for the Purkinje cell SS firing, indicating a weaker influence over the Purkinje cell layer, yet a similar phase relation. Overall, synaptic activity underlying GCL LFP oscillations likely exert an influence on neuronal population firing patterns in the cerebellar cortex in the awake resting state and could have a preparatory neural network shaping capacity serving as a neural baseline for upcoming cerebellar operations.

Keywords: cerebellum; network; oscillation; phase-locking; rhythmicity.


Figures

Figure 1
Figure 1
Local field potential (LFP) 4–12 Hz granule cell layer (GCL) oscillations recorded in the posterior lobe of the awake rat. (A) GCL activity recorded at three different sites (three LFP traces, LFP1, 2, and 3), with corresponding single unit Golgi spike train recorded at the same site as LFP1. Notice the relative similarity between LFP1 and LFP2, with LFP3 being relatively different. Also, notice the in-phase spiking for the spike trace relative to LFP1. (B) Power spectral density results for each LFP shown in panel (A). (C) Lesion made in the paramedian lobule GCL, at the site of recording for LFP1, with the relative localization of the LFP2 recording site. Inset: Magnification (2.5×) of the lesion site.
Figure 2
Figure 2
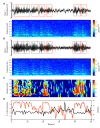
LFP oscillations at 4–12 Hz in the cerebellar cortex GCL show variable coherence patterns across time. Simultaneous GCL LFP recordings from two microelectrodes distanced ~3 mm (Chan 1 in paramedian lobule, Chan 2 in Crus II). (A,B) Simultaneously recorded GCL LFPs (top) and corresponding frequency spectrogram (bottom) showing changes in oscillatory activity through time. LFP trace amplitude z-score normalized, to perform oscillatory episode detection. Detected episodes of oscillation are represented by the red square box. Frequency spectrogram shown with 1-s windows. (C) Coherence spectrogram, 1-s windows, showing 0–50 Hz coherence patterns in time. (D) 4–12 Hz Coherence (red line), and corresponding phase lag (black line) between the two LFP traces.
Figure 3
Figure 3
Identification of the Golgi cells vs. Purkinje cell simple spikes (SSs), based on the firing properties. The method follows the one used by Vos et al. (1999), based on the variability of the cell firing (MAD ISI) vs. its median firing values (Median ISI). (A) Representation of two subpopulations of units, Golgi cell units (large ensemble, filled triangles, six cells, colors identify different units), and Purkinje cell SSs (small ensemble, filled circles, and diamonds, four cells), by the relationship between their median inter-spike interval (Median ISI), and the absolute deviation of their median firing inter-spike interval (MAD ISI). (B) Inter-spike interval of a representative identified Golgi cell. (C) Inter-spike interval of a representative Purkinje cell SS. (B,C) Insets: example spike waveforms for a Golgi cell (B) and a Purkinje cell SS (C).
Figure 4
Figure 4
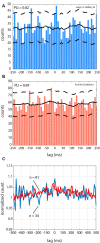
Spike-LFP relationships for Golgi and a Purkinje cell during 4–12 Hz oscillatory LFPs. (A) LFP-triggered spike histogram for a Golgi cell, with a peak at +10 ms. (B) LFP-triggered spike histogram for a Purkinje cell SS, with a peak at −20 ms. (C) Averaged trace for the cells in the Golgi cell group (blue line), and the Purkinje cell SS group (red line). The averaged trace has been normalized across all bins to a value of 1 so they can be superimposed. For (A–C), zero is the time of the LFP peak. For (A,B), the average of the spike-shuffled control is shown with the full black line, and the ±2 SD is indicated with the dashed black line.
Figure 5
Figure 5
Phase relationship for Golgi cells and Purkinje cell SSs within the LFP oscillation cycle. The main peak of the LFP-triggered histogram is taken to represent each cell. Left (A,C) peak alignment in the time domain; Right (B,D) angular (phase) relation, centered on the peak of the LFP (zero). (A,B) Relation of Golgi cells firing vs. the LFP cycle. Overall, the Golgi cells were more phase-locked with the peak of the LFP cycle or previous/subsequent cycles. (C,D) Relation of Purkinje cell SSs vs. the LFP cycle, who had more phase-locked cells with the ascending phase towards the peak, however, in a more variable manner.
Figure 6
Figure 6
Phase-locking over the samples of Golgi and Purkinje cell SSs. (A) Phase-locking index (PLI) distribution for the Golgi cells. Inset: two examples of Golgi cell LFP-triggered histograms. (B) PLI distribution for the Purkinje cell SSs. Inset: two examples of Purkinje cell SS LFP-triggered histograms. For both groups, the distribution is skewed towards lower values. A PLI > 0 was our criterion for phase locking. (C) Statistical difference between the two groups showing a higher PLI for the Golgi cells. (D) Relationship of phase-locking with Purkinje cell SS firing rate. Cells that were phase-locked with the LFP showed a slower firing rate than those that were not.
Figure 7
Figure 7
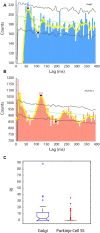
Rhythmic activity in Golgi cells and Purkinje cell SSs. A rhythm index (RI) was calculated based on the unit’s autocorrelogram, from the significant peaks and valleys exceeding the shuffled control for each cell. (A,B) Autocorrelograms for a sample Golgi cell (A, blue), and Purkinje cell SS (B, red). Also indicated are the mean of the shuffled control (green line) ±2 SD (gray lines). Yellow line: running average of the histogram. Black dots signify peaks higher and valleys lower than the shuffled control variability. (A) Golgi cell showing a 16.7 Hz rhythm. (B) Purkinje cell SS showing an 8 Hz rhythm. (C) Statistical difference between the two groups in RI, with the Golgi cell group showing larger RIs than the Purkinje cell SS group.
Figure 8
Figure 8
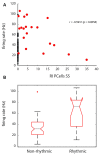
Firing rate properties for Purkinje cell SSs in relation with the Rhythm Index (RI). (A) Correlation between the firing rate and the RI, for the units with a RI > 0 (red dots). Units with a RI = 0 are indicated with black dots. Note the inverse correlation with the RI, with lower rate spiking being related to higher RIs. (B) Statistical difference in firing rate seen between units with a RI = 0, and those that have a RI > 0. Overall, because of their lower range of firing rate, Purkinje cell’s SSs with no rhythmicity show slower firing.

References

    1. Akam T., Kullmann D. M. (2010). Oscillations and filtering networks support flexible routing of information. Neuron 67, 308–320. 10.1016/j.neuron.2010.06.019 - DOI - PMC - PubMed
    1. Alviña K., Walter J. T., Kohn A., Ellis-Davies G., Khodakhah K. (2008). Questioning the role of rebound firing in the cerebellum. Nat. Neurosci. 11, 1256–1258. 10.1038/nn.2195 - DOI - PMC - PubMed
    1. Bareš M., Apps R., Avanzino L., Breska A., D’Angelo E., Filip P., et al. . (2019). Consensus paper: decoding the contributions of the cerebellum as a time machine. From neurons to clinical applications. Cerebellum 18, 266–286. 10.1007/s12311-018-0979-5 - DOI - PubMed
    1. Bares M., Lungu O. V., Husárová I., Gescheidt T. (2010). Predictive motor timing performance dissociates between early diseases of the cerebellum and Parkinson’s disease. Cerebellum 9, 124–135. 10.1007/s12311-009-0133-5 - DOI - PubMed
    1. Barmack N. H., Yakhnitsa V. (2008). Functions of interneurons in mouse cerebellum. J. Neurosci. 28, 1140–1152. 10.1523/JNEUROSCI.3942-07.2008 - DOI - PMC - PubMed

LinkOut - more resources