. 2020 Nov 6:11:601534.
doi: 10.3389/fimmu.2020.601534. eCollection 2020.

GPR183 Regulates Interferons, Autophagy, and Bacterial Growth During Mycobacterium tuberculosis Infection and Is Associated With TB Disease Severity

Affiliations

GPR183 Regulates Interferons, Autophagy, and Bacterial Growth During Mycobacterium tuberculosis Infection and Is Associated With TB Disease Severity

Stacey Bartlett et al. Front Immunol. .

Abstract

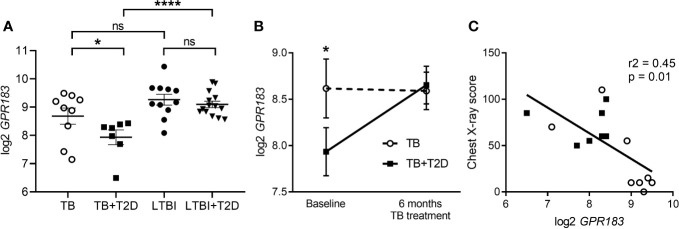
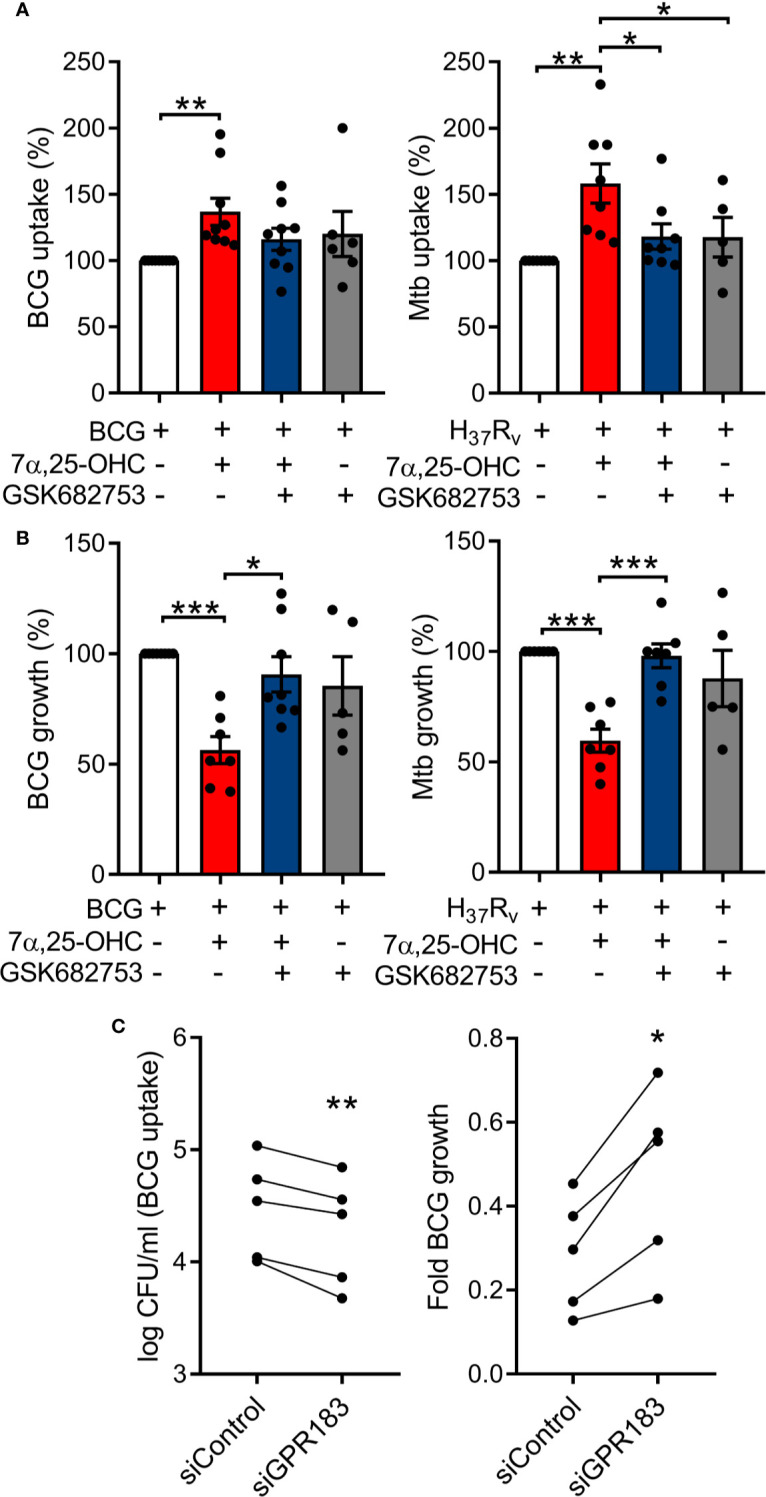
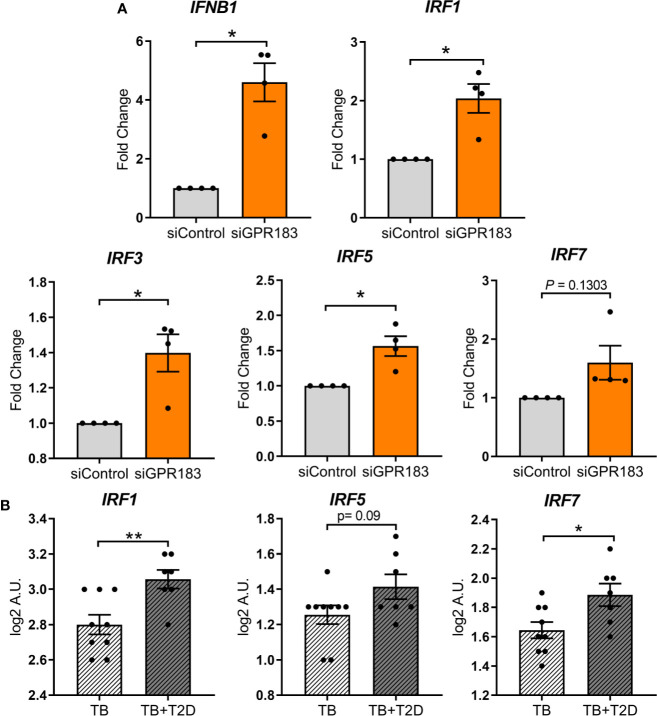
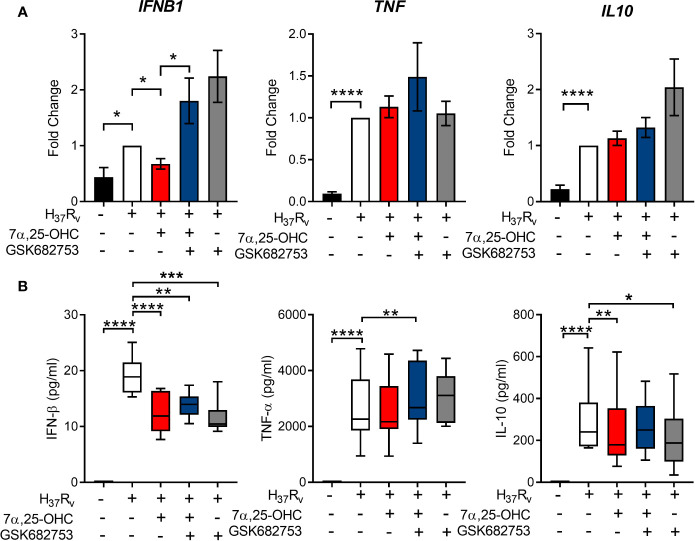
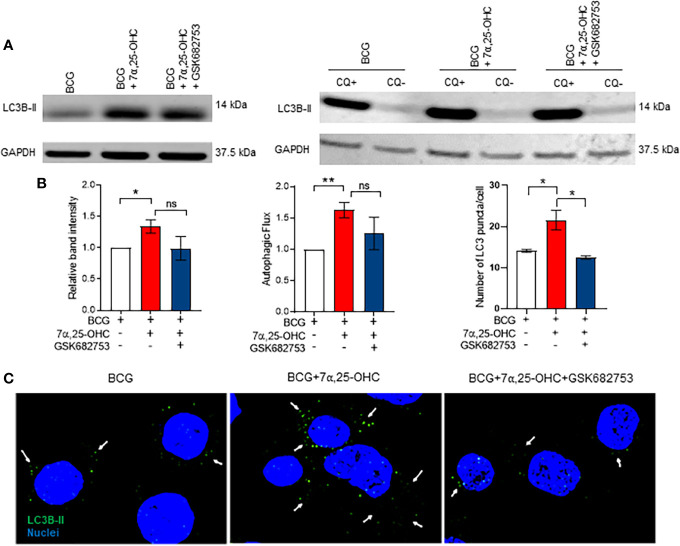
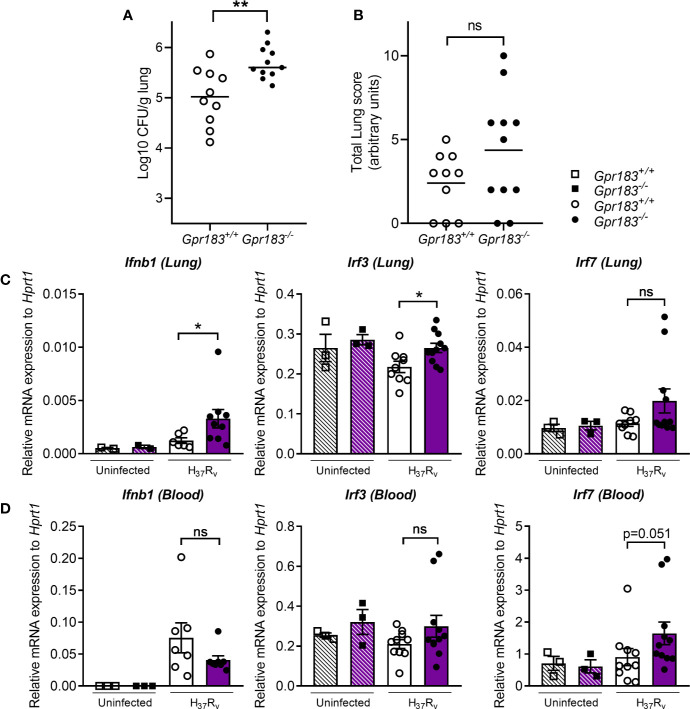
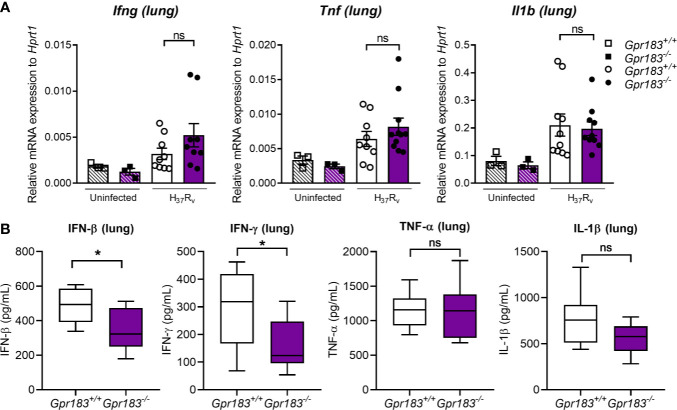
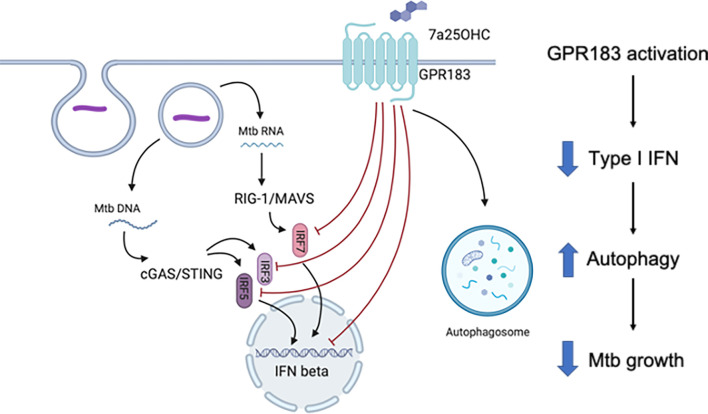
Oxidized cholesterols have emerged as important signaling molecules of immune function, but little is known about the role of these oxysterols during mycobacterial infections. We found that expression of the oxysterol-receptor GPR183 was reduced in blood from patients with tuberculosis (TB) and type 2 diabetes (T2D) compared to TB patients without T2D and was associated with TB disease severity on chest x-ray. GPR183 activation by 7α,25-dihydroxycholesterol (7α,25-OHC) reduced growth of Mycobacterium tuberculosis (Mtb) and Mycobacterium bovis BCG in primary human monocytes, an effect abrogated by the GPR183 antagonist GSK682753. Growth inhibition was associated with reduced IFN-β and IL-10 expression and enhanced autophagy. Mice lacking GPR183 had significantly increased lung Mtb burden and dysregulated IFNs during early infection. Together, our data demonstrate that GPR183 is an important regulator of intracellular mycobacterial growth and interferons during mycobacterial infection.

Keywords: 7α,25-dihydroxycholesterol; EBI2; GPR183; Mycobacterium tuberculosis; autophagy; diabetes; host-direct therapies; oxysterols.


Figures

Figure 1
Figure 1
GPR183 mRNA expression in patients with active and latent TB infection with or without T2D. Total RNA was isolated from whole blood incubated overnight in QuantiFERON-TB Gold. GPR183 mRNA expression was determined and normalized to reference genes using the NanoString technology. GPR183 expression in whole blood of (A) TB (n = 9) and TB + T2D (n = 7) patients, LTBI (n = 11) and LTBI + T2D (n = 14) patients, Wilcoxon test. (B) TB (n = 9) and TB + T2D (n = 7) patients at baseline and 6 month’s treatment, t-test. (C) Correlation between GPR183 expression and chest x-ray score, TB + T2D patients (n = 7) filled squares, TB patients (n =8) open circles. Data are presented as means ± SEM; not significance (ns) P > 0.05; *P ≤ 0.05; ****P ≤ 0.0001.
Figure 2
Figure 2
Oxysterol-induced activation of GPR183 in primary MNs significantly inhibits intracellular mycobacterial growth, while GPR183 knockdown increases intracellular mycobacterial growth. Primary MNs from eight donors (A) and seven donors (B) were infected with BCG or Mtb H37Rv (MOI 1), ± 7α,25-OHC (100 nM), ± GSK682753 (10 µM). Uptake of (A) BCG and Mtb H37Rv was determined at 2h p.i. Growth of (B) BCG and Mtb H37Rv was determined at 48h post-infection. Percent of mycobacterial growth was calculated as the fold change of CFU at 48h compared to CFU at 2h, normalized to non-treated cells. PMA-differentiated THP-1 cells were transfected with 20 nM of either negative control siRNA or GPR183 siRNA for 48h before infection with BCG (MOI 1). (C) Mycobacterial uptake was determined at 2h and intracellular mycobacterial growth was determined at 48h p.i. (normalized to uptake). Data are presented as means ± SEM; *P ≤ 0.05; **P ≤ 0.01; ***P ≤ 0.001; paired t-test.
Figure 3
Figure 3
GPR183 knockdown increases expression of transcription factors regulating type I interferon responses. (A) Total RNA was isolated from primary MNs following 48 h incubation with 20 nM GPR183 siRNA (or negative control siRNA). Gene expression of IFNB1, IRF1, IRF3, IRF5, IRF7 was measured by qRT-PCR using RPS13 as reference gene. Data are normalized to cells transfected with negative control siRNA. (B) NanoString analyses of RNA isolated from TB and TB + T2D cohort showed similar increase in type I IFN associated genes IRF1, IRF5, IRF7. Data are presented as fold changes ± SEM; *P ≤ 0.05; **P ≤ 0.01; paired t-test.
Figure 4
Figure 4
Activation of GPR183 leads to cytokine production favoring Mtb control. Primary MN from healthy donors (n = 8) were infected for 2 h with Mtb H37Rv (MOI 10:1), 7a,25-OHC (100 nM), and/or GSK682753 (10 μM). Cells were washed and left with drugs for a further 22 h. Changes in the expression of (A) IFNB1, TNF, and IL10 were measured by qPCR and normalized to untreated infected cells. Concentrations of (B) IFN-b, TNF-a, and IL-10 in the culture supernatant were measured by ELISA. Data are presented as mean fold change ± SEM or min to max for box plots; *P ≤ 0.05; **P ≤ 0.01; ***P ≤ 0.001; ****P ≤ 0.0001; paired t-test.
Figure 5
Figure 5
Treatment with 7α,25-OHC induces autophagy. PMA-differentiated THP-1 cells were infected/uninfected and co-incubated with ±7α,25-OHC, ±GSK682753, for 2 h. Extracellular BCG was removed, and cells were incubated for a further 4 h or 22 h in RPMI medium containing drugs. (A) Cells were lysed at 6 h or 24 h (Flux) p.i. (B) The band intensity was then normalized to the reference protein, GAPDH and further normalized to the BCG. Autophagic flux was obtained by subtracting chloroquine positive values with chloroquine negative values. (C) Cells were visualized using the Olympus FV 3000 confocal microscope. At least 30 cells were counted for every condition. Data are presented as ± SEM; ns, P > 0.05; *P ≤ 0.05; **P ≤ 0.01; unpaired t-test.
Figure 6
Figure 6
GPR183KO mice have higher lung CFU, corresponding with increased expression of transcription factors regulating type I interferon responses. Mice were infected with 300 CFU of aerosol Mtb H37Rv. (A) Bacterial lung burden 2 weeks p.i. (B) Total histology lung score. RNA was isolated from Mtb-infected lung and blood samples 2 weeks p.i. (C) Gene expression of Ifnb1, Irf3, and Irf7 in the lungs, (D) Ifnb1, Irf3, and Irf7 in the blood, was measured by qRT-PCR using Hprt1 as reference gene. Data are presented as ± SEM; ns, P > 0.05; *P ≤ 0.05; **P ≤ 0.01.
Figure 7
Figure 7
Pro-inflammatory cytokine expression at 2 weeks p.i. of Mtb H37Rv-infected mice. Mice were infected with 300 CFU of aerosol Mtb H37Rv. (A) Gene expression of Ifng, Il1b, and Tnf in the lungs. (B) Concentrations of IFN-β, IFN-γ, IL-1β and TNF-α in the culture supernatant were measured by ELISA. Data are presented as ± SEM; ns, P > 0.05; *P ≤ 0.01.
Figure 8
Figure 8
Schematic summary of the role of GPR183 in Mtb-infected human monocytes.

References

    1. Magee MJ, Kempker RR, Kipiani M, Gandhi NR, Darchia L, Tukvadze N, et al. Diabetes mellitus is associated with cavities, smear grade, and multidrug-resistant tuberculosis in Georgia. Int J Tuberculosis Lung Dis (2015) 19(6):685–92. 10.5588/ijtld.14.0811 - DOI - PMC - PubMed
    1. Dong Z, Shi J, Dorhoi A, Zhang J, Soodeen-Lalloo AK, Tan W, et al. Hemostasis and Lipoprotein Indices Signify Exacerbated Lung Injury in TB With Diabetes Comorbidity. Chest (2018) 153(5):1187–200. 10.1016/j.chest.2017.11.029 - DOI - PubMed
    1. Critchley JA, Restrepo B, II, Ronacher K, Kapur A, Bremer AA, Schlesinger LS, et al. Defining a Research Agenda to Address the Converging Epidemics of Tuberculosis and Diabetes: Part 1: Epidemiology and Clinical Management. Chest (2017) 152(1):165–73. 10.1016/j.chest.2017.04.155 - DOI - PMC - PubMed
    1. Ronacher K, van Crevel R, Critchley JA, Bremer AA, Schlesinger LS, Kapur A, et al. Defining a Research Agenda to Address the Converging Epidemics of Tuberculosis and Diabetes: Part 2: Underlying Biologic Mechanisms. Chest (2017) 152(1):174–80. 10.1016/j.chest.2017.02.032 - DOI - PMC - PubMed
    1. Restrepo B, II, Kleynhans L, Salinas AB, Abdelbary B, Tshivhula H, Aguillon-Duran GP, et al. Diabetes screen during tuberculosis contact investigations highlights opportunity for new diabetes diagnosis and reveals metabolic differences between ethnic groups. Tuberculosis (Edinb) (2018) 113:10–8. 10.1016/j.tube.2018.08.007 - DOI - PMC - PubMed

Publication types

MeSH terms

LinkOut - more resources