. 2020 Nov 3:11:578679.
doi: 10.3389/fgene.2020.578679. eCollection 2020.

Gene Expression and Co-expression Networks Are Strongly Altered Through Stages in Clear Cell Renal Carcinoma

Affiliations

Gene Expression and Co-expression Networks Are Strongly Altered Through Stages in Clear Cell Renal Carcinoma

Jose María Zamora-Fuentes et al. Front Genet. .

Abstract

Clear cell renal carcinoma (ccRC) is a highly heterogeneous and progressively malignant disease. Analyzing ccRC progression in terms of modifications at the molecular and genetic level may help us to develop a broader understanding of its patho-physiology and may give us a glimpse toward improved therapeutics. In this work, by using TCGA data, we studied the molecular progression of the four main ccRC stages (i, ii, iii, iv) in two different yet complementary approaches: (a) gene expression and (b) gene co-expression. For (a) we analyzed the differential gene expression between each stage and the control non-cancer group. We compared the progression molecular signature between stages, and observed those genes that change their expression patterns through progression stages. For (b) we constructed and analyzed co-expression networks for the four ccRC progression stages, as well as for the control phenotype, to observe whether and how the co-expression landscape changes with progression. We separated genomic interactions into intra-chromosome (cis-) and inter-chromosome (trans-). Finally, we intersected those networks and performed functional enrichment analysis. All calculations were made over different network sizes, from the top 100 edges to top 1,000,000. We show that differential expression is quite similar between ccRC progression stages. However, interestingly, two genes, namely SLC6A19 and PLG show a significant progressive decrease in their expression according to ccRC stage, meanwhile two other genes, SAA2-SAA4 and CXCL13 show progressive increase. Despite the high similarity between gene expression profiles, all networks are substantially different between them in terms of their topological features. Control network has a larger proportion of trans- interactions, meanwhile for any stage, the amount of cis- interactions is higher, independent of the network cut-off. The majority of interactions in any network are phenotype-specific. Only 189 interactions are shared between the five networks, and 533 edges are ccRC-specific, independent of the stage. The small resulting connected components in both cases are formed by genes with the same differential expression trend, and are associated with important biological processes, such as cell cycle or immune system, suggesting that activity of these categories follows the differential expression trend. With this approach we have shown that, even if the expression program is similar during ccRC progression, the co-expression programs strongly differ. More research is needed to understand the delicate interplay between expression and co-expression, but this is a first approach to enclose both approaches in an integrative view aimed at a deeper understanding in gene regulation in tumor evolution.

Keywords: CXCL13 progressive overexpression; PLG progressive underexpression; SAA2-SAA4 progressive overexpression; SLC6A19 progressive underexpression; cancer progression stages; clear cell renal carcinoma; gene co-expression networks; loss of long-range co-expression.


Figures

Figure 1
Figure 1
Workflow. Graphical representation of the computational pipeline performed here. (Left) Gene-based analysis. (Right) Network-based analyses.
Figure 2
Figure 2
Differential gene expression for each ccRC stage. In these volcano-plots, the differential expression between each stage vs. control samples is depicted. Red dots represent overexpressed genes, meanwhile underexpressed ones are in blue. Notice that underexpressed genes are more broadly distributed than overexpressed ones, and Log2FC values are similar in the four figures; however, B-statistics change depending on the ccRC stage.
Figure 3
Figure 3
Progressive increase and decrease in expression of four genes at the different ccRC stages. These barplots show the average expression of SAAC2-SAAC4 and CXCL13 genes (left), and SLC6A19 and PLG genes (right). Different colors represent the progression stages. Notice that the Y axis (gene expression) is, in all cases, depicted in log scale.
Figure 4
Figure 4
Degree distribution of the five networks. In this plot, points correspond to the degree distribution for each phenotype. Color code is the same than Figure 3. Curve fitting (y = axb) to each degree distribution is also depicted. Notice that control network distribution slope (light green) is the lowest one.
Figure 5
Figure 5
Network topologies of ccRC per stage. Top to bottom figures correspond to the largest connected component of control, stage I, stage II, stage III, and Stage IV, respectively. Color of nodes correspond to the chromosome to which each gene belongs to. The bar-chart represents the proportion of cis- (blue) and trans- (orange) interactions.
Figure 6
Figure 6
cis- rate (cis edges/# of genes) per chromosome for the five networks: green, orange, violet, yellow and blue for control, stage I, stage II, stage III, and stage IV, respectively. In all cases but for ChrY, the ratio is lower than 1 for the control network.
Figure 7
Figure 7
Edge intersection of all networks. Venn diagram shows, in each set, the number of edges per phenotype. The number reflect the shared genes between networks, as well as network-specific interactions. Notice that out of 10,000 interactions, only 189 edges are shared between the five networks.
Figure 8
Figure 8
Proportion of networks intersection at different network cut-offs. In this plot, proportion of network intersection between the four ccRC stages (orange diamonds), and those with control network (blue squares) is depicted. X-axis represent different network cut-off values.
Figure 9
Figure 9
Network trans- interactions at different cut-offs. In this plot, X-axis represents the cut-off network value for the five different networks (control and the four ccRC stages). Y-axis shows the number of inter-chromosomal interactions per each network cut-off. To note that the control network trans- edges are larger than any ccRC progression stage at any cut-off network value.
Figure 10
Figure 10
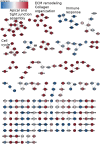
Network from shared interactions between the five phenotypes. The resulting network is composed of 189 edges and 230 genes. Those are colored according to the differential expression compared with the control group. Notice that network smaller components have a similar expression pattern. Some components are enriched to specific GO categories, meaning that those processes are increased or decreased during the whole process of ccRC progression.
Figure 11
Figure 11
Network from shared interactions between Top-10,000 ccRC networks. The resulting network is composed of 533 edges and 148 genes. Those are colored according to their differential expression compared with the control group. As in case of Figure 10, differentially expressed clusters are enriched for specific categories.

References

    1. Alcalá-Corona S. A., de Anda-Jáuregui G., Espinal-Enríquez J., Hernández-Lemus E. (2017). Network modularity in breast cancer molecular subtypes. Front. Physiol. 8:915. 10.3389/fphys.2017.00915 - DOI - PMC - PubMed
    1. Alcalá-Corona S. A., Espinal-Enríquez J., de Anda-Jáuregui G., Hernández-Lemus E. (2018). The hierarchical modular structure of HER2+ breast cancer network. Front. Physiol. 9:1423 10.3389/fphys.2018.01423 - DOI - PMC - PubMed
    1. Alcalá-Corona S. A., Velázquez-Caldelas T. E., Espinal-Enríquez J., Hernández-Lemus E. (2016). Community structure reveals biologically functional modules in MEF2C transcriptional regulatory network. Front. Physiol. 7:184. 10.3389/fphys.2016.00184 - DOI - PMC - PubMed
    1. Arjumand W., Sultana S. (2012). Role of VHL gene mutation in human renal cell carcinoma. Tumor Biol. 33, 9–16. 10.1007/s13277-011-0257-3 - DOI - PubMed
    1. Aron M., Nguyen M. M., Stein R. J., Gill I. S. (2008). Impact of gender in renal cell carcinoma: an analysis of the seer database. Eur. Urol. 54, 133–142. 10.1016/j.eururo.2007.12.001 - DOI - PubMed