. 2020 Oct 1;7(22):2001714.
doi: 10.1002/advs.202001714. eCollection 2020 Nov.

Multiplatform Metabolomics Reveals Novel Serum Metabolite Biomarkers in Diabetic Retinopathy Subjects

Affiliations

Multiplatform Metabolomics Reveals Novel Serum Metabolite Biomarkers in Diabetic Retinopathy Subjects

Qiuhui Xuan et al. Adv Sci (Weinh). .

Abstract

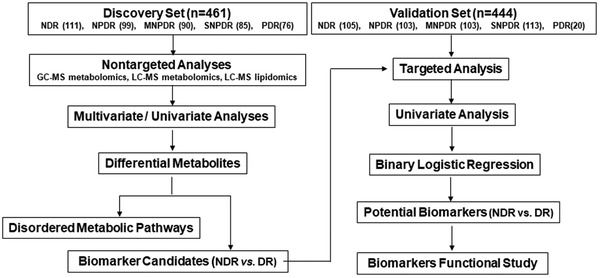
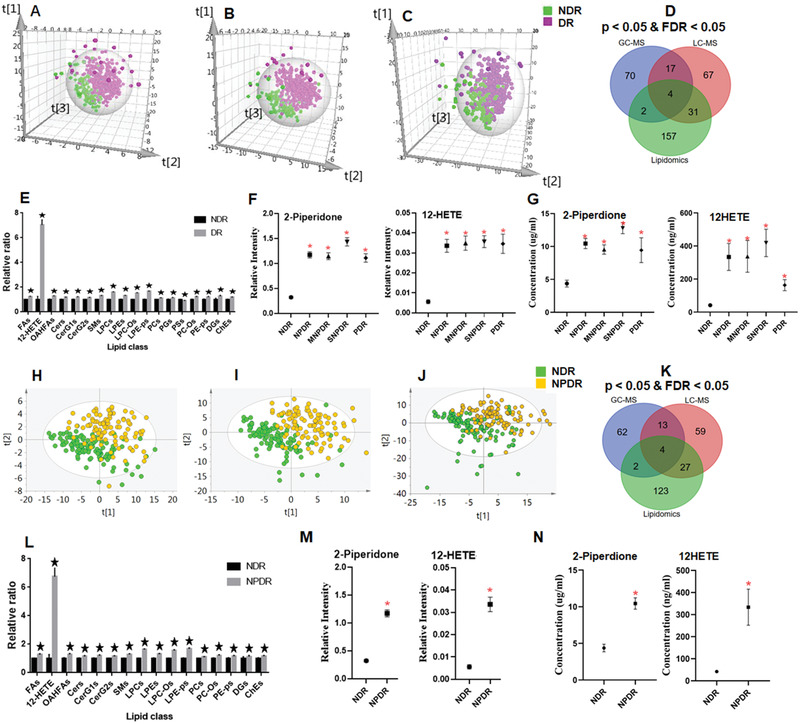
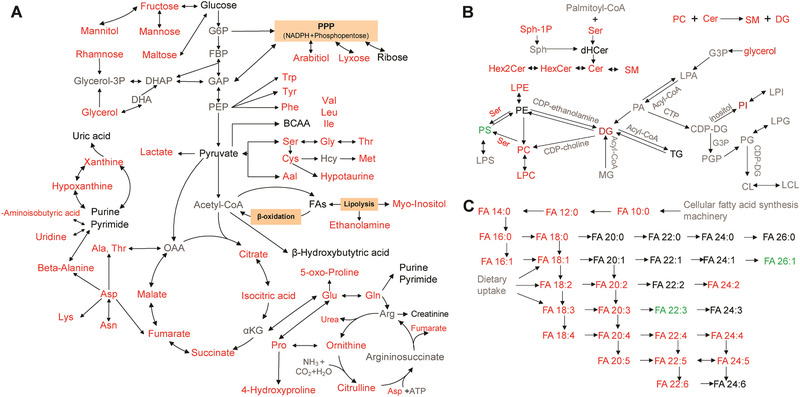
Diabetic retinopathy (DR) is the main cause of vision loss or blindness in working age adults worldwide. The lack of effective diagnostic biomarkers for DR leads to unsatisfactory curative treatments. To define potential metabolite biomarkers for DR diagnosis, a multiplatform-based metabolomics study is performed. In this study, a total of 905 subjects with diabetes without DR (NDR) and with DR at different clinical stages are recruited. Multiplatform metabolomics methods are used to characterize the serum metabolic profiles and to screen and validate the DR biomarkers. Based on the criteria p < 0.05 and false-discovery rate < 0.05, 348 and 290 metabolites are significantly associated with the pathogenesis of DR and early-stage DR, respectively. The biomarker panel consisting of 12-hydroxyeicosatetraenoic acid (12-HETE) and 2-piperidone exhibited better diagnostic performance than hemoglobin A1c (HbA1c) in differentiating DR from diabetes, with AUCs of 0.946 versus 0.691 and 0.928 versus 0.648 in the discovery and validation sets, respectively. In addition, this panel showed higher sensitivity in early-stage DR detection than HbA1c. In conclusion, this multiplatform-based metabolomics study comprehensively revealed the metabolic dysregulation associated with DR onset and progression. The defined biomarker panel can be used for detection of DR and early-stage DR.

Keywords: diabetic retinopathy; lipidomics; metabolomics; multiplatforms; serum biomarkers.


Conflict of interest statement

The authors declare no conflict of interest.

Figures

Figure 1
Figure 1
Design of the study.
Figure 2
Figure 2
Partial least squares discriminant analysis score plots for NDR and DR, including the NPDR, MNPDR, SNPDR, and PDR groups in the discovery set from A) GC‐MSM, B) LC‐MSM, and C) LC‐MSL. D) Venn diagram displaying the differential metabolites when the DR group was compared with the NDR group in the discovery set based on GC‐MSM, LC‐MSM, and LC‐MSL. E) Serum relative concentrations of significantly differential lipid (sub)classes based on LC‐MSL in the discovery set. F) Serum concentrations of 12‐HETE and 2‐piperidone based on the LC‐MS platform in the discovery and G) validation sets. PLS‐DA score plots for NDR and NPDR groups in the discovery set from H) GC‐MSM, I) LC‐MSM, and J) LC‐MSL. K) Venn diagram displaying the differential metabolites when the NPDR group was compared with the NDR group in the discovery set based on GC‐MSM, LC‐MSM, and LC‐MSL. L) Relative serum concentrations of significantly differential lipid (sub)classes based on LC‐MSL in the discovery set. M) Serum concentrations of 12‐HETE and 2‐piperidone based on the LC‐MS platform in the discovery and N) validation sets. The metabolite data were compared using nonparametric tests in Wilcoxon, Mann–Whitney test and Benjamini–Hochberg‐based FDR modes, *p < 0.05 and/or FDR < 0.05, compared with NDR.
Figure 3
Figure 3
Changes in metabolic pathways in DR. Black text represents the detected metabolites with no significant change, red text represents significantly enriched metabolites (e.g., multiple amino acids), and green text represents significantly depleted metabolites (e.g., phosphatidylserine, PS) when the DR group is compared with the NDR group, and gray text represents undetected metabolites. The metabolite data were compared using nonparametric tests in Wilcoxon, Mann–Whitney test and Benjamini–Hochberg‐based FDR modes.

References

    1. Cheung N., Wong T. Y., Prog. Retin. Eye Res. 2008, 27, 161. - PubMed
    1. Liew G., Michaelides M., Bunce C., BMJ Open 2014, 4, e004015. - PMC - PubMed
    1. Wang L. Z., Cheung C. Y., Tapp R. J., Hamzah H., Tan G., Ting D., Lamoureux E., Wong T. Y., Br. J. Ophthalmol. 2017, 101, 1352. - PubMed
    1. Dorcely B., Katz K., Jagannathan R., Chiang S. S., Oluwadare B., Goldberg I. J., Bergman M., Diabetes Metab. Syndr. Obes. 2017, 10, 345. - PMC - PubMed
    1. Hirsch I. B., Brownlee M., JAMA. 2010, 303, 2291. - PubMed

LinkOut - more resources