. 2020 Nov 10:7:597546.
doi: 10.3389/fcvm.2020.597546. eCollection 2020.

Plasma Metabolomic Profiles Differentiate Patients With Dilated Cardiomyopathy and Ischemic Cardiomyopathy

Affiliations

Plasma Metabolomic Profiles Differentiate Patients With Dilated Cardiomyopathy and Ischemic Cardiomyopathy

Junhan Zhao et al. Front Cardiovasc Med. .

Abstract

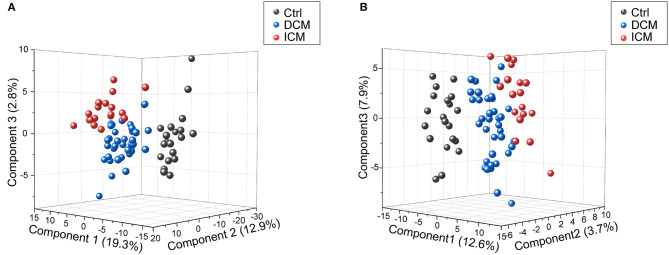
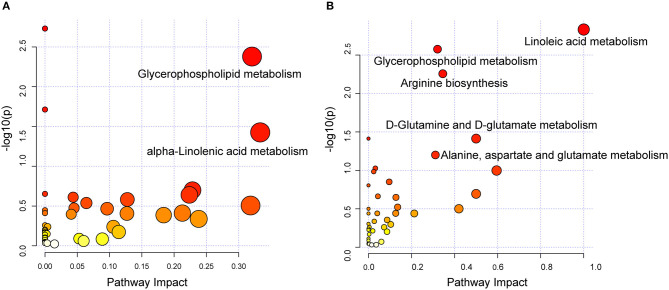
Dilated cardiomyopathy (DCM) and ischemic cardiomyopathy (ICM) are common causes of heart failure (HF). Though they share similar clinical characteristics, their differential effects on cardiovascular metabolomics have yet to be elucidated. In this study, we applied a comprehensive metabolomics platform to plasma samples of HF patients with different etiology (38 patients with DCM and 18 patients with ICM) and 20 healthy controls. Significant differences in metabolomics profiling were shown among two cardiomyopathy groups and healthy controls. Two hundred thirty three dysregulated metabolites were identified between DCM vs. healthy controls, and 204 dysregulated metabolites between ICM patients and healthy controls. They have 140 metabolites in common, with fold-changes in the same direction in both groups. Pathway analysis found the commonalities of HF pathways as well as disease-specific metabolic signatures. In addition, we found that a combination panel of 6 metabolites including 1-pyrroline-2-carboxylate, norvaline, lysophosphatidylinositol (16:0/0:0), phosphatidylglycerol (6:0/8:0), fatty acid esters of hydroxy fatty acid (24:1), and phosphatidylcholine (18:0/18:3) may have the potential to differentiate patients with DCM and ICM.

Keywords: dilated cardiomyopathy; heart failure; ischemic cardiomyopathy; metabolic pathway; metabolomics.


Figures

Figure 1
Figure 1
Workflow of the present study. In general, HF patients with different etiology (38 patients with DCM and 18 patients with ICM, respectively), and 20 healthy controls were enrolled in this study. An untargeted metabolomic panel was applied to the plasma samples of these individuals. We comparatively analyzed the plasma metabolomics profiling of the 3 groups to clarify the differences in HF patients with different etiology from the perspective of circulation metabolomics.
Figure 2
Figure 2
Score plots of PLSDA model in positive and negative ion modes. In the three-dimensional score plots, each plot represents a sample. They showed a distinct classification in healthy controls (gray) and patients with DCM (blue) and ICM (red) in positive ion mode (A) and negative ion mode (B).
Figure 3
Figure 3
Differential metabolites between patients with DCM, ICM, and healthy controls. Volcano plots for dysregulated endogenous metabolites between patients with DCM and healthy controls in positive ion mode (A) and negative ion mode (B). Volcano plots for dysregulated endogenous metabolites between patients with ICM and healthy controls in positive ion mode (C) and negative ion mode (D). Each plot represents a metabolite. The differentiating metabolites with adjusted P < 0.05 were highlighted in color. The venn diagram displayed the differential metabolites shared with DCM and ICM and the specific metabolites to be significant only in one comparison in in positive ion mode (E) and negative ion mode (F).
Figure 4
Figure 4
Dysregulated pathway observed in DCM and ICM. Dysregulated pathways involved in the pathogenesis of patients with DCM (A) or ICM (B). Significant pathways (P < 0.05) were highlighted.
Figure 5
Figure 5
The disease specific dysregulated metabolites distinguish patients with DCM from patients with ICM. (A) LASSO coefficient profiles of the disease-specific features. A coefficient profile plot was produced against the log(λ) sequence. Dotted vertical line was drawn at the optimal λ at minimum criteria and 1 standard error (1-SE criteria). The model at 1-SE criteria was selected as the final model with 6 non-zero coefficients. (B) Tuning parameter (λ) selection in the LASSO model used 10-fold cross-validation via minimum criteria. The binomial deviance was plotted vs. log (λ). (C) Bar plot of the 6 metabolites in DCM and ICM and HC. Student's t-test for two group comparison. (D) Plot of the area under curve for the created biomarker model in training and testing dataset by cross validation under 500 random replications. Data are presented as mean ± SD in bar plots. (E) The ROC created by a combination of six selected features based on whole dataset. *P < 0.05, **P < 0.01, ***P < 0.001.

References

    1. Tanai E, Frantz S. Pathophysiology of heart failure. Compr Physiol. (2015) 6:187–214. 10.1002/cphy.c140055 - DOI - PubMed
    1. Ibrahim NE, Januzzi JL, Jr. Established and emerging roles of biomarkers in heart failure. Circ. Res. (2018) 123:614–29. 10.1161/CIRCRESAHA.118.312706 - DOI - PubMed
    1. Mosterd A, Hoes AW. Clinical epidemiology of heart failure. Heart. (2007) 93:1137–46. 10.1136/hrt.2003.025270 - DOI - PMC - PubMed
    1. Maggioni AP, Dahlstrom U, Filippatos G, Chioncel O, Crespo Leiro M, Drozdz J, et al. . EURObservational research programme: regional differences and 1-year follow-up results of the heart failure pilot survey (ESC-HF Pilot). Eur J Heart Fail. (2013) 15:808–17. 10.1093/eurjhf/hft050 - DOI - PubMed
    1. Yancy CW, Jessup M, Bozkurt B, Butler J, Casey DE, Jr, Drazner MH, et al. 2013 ACCF/AHA guideline for the management of heart failure: a report of the American college of cardiology foundation/American heart association task force on practice guidelines. J Am Colle Cardiol. (2013) 62:e147–239. 10.1016/j.jacc.2013.05.019 - DOI - PubMed