Randomized Controlled Trial
. 2021 Feb 28;40(5):1101-1120.
doi: 10.1002/sim.8822. Epub 2020 Nov 26.

Generalizing randomized trial findings to a target population using complex survey population data

Affiliations
Randomized Controlled Trial

Generalizing randomized trial findings to a target population using complex survey population data

Benjamin Ackerman et al. Stat Med. .

Abstract

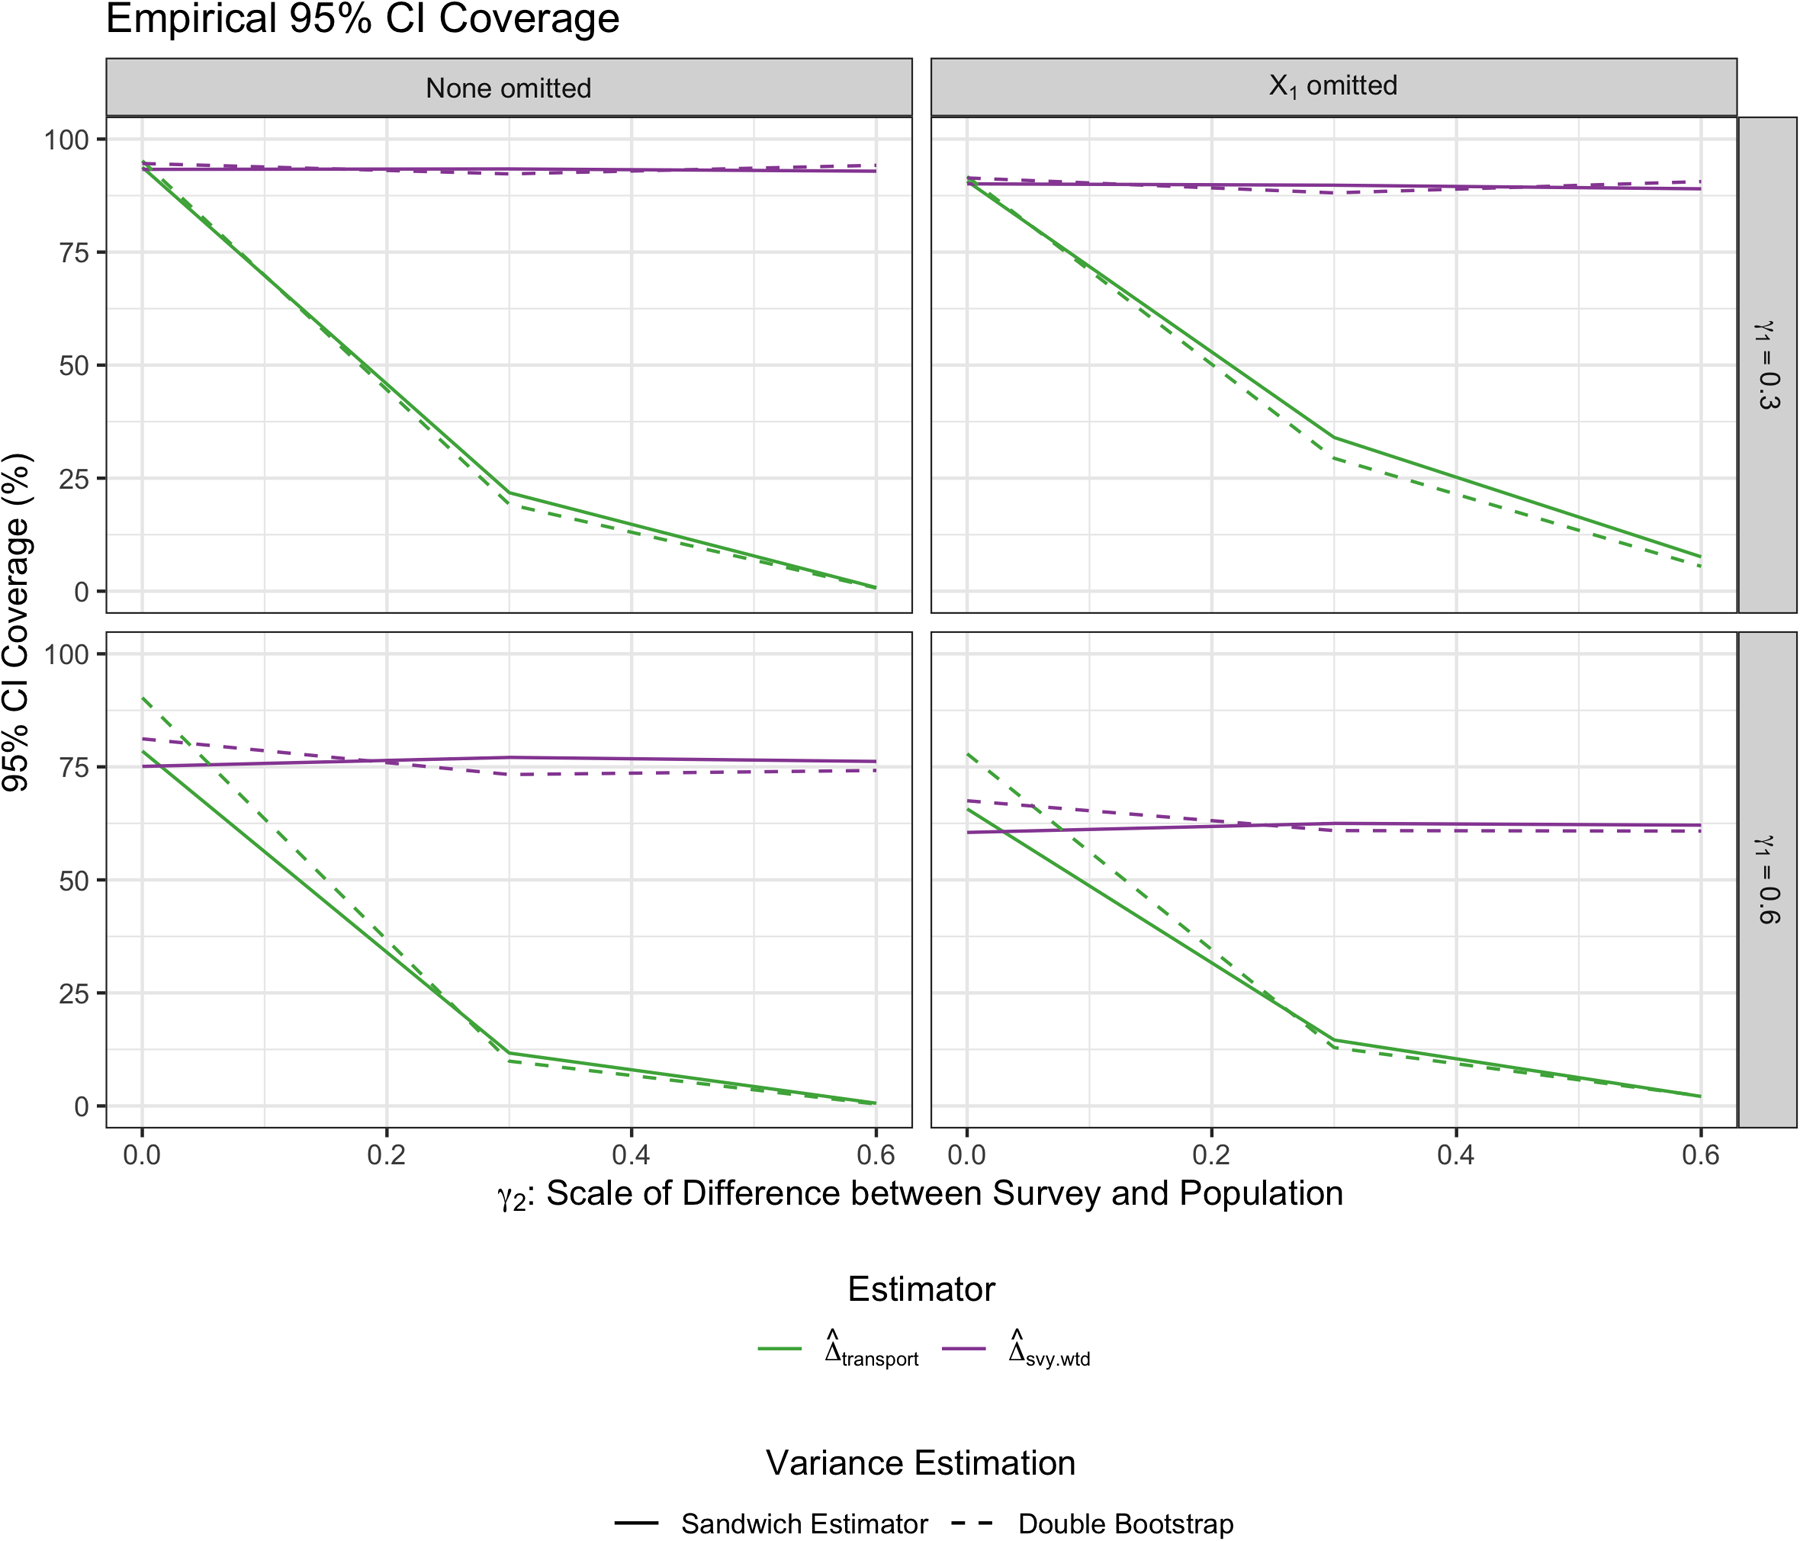
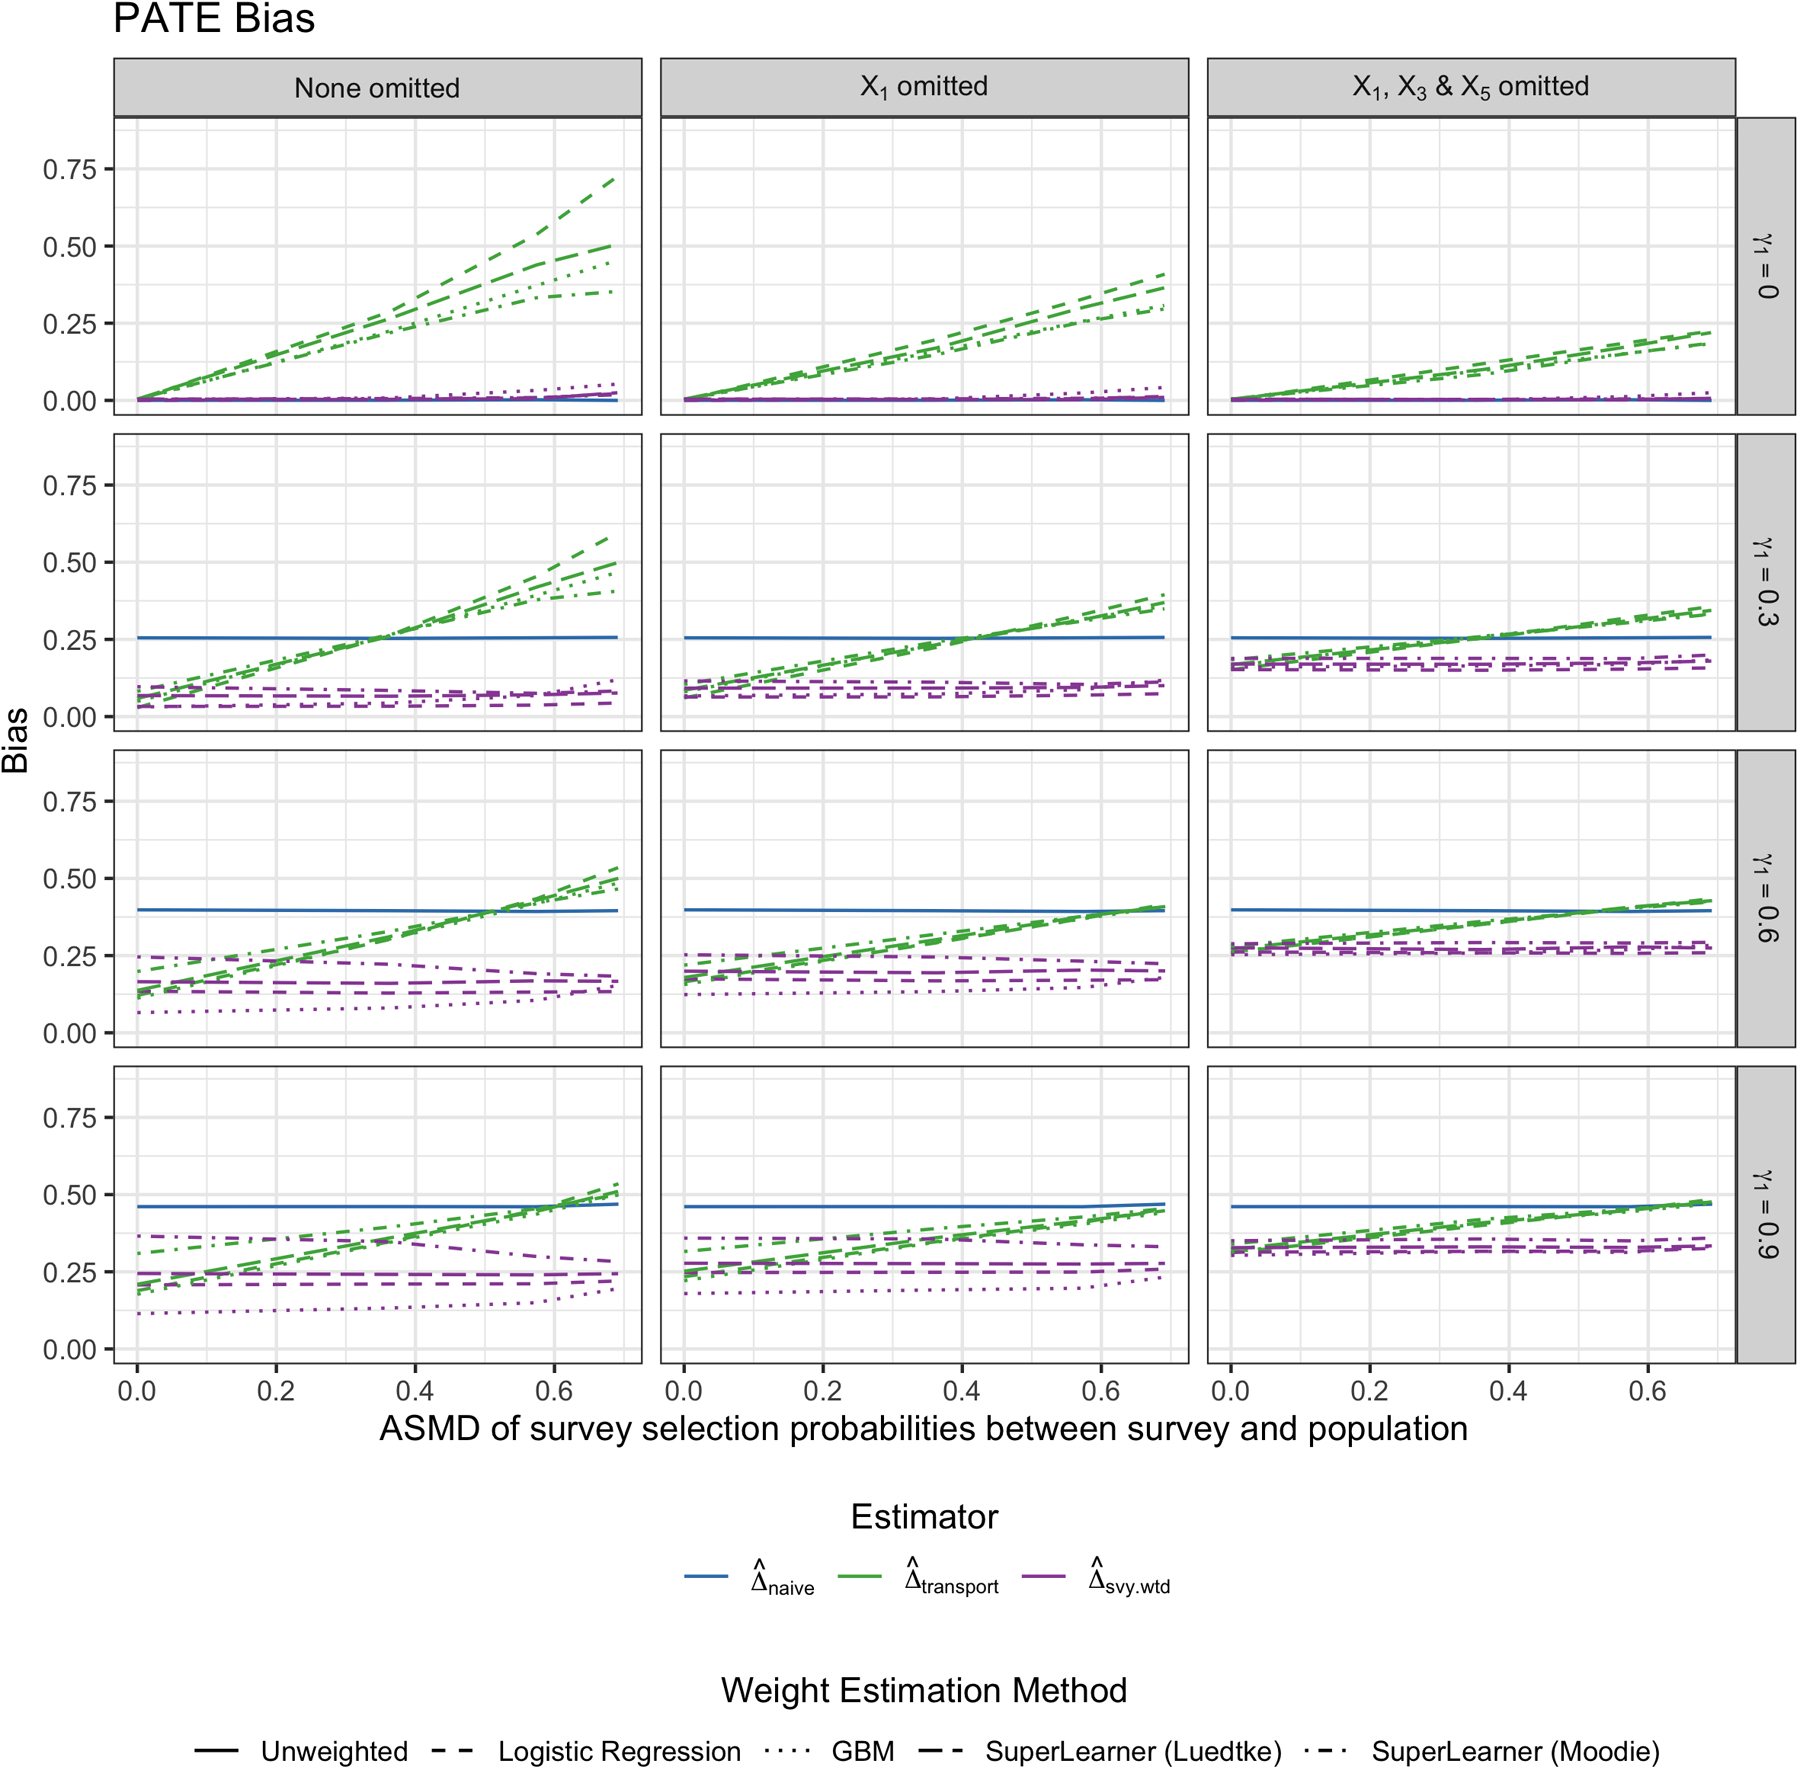
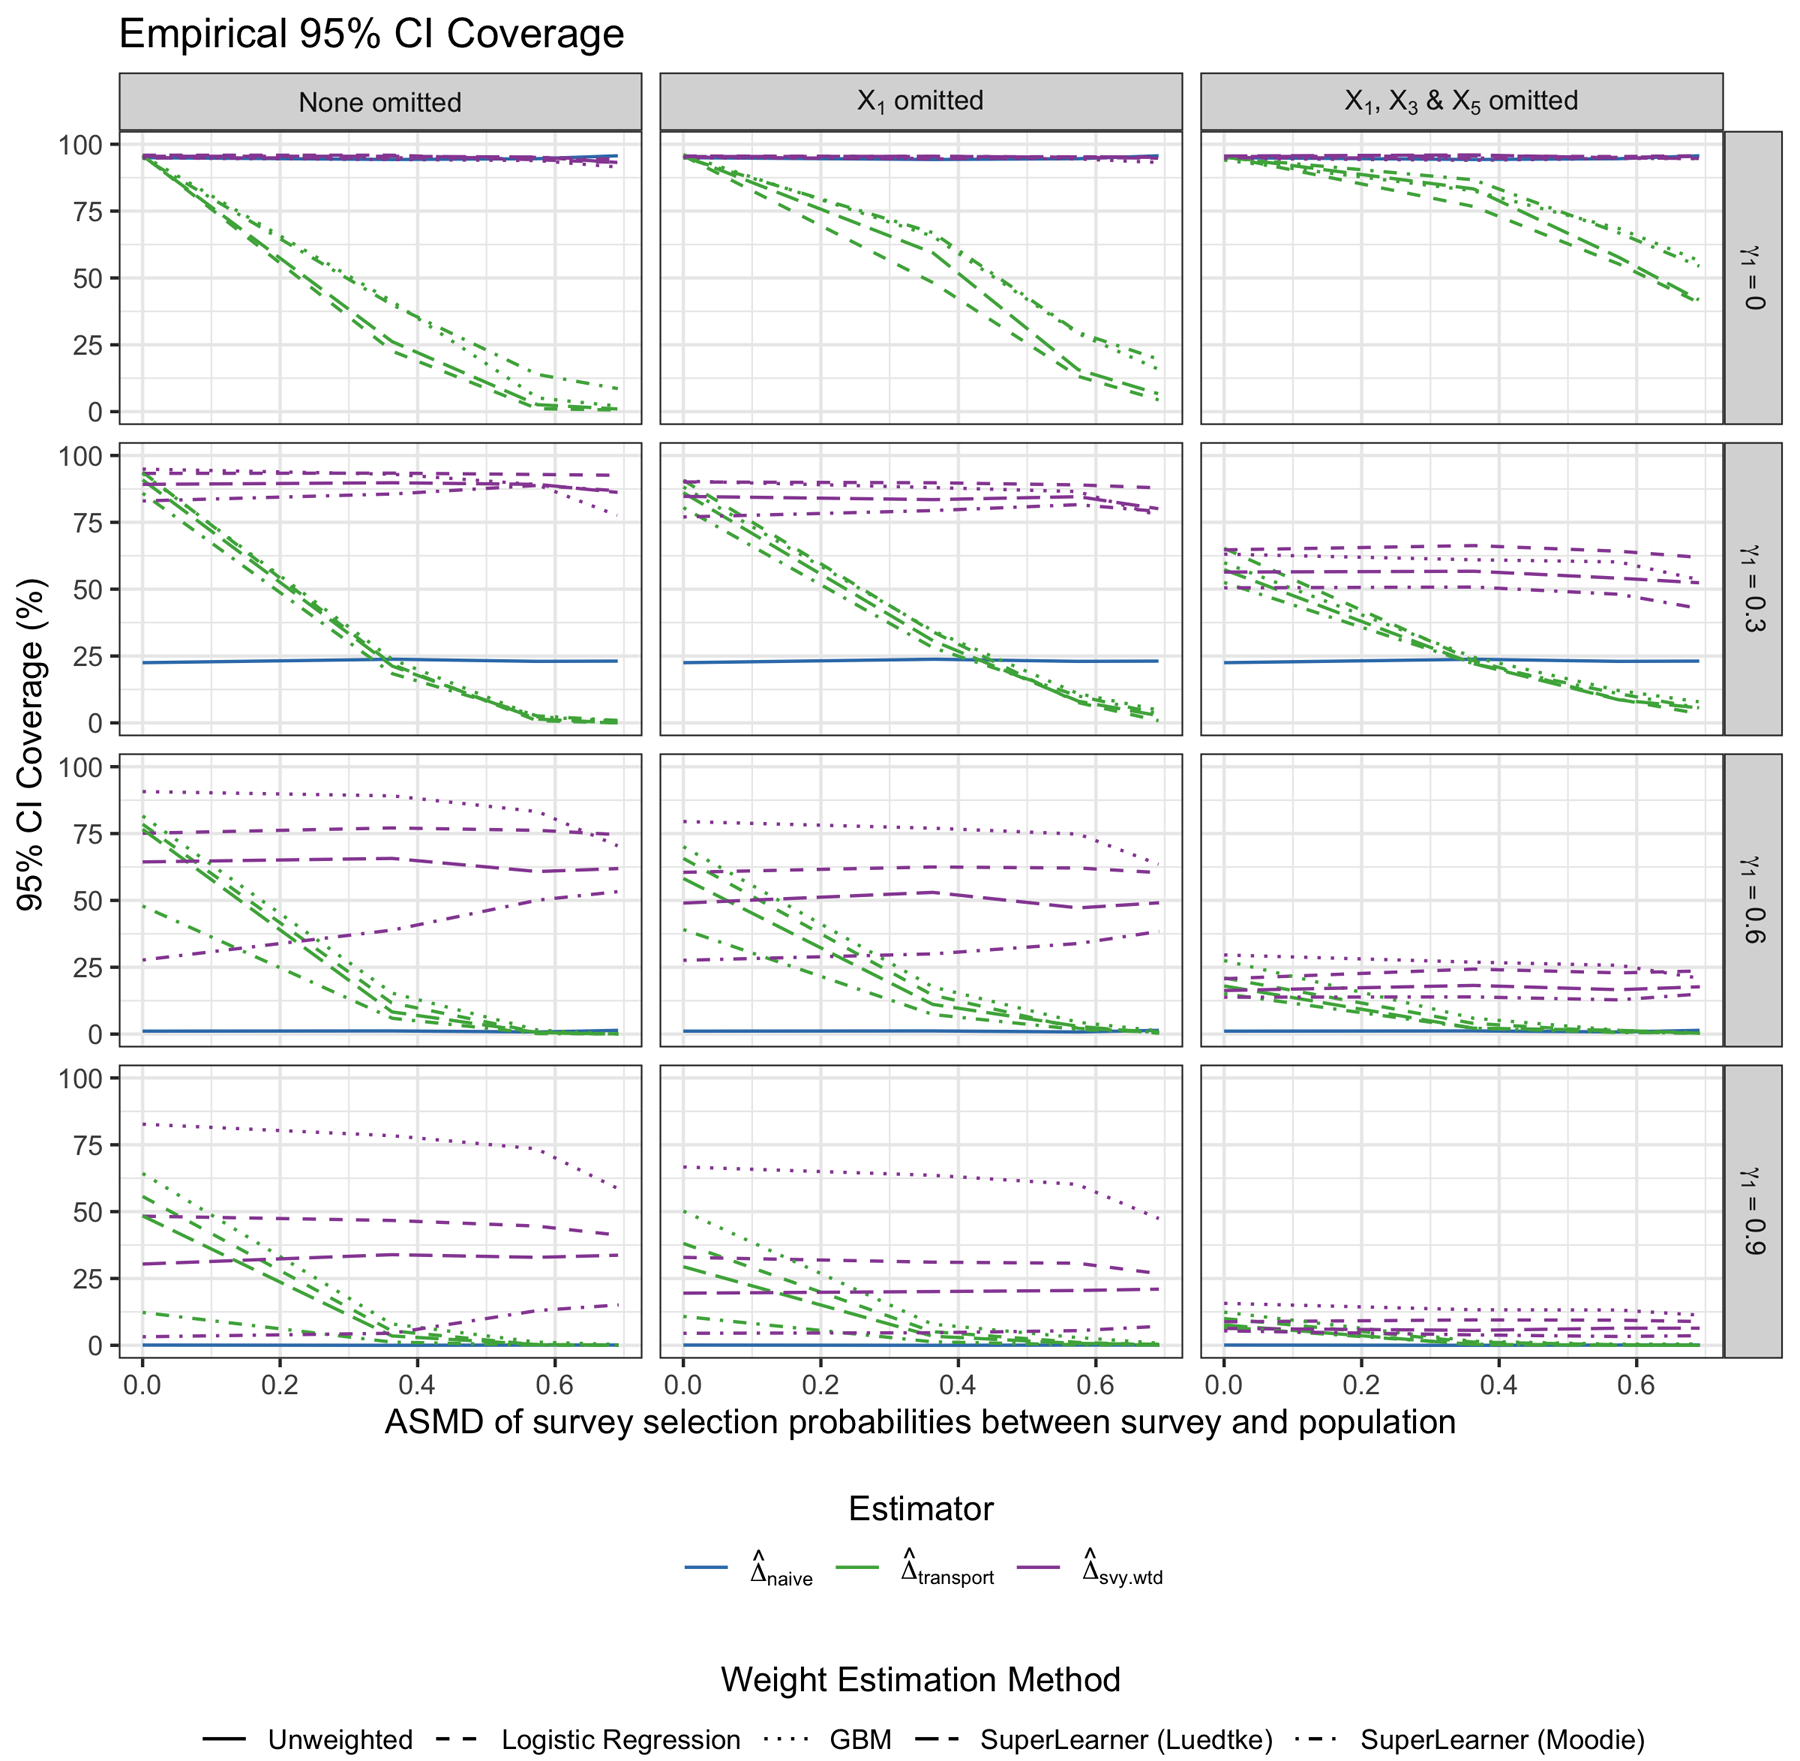
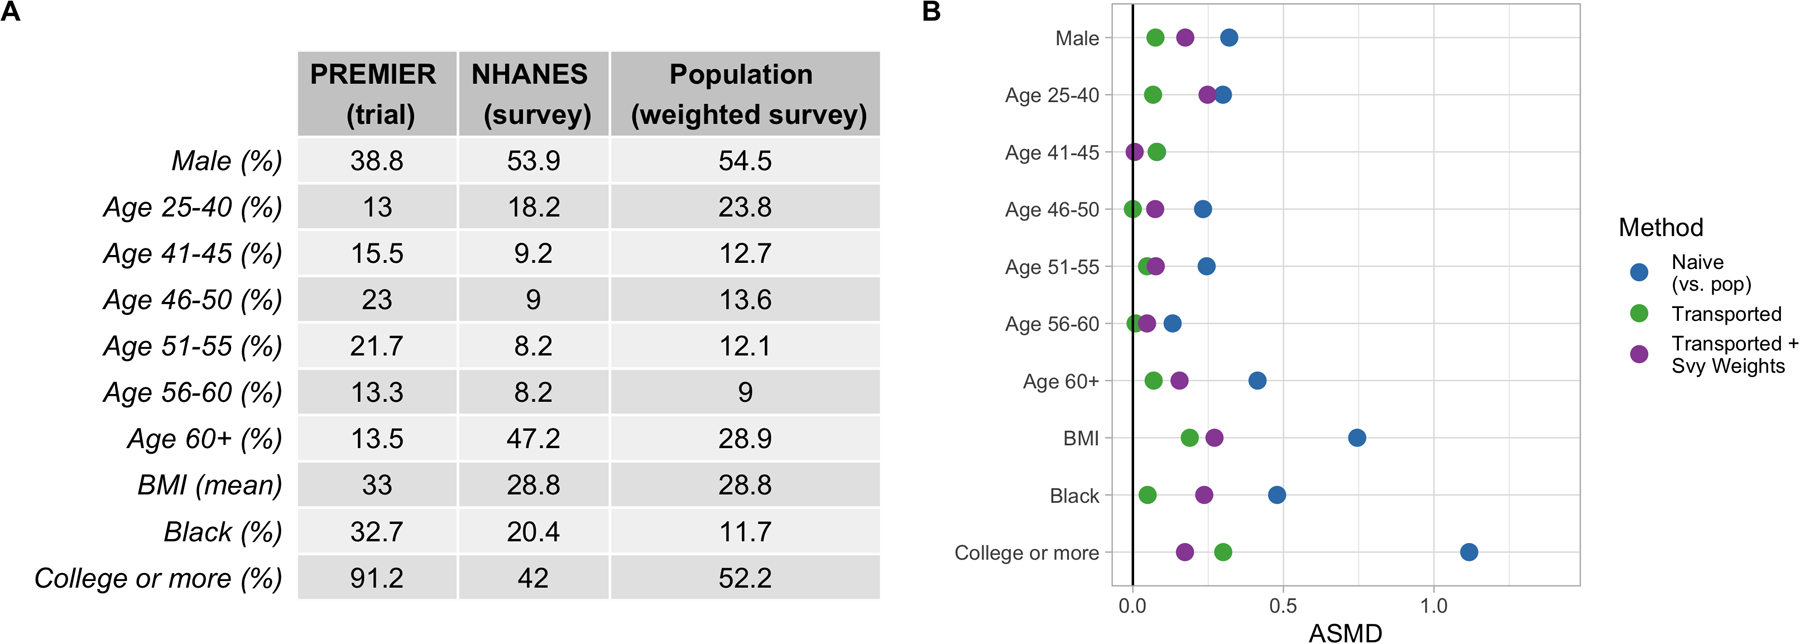
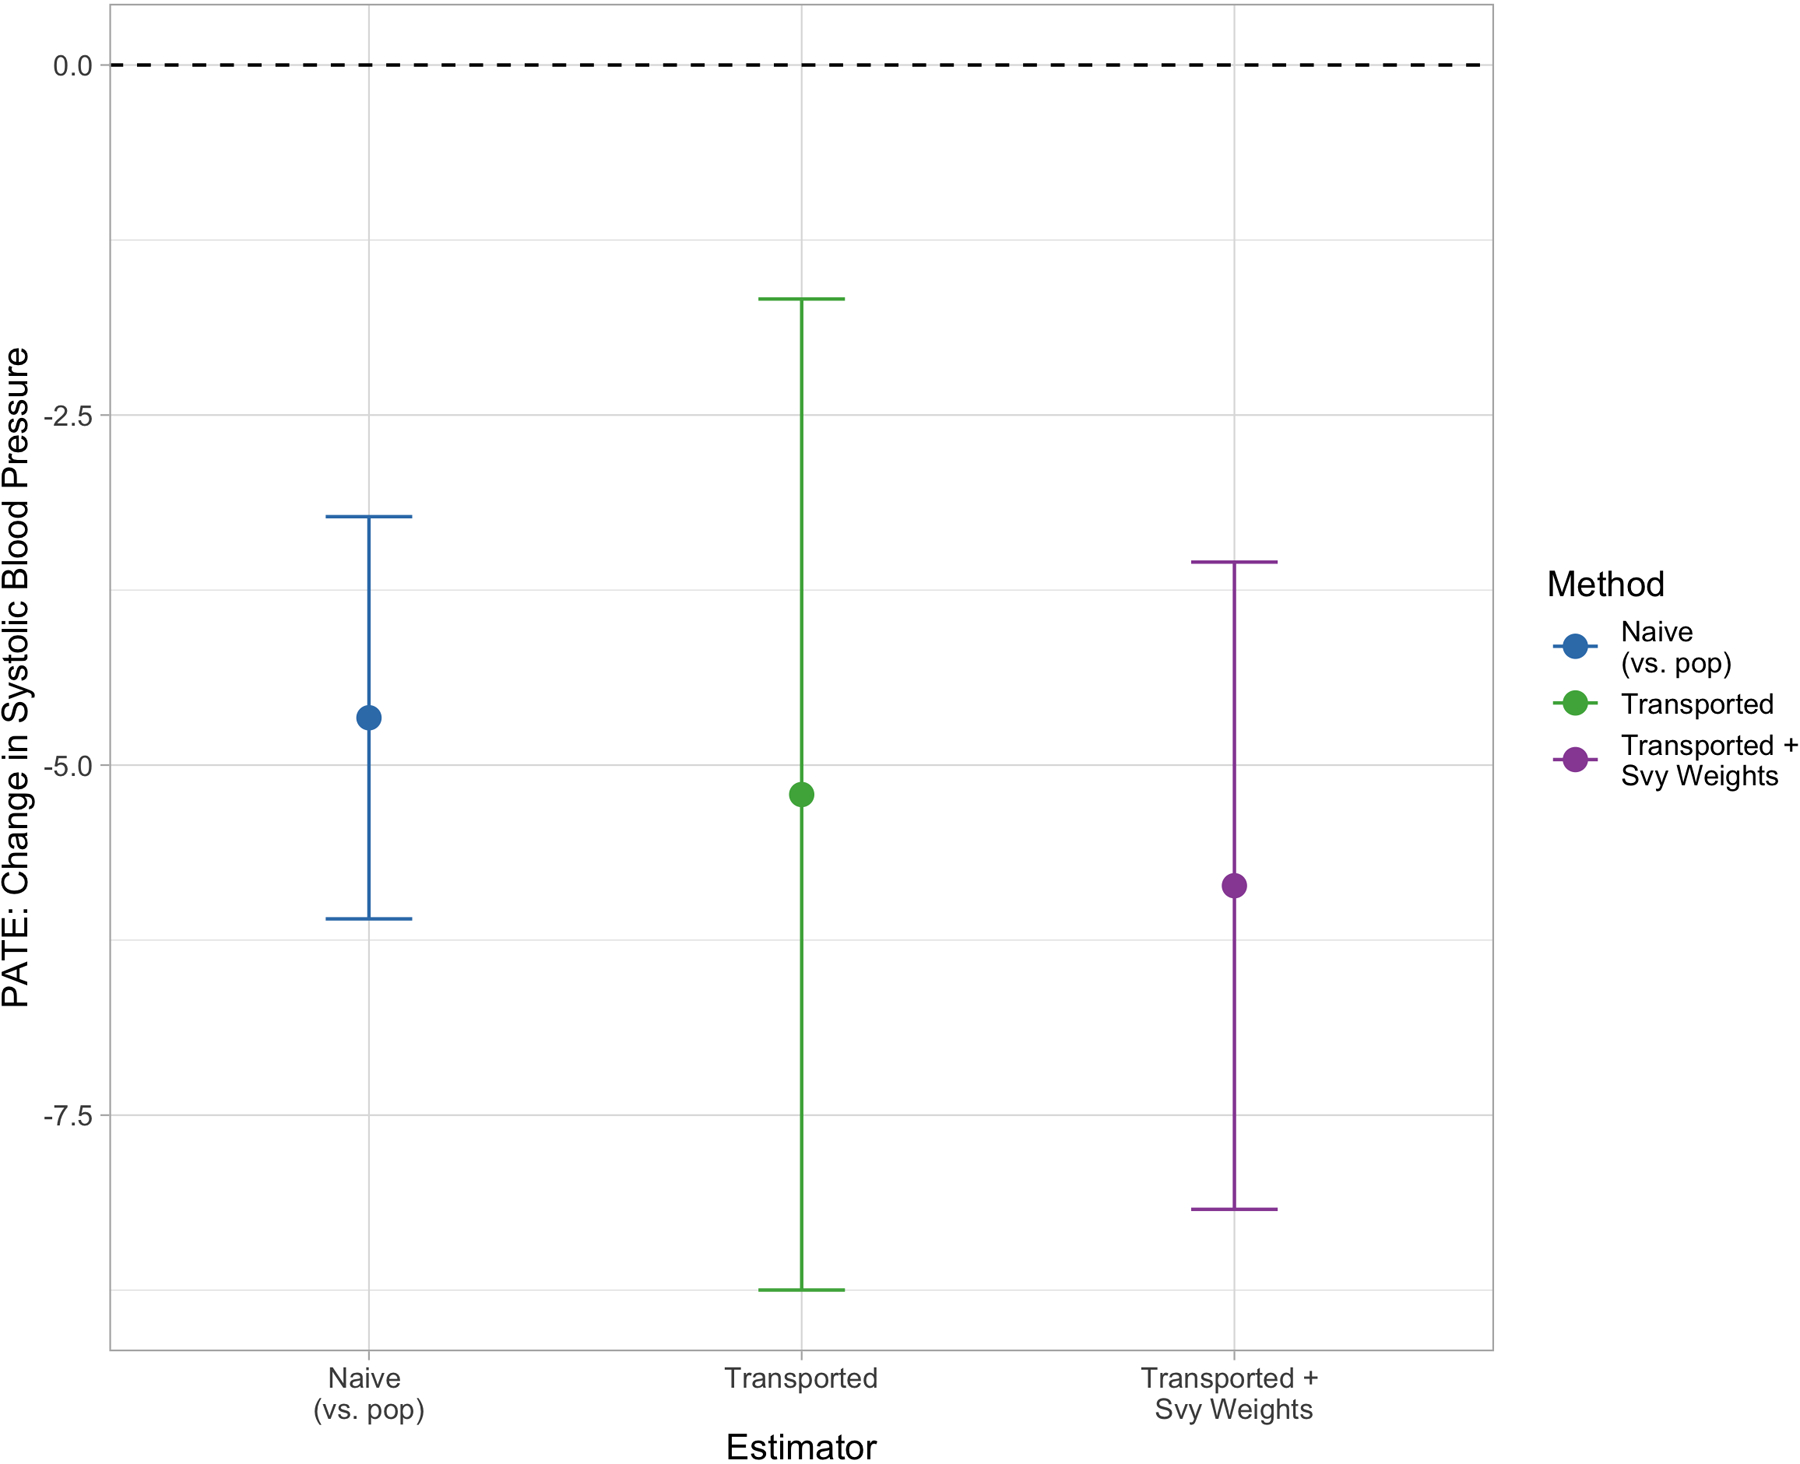
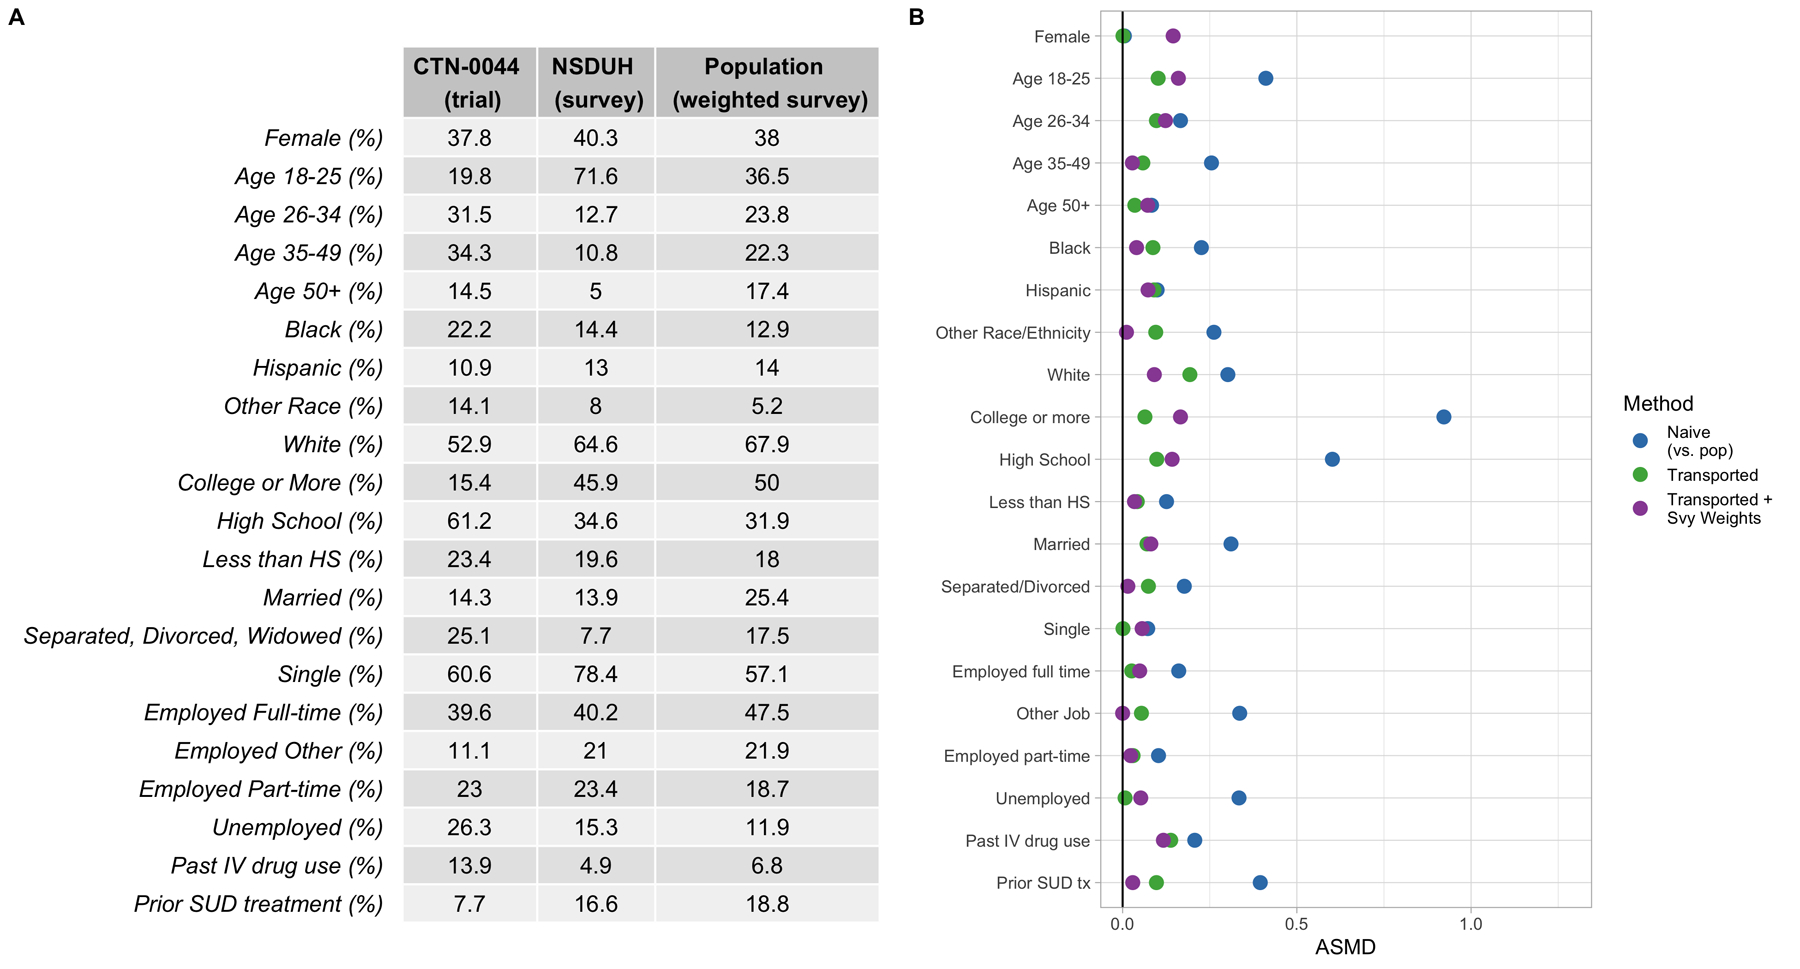
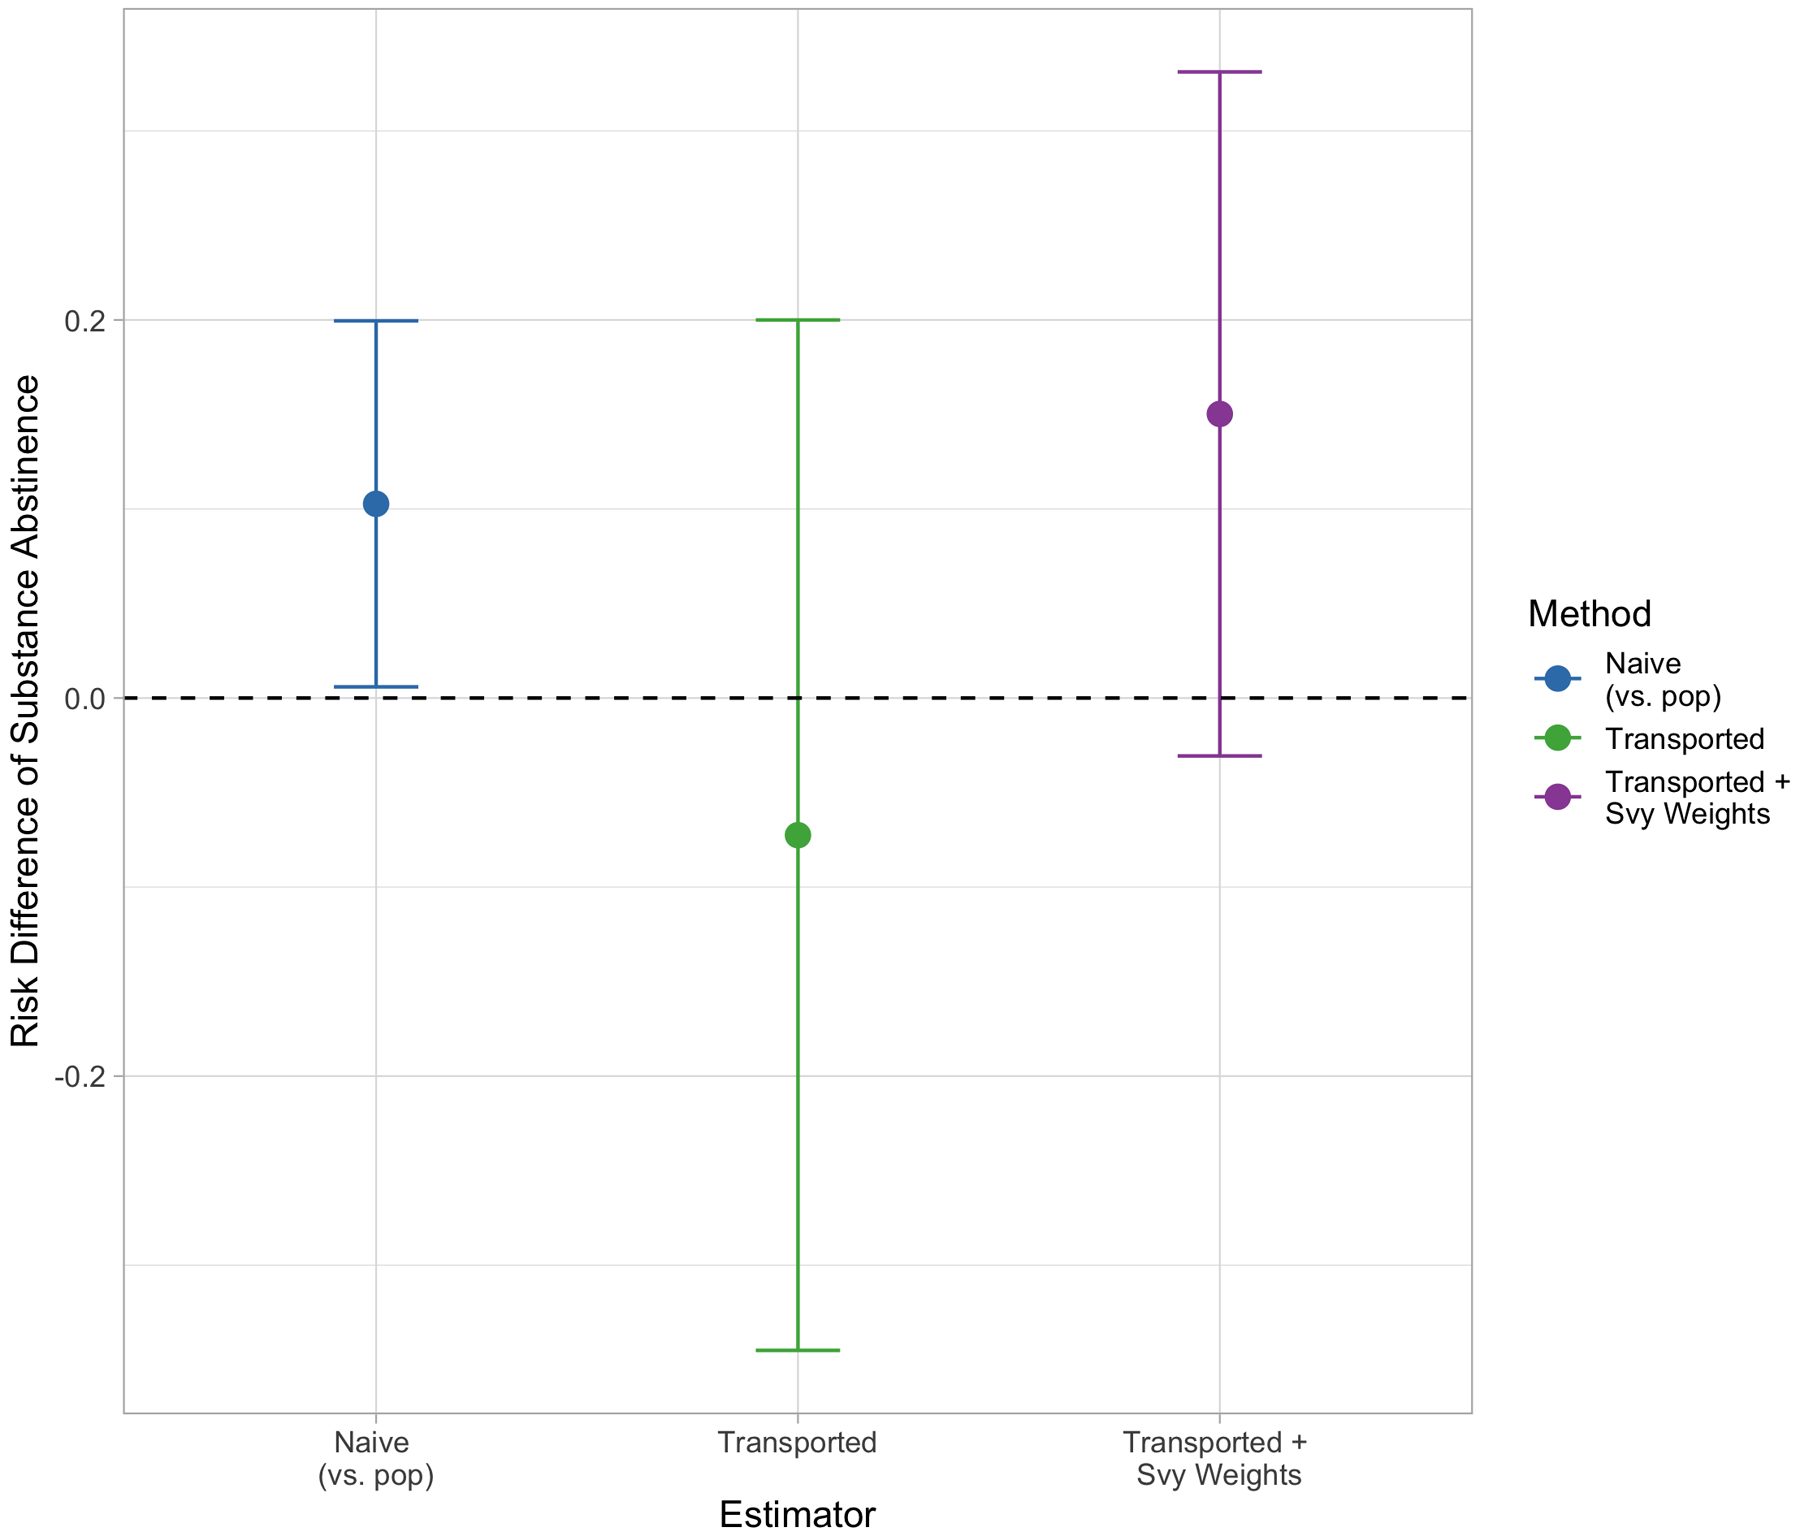
Randomized trials are considered the gold standard for estimating causal effects. Trial findings are often used to inform policy and programming efforts, yet their results may not generalize well to a relevant target population due to potential differences in effect moderators between the trial and population. Statistical methods have been developed to improve generalizability by combining trials and population data, and weighting the trial to resemble the population on baseline covariates. Large-scale surveys in fields such as health and education with complex survey designs are a logical source for population data; however, there is currently no best practice for incorporating survey weights when generalizing trial findings to a complex survey. We propose and investigate ways to incorporate survey weights in this context. We examine the performance of our proposed estimator through simulations in comparison to estimators that ignore the complex survey design. We then apply the methods to generalize findings from two trials-a lifestyle intervention for blood pressure reduction and a web-based intervention to treat substance use disorders-to their respective target populations using population data from complex surveys. The work highlights the importance in properly accounting for the complex survey design when generalizing trial findings to a population represented by a complex survey sample.

Keywords: causal inference; complex survey data; generalizability; propensity scores; transportability.


Figures

FIGURE B1
FIGURE B1
Empirical coverage of the transportability estimators using the double bootstrap approach to estimate the variance.
FIGURE B2
FIGURE B2
Relationship between γ2, the scaling parameter for survey selection, and the ASMD of survey selection probabilities between the survey sample and the target population.
FIGURE B3
FIGURE B3
Distributions of the simulated sample sizes for the trial and survey samples across the 1000 simulation runs.
FIGURE 1
FIGURE 1
Scenario of how data sources relate to each other and to the target population. The entire grey region denotes the target population, S = 1 denotes the RCT, S = 2 denotes the complex survey sample, and S = 0 denotes members of the target population not sampled into either study. Only individuals with S = 1 or S = 2 are observed, while data on individuals with S = 0 are assumed unavailable. This three-level “S” variable also assumes no overlap between trial and survey participants. This is a plausible assumption to make for policy-relevant scenarios, where the target population may be the entire US, and the study sample sizes are on the magnitudes of a few thousand.
FIGURE 2
FIGURE 2
Bias of estimating the PATE by weighting method. Each column represents a different scenario of missing a variable used to calculate survey weights in the analytic survey dataset. From top to bottom row, the γ1 “scale” parameter for how much the trial differs from the population by the Xs increases. The different colors represent the different weighting approaches: Naive trial estimate (blue), transported estimate ignoring the survey weights (green), and transported estimate using the survey weights (purple). This figure appears in color in the electronic version of this article.
FIGURE 3
FIGURE 3
Empirical 95% coverage of the PATE estimates by weighting method. Each column represents a different scenario of missing a variable used to calculate survey weights in the analytic survey dataset. From top to bottom row, the γ1 “scale” parameter for how much the trial differs from the population by the Xs increases. The different colors represent the different weighting approaches: Naive trial estimate (blue), transported estimate ignoring the survey weights (green), and transported estimate using the survey weights (purple). This figure appears in color in the electronic version of this article.
FIGURE 4
FIGURE 4
A) Covariate Distributions in PREMIER (trial) and NHANES (survey sample), along with the weighted NHANES sample (target population). B) Absolute standardized mean difference (ASMD) of covariates between the trial and target population. Points in blue reflect covariate differences between the raw trial sample and the weighted survey sample (i.e. the target population demographics). Points in green show the differences between the transport-weighted trial and survey sample. Points in purple show the differences between the transport-weighted trial and population (where the trial is weighted to be more similar to the target population).
FIGURE 5
FIGURE 5
Blood pressure reduction PATE estimates by transportability method. Points in blue reflect the naive PATE estimate, points in green show the transported PATE estimate ignoring survey weights. Points in purple show the survey-weighted transportability estimate.
FIGURE 6
FIGURE 6
A) Covariate Distributions in CTN-0044 (trial) and NSDUH (survey sample), along with the weighted NSDUH sample (target population). B) Absolute standardized mean difference (ASMD) of covariates between the trial and target population. Points in blue reflect covariate differences between the raw trial sample and the weighted survey sample (i.e. the target population demographics). Points in green show the differences between the transport-weighted trial and survey sample. Points in purple show the differences between the transport-weighted trial and population (where the trial is weighted to be more similar to the target population).
FIGURE 7
FIGURE 7
Substance abstinence PATE estimates by transportability method. Points in blue reflect the naive PATE estimate, points in green show the transported PATE estimate ignoring survey weights. Points in purple show the survey-weighted transportability estimate.

References

    1. Shadish WR, Cook TD, Campbell DT. Experimental and quasi-experimental designs for generalized causal inference. Wadsworth Cengage learning. 2002.
    1. Imai K, King G, Stuart EA. Misunderstandings between experimentalists and observationalists about causal inference. Journal of the royal statistical society: series A (statistics in society) 2008; 171(2): 481–502.
    1. Peto R, Collins R, Gray R. Large-scale randomized evidence: large, simple trials and overviews of trials. Journal of clinical epidemiology 1995; 48(1): 23–40. - PubMed
    1. Insel TR. Beyond efficacy: the STAR* D trial. American Journal of Psychiatry 2006; 163(1): 5–7. - PMC - PubMed
    1. Tipton E, Matlen BJ. Improved Generalizability Through Improved Recruitment: Lessons Learned From a Large-Scale Randomized Trial. American Journal of Evaluation 2019: 1098214018810519.

Publication types