

Pan-cancer population pharmacokinetics and exposure-safety and -efficacy analyses of atezolizumab in patients with high tumor mutational burden
- PMID: 33241650
- PMCID: PMC7689240
- DOI: 10.1002/prp2.685
Pan-cancer population pharmacokinetics and exposure-safety and -efficacy analyses of atezolizumab in patients with high tumor mutational burden
Abstract
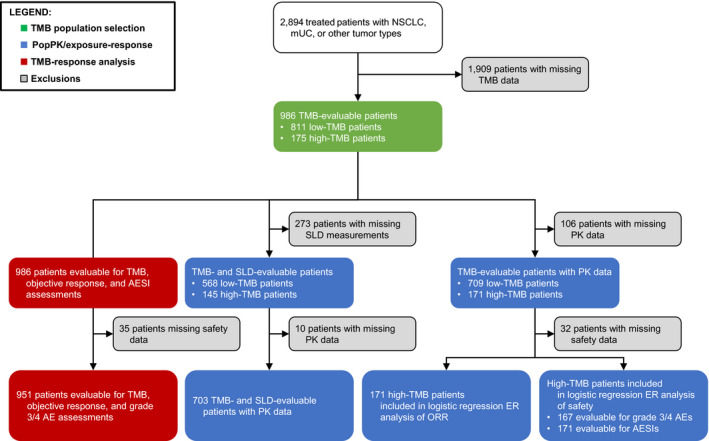
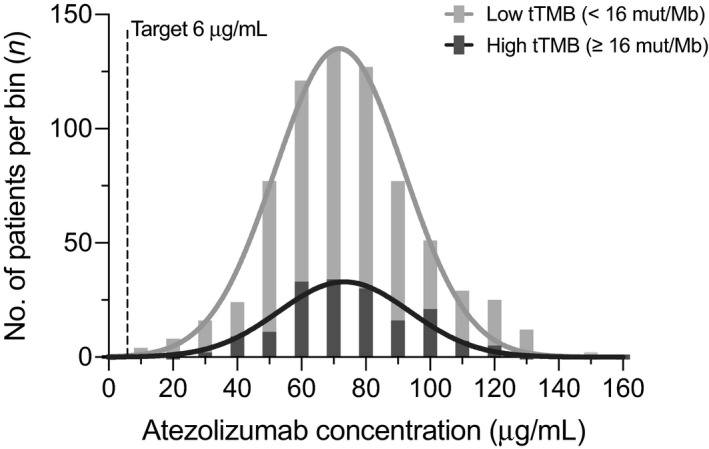
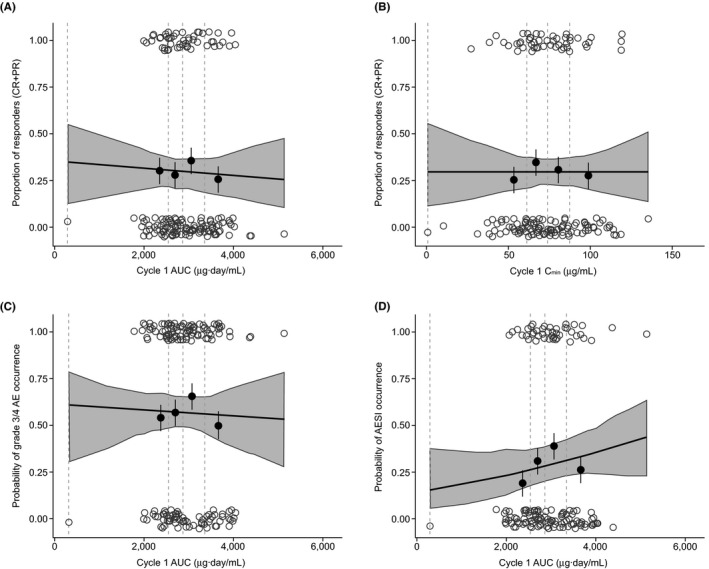
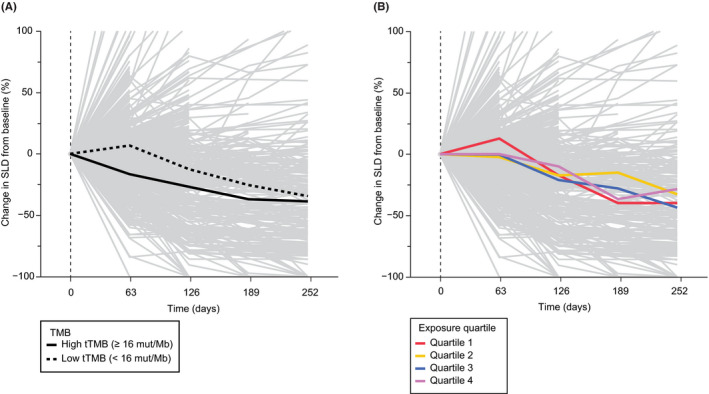
We retrospectively investigated the pharmacokinetics and exposure-efficacy/safety relationships of single-agent atezolizumab based on tissue tumor mutational burden (tTMB) status (high vs low [≥16 vs <16 mutations/megabase]) in a pan-tumor population from seven clinical trials. Data sources included the OAK, POPLAR, BIRCH, FIR, IMvigor210, IMvigor211, and PCD4989g studies; 986 of 2894 treated patients (34%) had TMB data. Exposure metrics were obtained using a prior two-compartment intravenous-infusion population-pharmacokinetics model, merged with prognostic, biomarker, efficacy, and safety variables. Baseline demographic/clinical characteristics and prognostic factors were well balanced between patients with high (n = 175) and low (n = 811) tTMB. Exposure was similar in the high- and low-tTMB subgroups, with no difference seen in the evaluable vs total treated populations. The objective response rate (ORR) was 29.7% vs 13.4%, complete response rate was 6.9% vs 3.2%, and median duration of response (95% CI) was 29.0 (18.6-NE) months vs 15.9 (12.5-20.5) months for patients with high-tTMB vs low-tTMB tumors, respectively. A flat exposure-efficacy relationship was seen for ORR in patients with high-tTMB based on the cycle 1 minimum atezolizumab concentration and area under the serum concentration time curve (AUC). A nonsignificant exposure-safety profile was seen for grade 3/4 adverse events and adverse events of special interest based on the AUC of atezolizumab in the high-tTMB population. tTMB is an additional predictive biological factor affecting response to atezolizumab, and quantitative investigations of atezolizumab exposure and relationships of exposure with safety and efficacy support the use of a 1200-mg, every 3-week regimen in a tumor-agnostic high-tTMB population.
Trial registration: ClinicalTrials.gov NCT02008227 NCT01903993 NCT02031458 NCT01846416 NCT02302807 NCT02108652 NCT01375842.
Keywords: atezolizumab; biomarkers; clinical pharmacology; mutation; pharmacokinetics; tumor.
© 2020 The Authors. Pharmacology Research & Perspectives published by John Wiley & Sons Ltd, British Pharmacological Society and American Society for Pharmacology and Experimental Therapeutics.
Conflict of interest statement
All authors disclose medical writing support funded by F. Hoffmann‐La Roche Ltd. All authors are employees of Genentech, Inc (part of the Roche Group), F. Hoffmann‐La Roche Ltd., or Roche Products Ltd. and are stockholders of F. Hoffmann‐La Roche Ltd.
Figures
References
-
- McCune JS. Rapid advances in immunotherapy to treat cancer. Clin Pharmacol Ther. 2018;103(4):540‐544. - PubMed
-
- Tang J, Yu JX, Hubbard‐Lucey VM, Neftelinov ST, Hodge JP, Lin Y. Trial watch: the clinical trial landscape for PD1/PDL1 immune checkpoint inhibitors. Nat Rev Drug Discov. 2018;17(12):854‐855. - PubMed
-
- Ingles Garces AH, Au L, Mason R, Thomas J, Larkin J. Building on the anti‐PD1/PD‐L1 backbone: combination immunotherapy for cancer. Expert Opin Investig Drugs. 2019;28(8):695‐708. - PubMed
Publication types
MeSH terms
Substances
Associated data
LinkOut - more resources
Full Text Sources
Medical
