Observational Study
. 2020 Nov 26:9:e63195.
doi: 10.7554/eLife.63195.

A novel haemocytometric COVID-19 prognostic score developed and validated in an observational multicentre European hospital-based study

Affiliations
Observational Study

A novel haemocytometric COVID-19 prognostic score developed and validated in an observational multicentre European hospital-based study

Joachim Linssen et al. Elife. .

Abstract

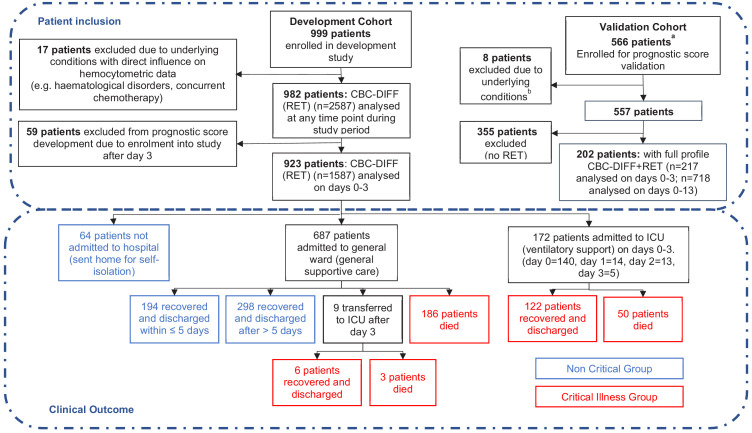
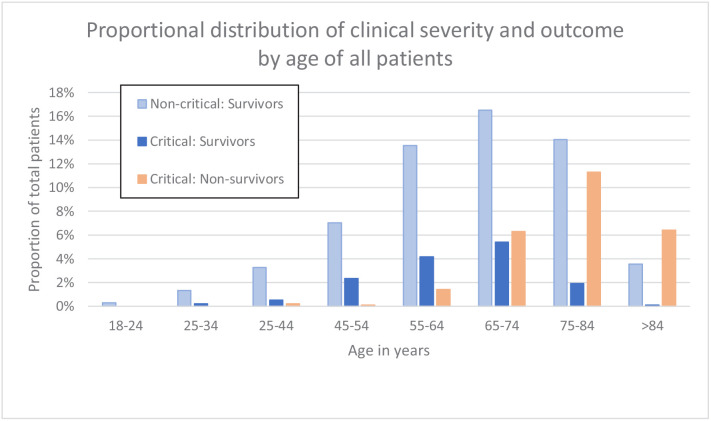
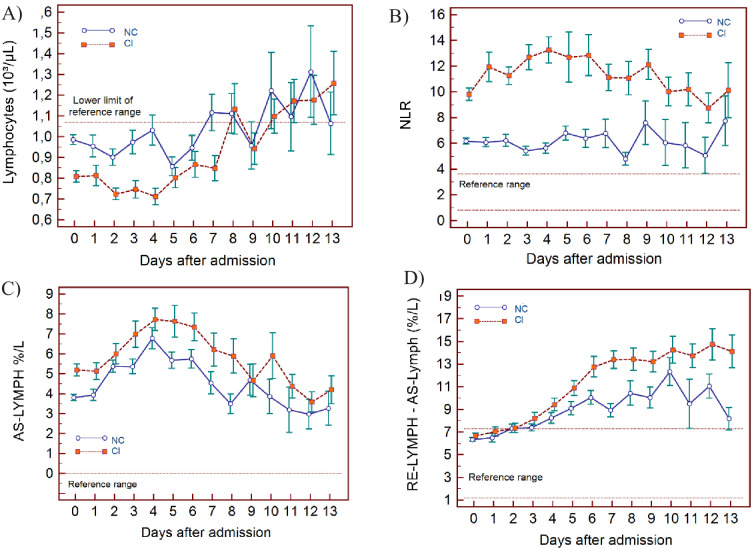
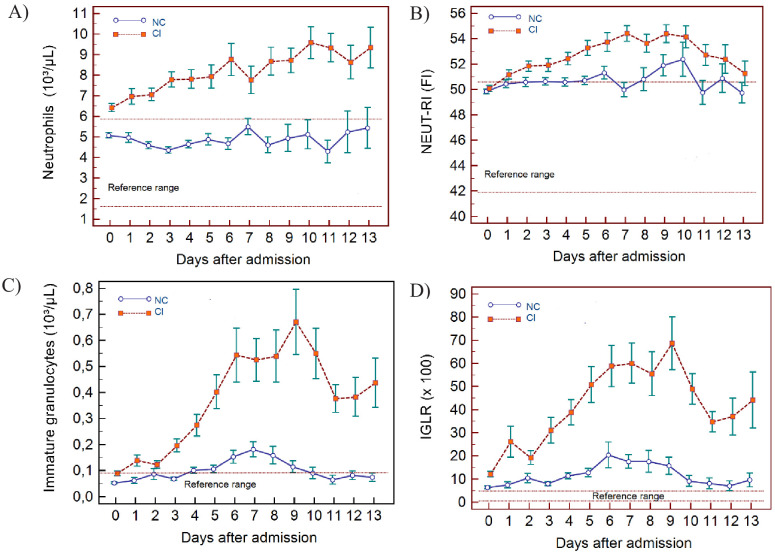
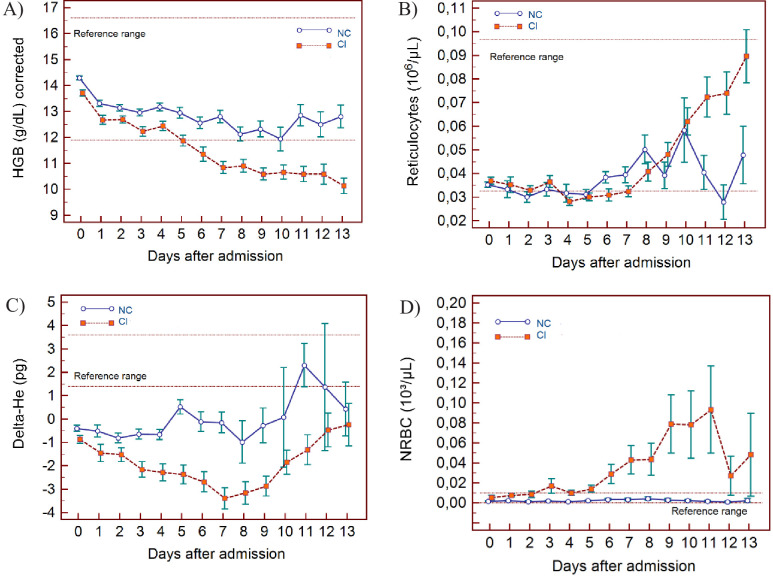
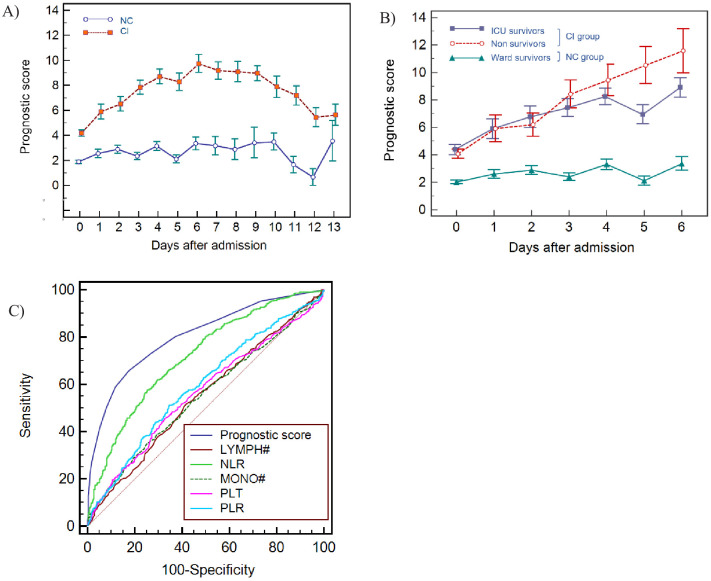
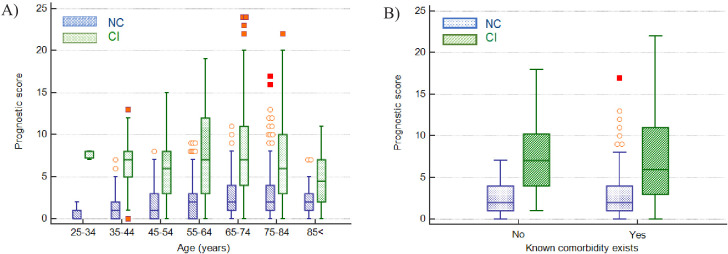
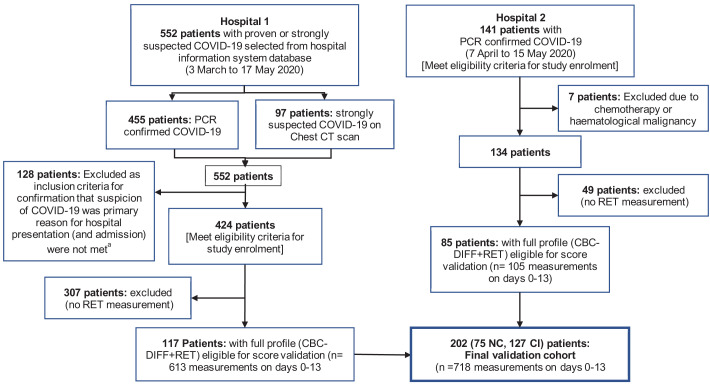
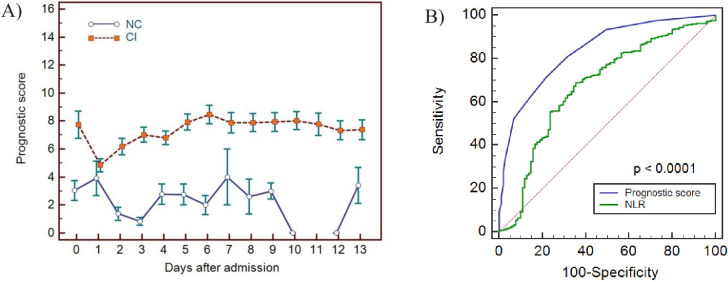
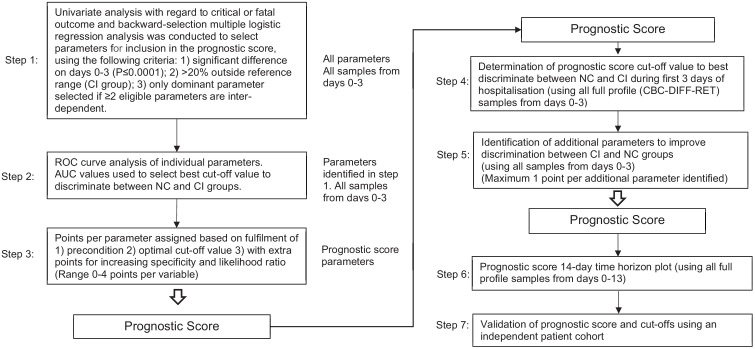
COVID-19 induces haemocytometric changes. Complete blood count changes, including new cell activation parameters, from 982 confirmed COVID-19 adult patients from 11 European hospitals were retrospectively analysed for distinctive patterns based on age, gender, clinical severity, symptom duration, and hospital days. The observed haemocytometric patterns formed the basis to develop a multi-haemocytometric-parameter prognostic score to predict, during the first three days after presentation, which patients will recover without ventilation or deteriorate within a two-week timeframe, needing intensive care or with fatal outcome. The prognostic score, with ROC curve AUC at baseline of 0.753 (95% CI 0.723-0.781) increasing to 0.875 (95% CI 0.806-0.926) on day 3, was superior to any individual parameter at distinguishing between clinical severity. Findings were confirmed in a validation cohort. Aim is that the score and haemocytometry results are simultaneously provided by analyser software, enabling wide applicability of the score as haemocytometry is commonly requested in COVID-19 patients.

Keywords: COVID-19; complete blood count; haemocytometry; human; intensive care; medicine; prognostic score.


Conflict of interest statement

JL, JS, MM is a permanent employee of Sysmex Europe GMBH who provided free of charge study reagents to the study centres. AE, MB, MS, GP, Sv, HR, AV, JG, JR, Ed, IM, AD, VS, HA, KD, SB, LV, YK, ML No competing interests declared, Av has an ad hoc consultancy agreement with Sysmex Europe GMBH who provided free of charge study reagents to the study centres.

Figures

Figure 1.
Figure 1.. Patient flow chart from prognostic score development and validation cohorts, including sample numbers for CBC-Diff (with or without RET) and clinical outcome.
Footnote. (a) Details of how the validation patient cohort patients were selected are provided in Figure 10 , (b) the exclusion criteria for the validation cohort were the same as for the development patient cohort.
Figure 2.
Figure 2.. Clinical severity and outcome by age of all patients.
Figure 3.
Figure 3.. Trends of lymphocyte-related parameters over 14 days of hospitalisation in critical illness (CI) and non-critical (NC) patients.
Note: 14 days of hospitalisation refers to Day 0 (day of admission) plus the next 13 days after admission. The normal reference range is depicted by the area between the dotted horizontal lines. Vertical bars indicate standard error of the mean (SEM). (A) Absolute lymphocyte count (LYMPH), (B) neutrophil-to-lymphocyte ratio (NLR), (C) antibody-synthesising lymphocytes as percentage of lymphocytes (AS-LYMPH%/L), (D) reactive lymphocytes minus AS-LYMPH (as a percentage of lymphocytes). The number of sample measurements available per day for the trend analysis for the parameters plotted per patient group are shown in Figure 3—source data 1.
Figure 4.
Figure 4.. Trends of neutrophil-related parameters over 14 days of hospitalisation in critical illness (CI) and non-critical (NC) patients.
Note: 14 days refers to day 0 (day of admission) plus the next 13 days after admission. The normal reference range is depicted by the area between the dotted horizontal lines. Vertical bars indicate standard error of the mean (SEM). (A) Absolute neutrophil count (NEUT), (B) neutrophil reactivity index (NEUT-RI), (C) immature granulocytes (IG), (D) Immature granulocyte-to-lymphocyte ratio *100 (IGLR). The number of sample measurements available per day for the trend analysis for the parameters plotted per patient group are shown in Figure 4—source data 1.
Figure 5.
Figure 5.. Trends of monocyte parameters over 14 days of hospitalisation in critical illness (CI) and non-critical (NC) patients.
Note: 14 days of hospitalisation refers to day 0 (day of admission) plus the first 13 days after admission. The normal reference range is depicted by the area between the dotted horizontal lines. Vertical bars indicate standard error of the mean (SEM). (A) Absolute monocyte count (MONO), (B) reactive monocytes as a percentage of monocytes (RE-MONO%/M). The number of sample measurements available per day for the trend analysis for the parameters plotted per patient group are shown in Figure 5—source data 1.
Figure 6.
Figure 6.. Trends of red blood cell-related parameters over 14 days of hospitalisation in critical illness (C) and non-critical (NC) patients.
Note: 14 days of hospitalisation refers to day 0 (day of admission) plus the first 13 days after admission. The normal reference range is depicted by the area between the dotted horizontal lines. Vertical bars indicate standard error of the mean (SEM). (A) Haemoglobin (HGB) corrected for age and gender, (B) reticulocyte count (RET), (C) difference in haemoglobinisation of reticulocytes and red blood cells (DELTA-He), (D) nucleated red blood cells (NRBC). The number of sample measurements available per day for the trend analysis for the parameters plotted per patient group are shown in Figure 6—source data 1.
Figure 7.
Figure 7.. Trends of platelet parameters over 14 days of hospitalisation in critical illness (CI) and non-critical (NC) patients.
Note: 14 days refers to day 0 (day of admission) plus the first 13 days after admission. The normal reference range is depicted by the area between the dotted horizontal lines. Vertical bars indicate standard error of the mean (SEM). (A) Platelet count (PLT), (B) platelet-to-lymphocyte ratio (PLR), (C) immature platelet count (IPF#) (D) immature platelet fraction (IPF%). The number of sample measurements available per day for the trend analysis for the parameters plotted per patient group are shown in Figure 7—source data 1.
Figure 8.
Figure 8.. Haemocytometric COVID-19 prognostic score prediction of clinical severity in the development cohort.
(A) Development cohort prognostic score 14-day hospitalisation time horizon (day of admission plus the first 13 days thereafter) comparing non-critical (NC) and critical illness (CI) groups. Points shown are mean values with vertical bars representing SEM (B) development cohort prognostic score 7-day hospitalisation time horizon comparing outcomes for the critical illness group (recovered with ICU or died) and the non-critical group (recovered without ICU). Points shown are mean values with vertical bars representing SEM, (C) ROC curve to compare the capability of prediction of critical illness disease progression of the prognostic score, absolute lymphocyte count (LYMPH#), neutrophil-to-lymphocyte ratio (NLR), absolute monocyte count (MONO#), platelet count (PLT) and platelet-to-lymphocyte ratio (PLR) for development cohort incorporating all measurements over the initial 14-day period of hospitalisation. The number of measurements for each day of hospitalisation that were available per patient group are shown in Figure 8—source data 1. There were markedly fewer measurements for the second week, notably in the NC group which may have contributed to bias.
Figure 9.
Figure 9.. Impact of age and presence of comorbidities on prediction of disease severity.
(A) Box and whisker plots of prognostic score values for NC and CI groups segregated by age. The prognostic score can predict severity independent of age, therefore potentially assisting in identifying young patients at risk for severe disease progression as well as older patients not at risk. (B) Box and whisker plots of prognostic score values for NC and CI groups segregated by comorbidities in the 75-84-year-old group, as an illustrative example. The prognostic score is significantly higher in patients with severe disease progression independent of the presence of comorbidities. Please refer to Table 6 for more detailed information on all age groups.
Figure 10.
Figure 10.. Flow chart showing inclusion and exclusion of validation cohort patient.
Abbreviations: NC, non-critical patient group; CI, critical illness patient group. (a) The following criteria were used to ensure selection of only those patients for whom the primary presentation at hospital was related to COVID-19: Emergency department location on day 0, provisional diagnosis of pneumonia, if admitted, with admission to a general ward, internal medicine, ICU or anaesthesia (critical care).
Figure 11.
Figure 11.. Haemocytometric COVID-19 prognostic score prediction of clinical severity in the validation cohort.
(A) Validation cohort prognostic score 14-day hospitalisation time horizon comparing non-critical (NC) and critical illness (CI) groups, (B) ROC curve comparisons of prognostic score and NLR over 14 days. The prognostic score AUC (0.838, 95%CI 0.809-0.864) was significantly higher (P<0.0001) than the NLR AUC (0.673,95% CI 0.637-0.707). The number of measurements for each day of hospitalisation that were available per patient group are shown in Figure 11—source data 1. Overall, there were relatively few measurements per day for the NC group which has contributed to greater variance per time point.
Figure 12.
Figure 12.. Flow chart illustrating steps involved in prognostic score development.
Abbreviations: NC, non-critical patient group; CI, critical illness patient group; ROC, receiver operating characteristics (curve); AUC, area under the curve.

References

    1. Ayres LS, Sgnaolin V, Munhoz TP. Immature granulocytes index as early marker of Sepsis. International Journal of Laboratory Hematology. 2019;41:392–396. doi: 10.1111/ijlh.12990. - DOI - PubMed
    1. Briggs CJ, Linssen J, Longair I, Machin SJ. Improved flagging rates on the sysmex XE-5000 compared with the XE-2100 reduce the number of manual film reviews and increase laboratory productivity. American Journal of Clinical Pathology. 2011;136:309–316. doi: 10.1309/AJCPDLR4KGKAFW4W. - DOI - PubMed
    1. Buttarello M. Laboratory diagnosis of Anemia: are the old and new red cell parameters useful in classification and treatment, how? International Journal of Laboratory Hematology. 2016;38:123–132. doi: 10.1111/ijlh.12500. - DOI - PubMed
    1. Caramelo F, Ferreira N, Oliveiros B. Estimation of risk factors for COVID-19 mortality - preliminary results. medRxiv. 2020 doi: 10.1101/2020.02.24.20027268. - DOI
    1. Chabot-Richards DS, George TI. White blood cell counts: reference methodology. Clinics in Laboratory Medicine. 2015;35:11–24. doi: 10.1016/j.cll.2014.10.007. - DOI - PubMed

Publication types

MeSH terms