. 2020 Dec 15;53(6):1182-1201.e8.
doi: 10.1016/j.immuni.2020.10.024. Epub 2020 Nov 25.

An Integrated Epigenomic and Transcriptomic Map of Mouse and Human αβ T Cell Development

Affiliations

An Integrated Epigenomic and Transcriptomic Map of Mouse and Human αβ T Cell Development

Laura B Chopp et al. Immunity. .

Abstract

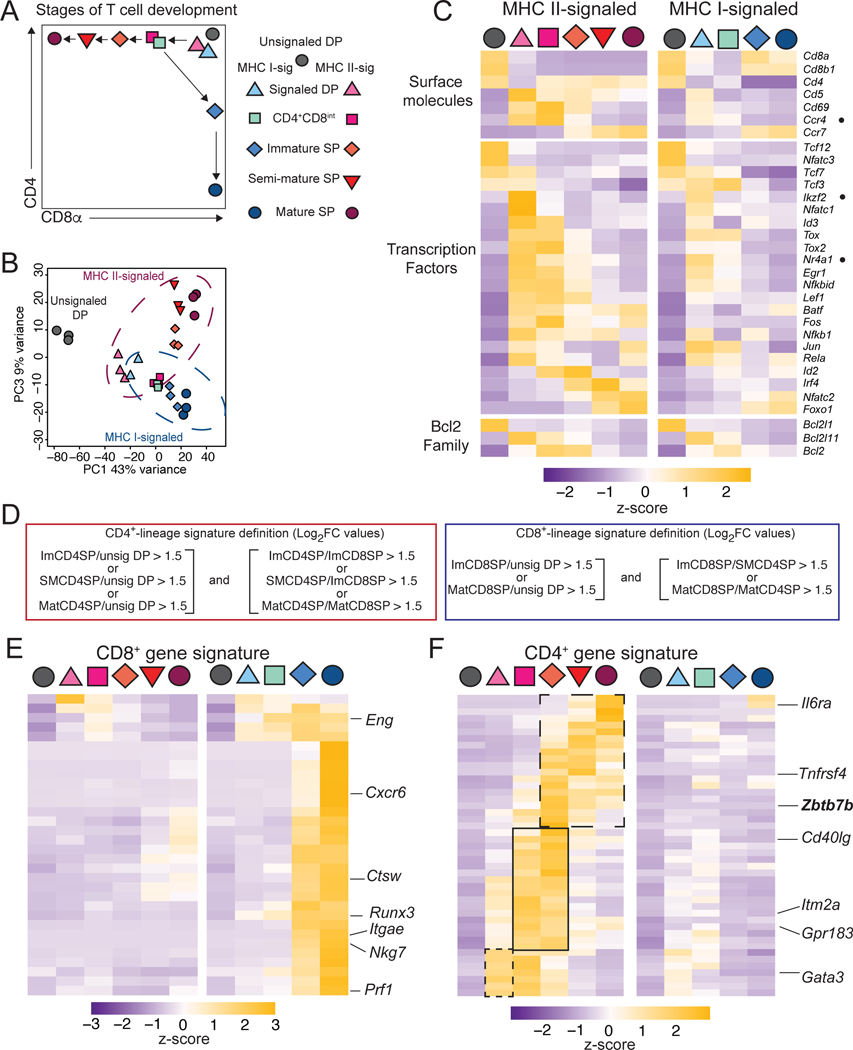
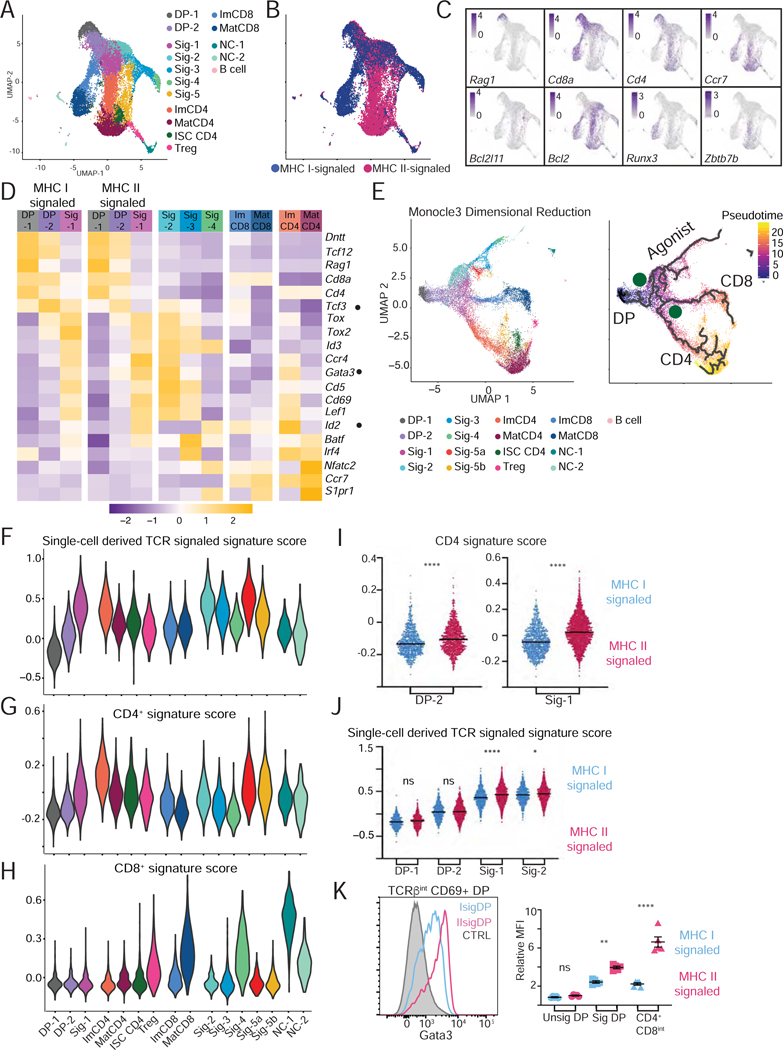
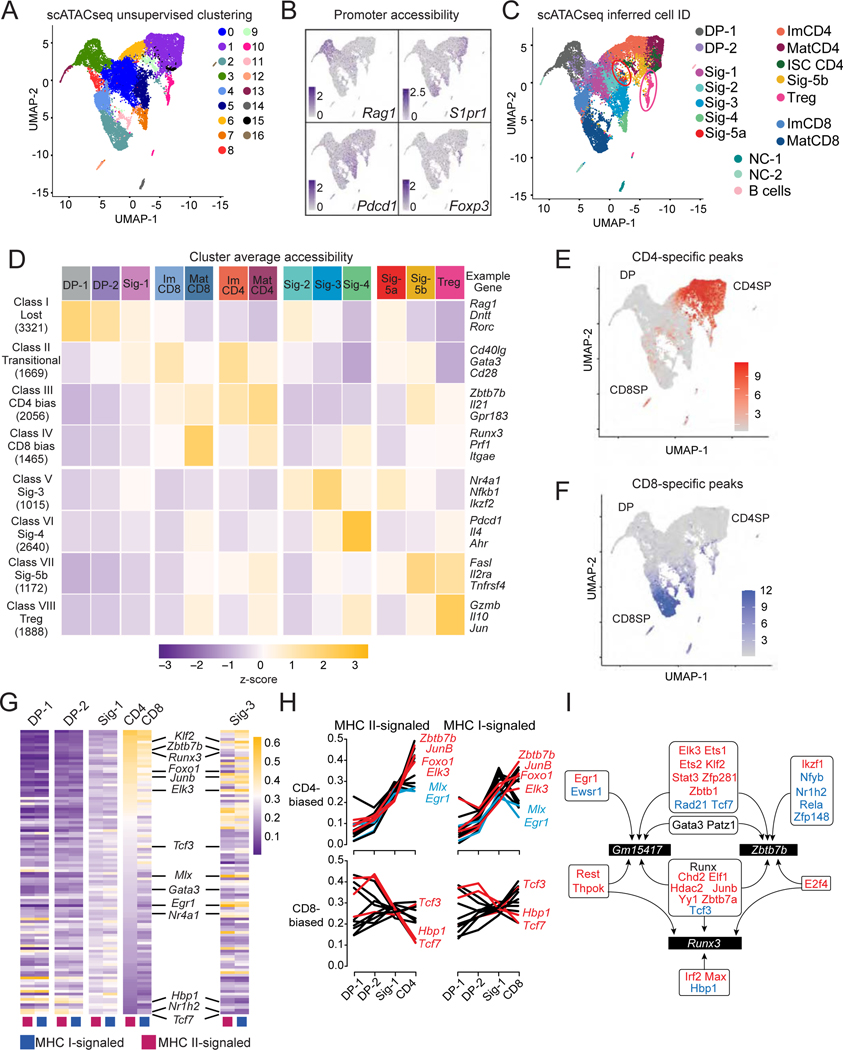
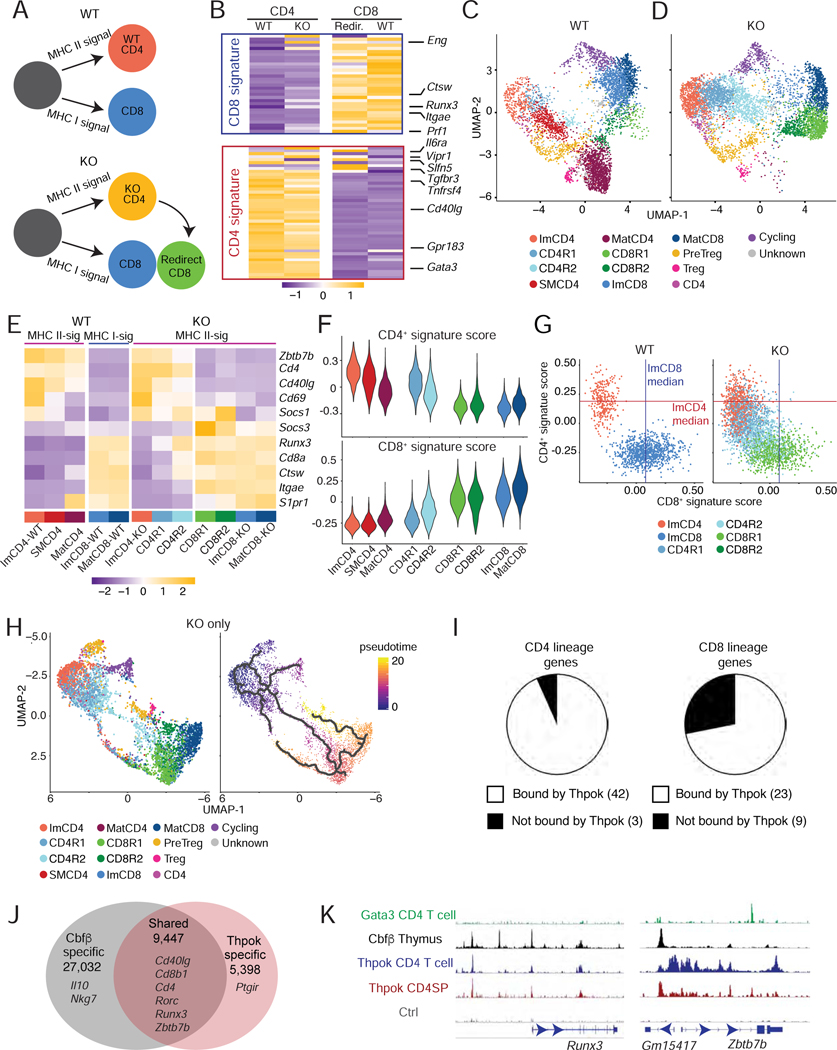
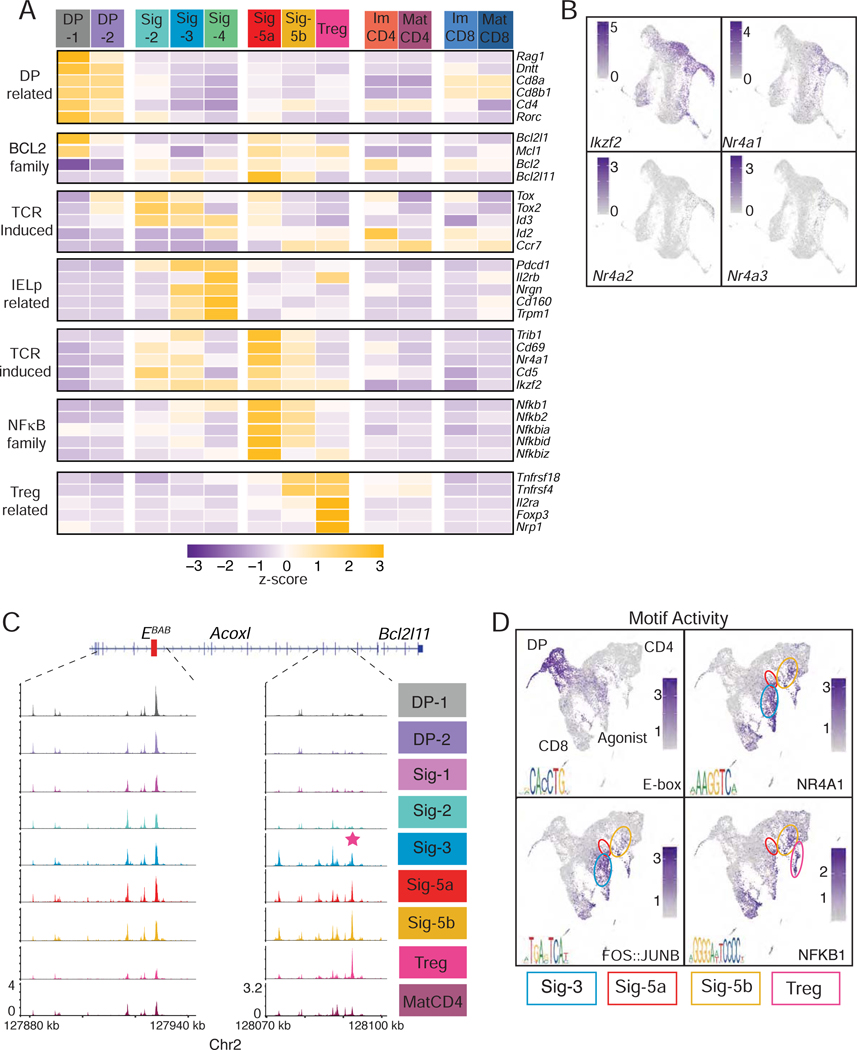
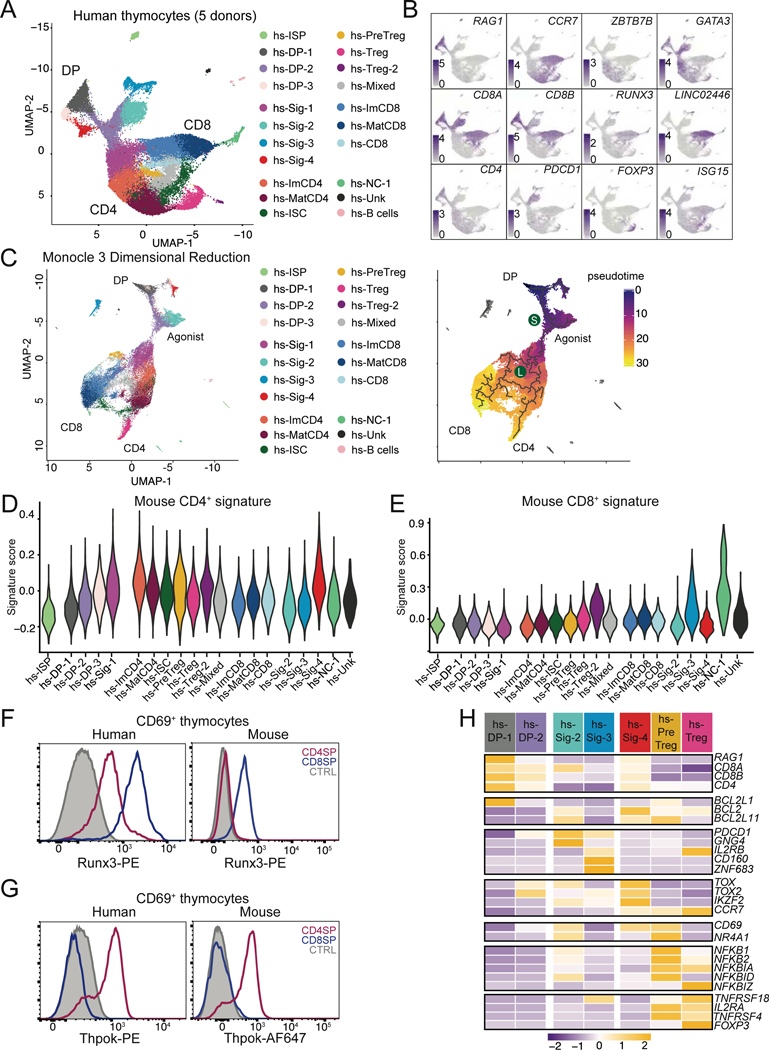
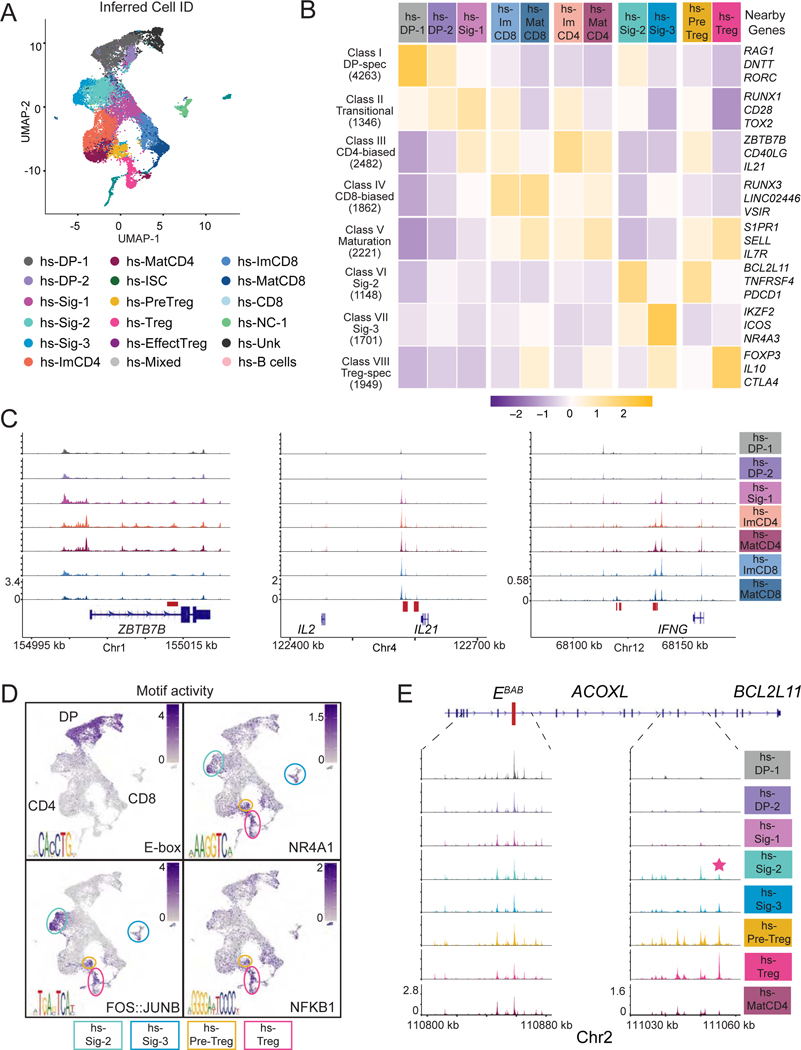
αβ lineage T cells, most of which are CD4+ or CD8+ and recognize MHC I- or MHC II-presented antigens, are essential for immune responses and develop from CD4+CD8+ thymocytes. The absence of in vitro models and the heterogeneity of αβ thymocytes have hampered analyses of their intrathymic differentiation. Here, combining single-cell RNA and ATAC (chromatin accessibility) sequencing, we identified mouse and human αβ thymocyte developmental trajectories. We demonstrated asymmetric emergence of CD4+ and CD8+ lineages, matched differentiation programs of agonist-signaled cells to their MHC specificity, and identified correspondences between mouse and human transcriptomic and epigenomic patterns. Through computational analysis of single-cell data and binding sites for the CD4+-lineage transcription factor Thpok, we inferred transcriptional networks associated with CD4+- or CD8+-lineage differentiation, and with expression of Thpok or of the CD8+-lineage factor Runx3. Our findings provide insight into the mechanisms of CD4+ and CD8+ T cell differentiation and a foundation for mechanistic investigations of αβ T cell development.

Keywords: CD4 T cells; CD8 T cells; Gene regulatory networks; Human thymus; T cell development; Thpok; Transcriptional regulation; single-cell ATACseq; single-cell RNAseq; thymic selection.


Conflict of interest statement

Declaration of Interests The authors declare no competing interests.

Figures

Figure 1:
Figure 1:. Transcriptomic analyses of thymocyte subsets
(A) Populations sorted for RNA-seq analyses. Unsignaled (grey) MHC I- (blue) and MHC II- (red) signaled subsets are shown on a schematic CD4-CD8 expression plot. (B) PCA displays cell subsets according to PC1 and PC3. Each symbol represents an individual biological replicate. (C) Heatmap shows row-standardized (Z-scores of reads per million [RPM] values) mRNA expression in populations identified as defined in (A). (D) Definition of CD4+ and CD8+ signature genes shown in (E,F). (E, F) Heatmaps (as in [C]) of CD8+- (E) and CD4+- (F) lineage signature gene expression. CD4+ signature genes differing by their kinetics of expression are boxed (F). See also Figure S1
Figure 2:
Figure 2:. Single cell RNAseq analysis of mouse αβ lineage thymocyte selection
(A-H) MHC I- and MHC II-signaled thymocytes (see Fig. S2AB) were analyzed by scRNAseq. Data integrates two biological replicates from each genotype. (A) UMAP plot displays thymocytes color-coded according to their distribution into clusters (names on the right). Sig = signaled; Im = immature; Mat = mature; NC = non-conventional; ISC = interferon stimulated cluster. (B) Same UMAP plot as in (A) with cells colored according to their MHC restriction. (C) Scaled expression of indicated genes is shown on UMAP plots. (D) Heatmap of average gene expression in indicated clusters (right three sets of columns) or in their MHC-I or MHC II-signaled subsets (left two sets of columns). Data is row-standardized. (E) (Left) UMAP plot of thymocytes, generated after Monocle3-derived dimensional reduction, colorcoded by Seurat-defined clusters. (Right) developmental trajectories (thick lines) defined by pseudotime analysis is shown on cells color-coded according to their pseudotime value. DP: DP thymocytes; Agonist, CD4, and CD8 indicate the trajectories emerging at branchpoint S (selection) and L(lineage). (F-H) Violin plots show cluster-based average expression scores of (F) TCR signal induced genes, (Table S1), and (G) CD4+- or (H) CD8+-lineage signature genes (Fig. 1D–F and Table S1). (I) Expression score of CD4+ signature genes in DP-2 and Sig-1 cells, MHC I- (blue) vs. MHC II- (pink) signaled. **** p < 0.0001 (unpaired student’s t-test with Welch’s correction). (J) Expression score of TCR signal induced genes in DP-1, DP-2, Sig-1, and Sig-2 cells displayed as in (I). * p < 0.01; **** p < 0.0001 (one-way ANOVA and Sidak’s Multiple Comparisons Test). (K) Overlaid histograms (left) and mean fluorescence intensity (MFI, right) of intracellular Gata3 protein on signaled (CD69+) DP thymocytes from B2m- or H2-Ab1-deficient mice, gated as in Fig. S1E. MFI is expressed relative to CTRL (wild-type CD69 DP thymocytes). ** p < 0.005, **** p < 0.0001 (one-way ANOVA and Sidak’s Multiple Comparisons Test). Error bars show SEM. See also Figure S2
Figure 3:
Figure 3:. Single cell ATACseq analyses
(A-J) MHC I- and MHC II-signaled thymocytes were prepared as in Fig. S2AB for scATACseq. Data integrates two biological replicates from each genotype. (A) UMAP plot displays thymocytes color-coded according to their cluster distribution. (B) UMAP plots shows scaled accessibility scores at promoter (2 kb segment upstream of transcription start site) of indicated genes. (C) UMAP plot shows cells color-coded according to scRNAseq-based IID. NC = non-conventional. Circles denote Sig-5a (red) and Tregs (pink). (D) Heatmap shows row-standardized accessibility of 15,226 OCR differentially accessible between any two IID-defined cell groups (columns) and classified by K-means clustering (rows). Gene assignment of OCRs performed by Homer; example genes are indicated. (E, F) UMAP plot shows scaled accessibility scores for individual cells at CD4+- and CD8+-lineage specific peaks. (G) Heatmap shows gene set expression scores for each of the 106 CellOracle defined transcription factor activities (TA) (rows) in MHC I- and MHC II-signaled cells from indicated clusters (columns). TA are ranked by decreasing score in MHC II-signaled ImCD4 cells. (H) Line graphs depict the scores of the top 15 significantly CD4+-biased (top) and the 12 significantly CD8+-biased TA (bottom) across MHC II-signaled (left) and MHC I-signaled (right) DP-1, DP-2, Sig-1, ImCD4 and ImCD8 cells. (I) Schematic showing transcription factors predicted by CellOracle and AU cell to bind the Runx3 or Zbtb7b locus (including Zbtb7b and Gm15417). Red and blue font indicate factors identified as CD4+- and CD8+-biased, respectively. Gata3, Runx factors and Patz1 (Mazr), identified as neither CD4+- nor CD8+-biased, were previously shown to bind Zbtb7b and Gm15417 (see text for references). Arrows indicate predicted binding. See also Figures S2–3 and Tables S3–S6
Figure 4:
Figure 4:. Transcriptomic and genomic footprint of Thpok
(A) Schematic development of wild-type and Thpok-deficient thymocytes. Thpok-deficient MHC-II restricted cells differentiate into immature CD4+ SP thymocytes before being re-directed into the CD8+-lineage. (B) Heatmap shows row-standardized (Z-scored RPM values) expression of CD8+ and CD4+ signature genes (Fig. 1D–F and Table S1) in immature CD4+ SP (left) or CD8+ SP (right) Thpok-sufficient (WT) or -deficient (KO) thymocytes sorted as indicated in Fig. S4A. (C-H) scRNAseq comparison of Thpok-sufficient (WT) and -deficient (KO) thymocytes (detailed genotype information in Fig. S4E). Data integrates two biological replicates from each genotype. (C, D) UMAP plots displaying WT (C) and KO (D) thymocytes, color-coded by clusters. (E) Heatmap shows row-standardized expression (Z-scores of average values) of genes in indicated clusters or genotype-defined cluster subsets (for ImCD4, ImCD8 and MatCD8 clusters). (F) Violin plots show scores for the CD4+- and CD8+-lineage signature in cell clusters as shown in (C, D). (G) Scatter plots show expression scores for the CD4+- and CD8+-lineage signatures in individual WT and KO cells from the indicated clusters. Lines indicate median scores for the CD8+-lineage signature in WT ImCD8 cells and for the CD4+-lineage signature in WT ImCD4 cells. (H) Thpok KO thymocytes are shown on UMAP plot generated after Monocle3-derived dimensional reduction, and colored-coded by Seurat-defined clusters (left) or pseudotime value (right). Thick lines (right) are developmental trajectories defined by pseudotime analysis. (I-K) ChIP-seq on sorted Zbtb7bBio/+ Rosa26BirA+ (Thpok) and Zbtb7b+/+ Rosa26BirA+ (Ctrl) CD4+ SP thymocytes. (I) Pie charts display number of genes within the CD4+ and CD8+-lineage signatures (Fig. 1D–F and Table S1) near ChIP-seq Thpok binding sites annotated by Homer. (J) Venn diagram depicts numbers of shared and unique binding sites (peaks) of Thpok and Cbfβ (GSE90794); relevant genes are shown. (K) ChIP-seq traces for indicated factors on Runx3 and Zbtb7b loci. ChIP-seq data for Gata3 (CD4 T cells) from GSE20898, and for Cbfβ (thymocytes) from GSE90794. See also Figure S4
Figure 5:
Figure 5:. Agonist-signaled cell developmental trajectories
(A-B) scRNA-seq of thymocytes sorted from MHC II- and β2m-deficient mice, as in Fig. 2. (A) Heatmap shows row-standardized gene expression (Z-scored cluster averages). (B) Scaled expression of indicated genes is shown on UMAP plots generated as in Fig. 2A. (C-D) scATACseq-seq of thymocytes sorted from MHC II- and β2m-deficient mice, as in Fig. 3. (C) Genome browser tracks show average scaled scATACseq signals at Bcl2l11 for all cells sharing the indicated IID (right). Red box on DNA track indicates the EBAB enhancer, and pink star an agonist-specific OCR. (D) Scaled “activity” for indicated transcription factor motifs shown on UMAP plots generated as in Fig. 3A. E-box identified as TCF4 motif in enrichment analyses. Circles denote Sig-4 (blue), Sig-5a (red), Sig-5b (yellow), and Treg (pink) clusters on the UMAP plot. See also Figures S2 and S5
Figure 6:
Figure 6:. Early divergence of agonist signaled cells and CD4 transcriptome conservation in human αβ lineage thymocytes
(A-H) Thymocytes sorted from human donors (Table S7) were prepared for scRNAseq as in Fig. S6AB. Data integrates nine distinct captures from five individual donors. (A) UMAP plot displaying thymocytes color-coded according to their distribution into clusters. hs denotes Homo sapiens. NC = non-conventional. Unk = unknown ISC = interferon stimulated cluster. (B) Scaled expression of indicated genes is shown on UMAP plots generated as in (A). (C) (Left) UMAP plot generated after Monocle3-derived dimensional reduction, colored-coded by Seurat-defined clusters as shown in (A). (Right) developmental trajectories (thick lines) defined by pseudotime analysis on cells color-coded according to their pseudotime value. DP: DP thymocytes; Agonist, CD4, and CD8 indicate the trajectories emerging at branchpoints S (selection) and L (lineage). (D, E) Violin plots show cluster average expression scores of mouse CD4+- and CD8+-lineage signatures (Fig. 1D–F and Table S1) in cell clusters defined as in (A). (F, G) Overlaid histograms of Runx3 (F) or Thpok (G) intra-cellular expression on CD69+ CD4+ (red) or CD8+ (blue) SP human (left) or mouse (right) thymocytes. CTRL trace is CD69 DP thymocytes. Human data representative of 3 distinct donors from 3 independent experiments. Mouse data representative of > 5 mice from >5 experiments. (H) Row-standardized gene expression (Z-scored cluster averages) in select scRNAseq human cell clusters. See also Figure S6 and Table S7
Figure 7:
Figure 7:. Single cell epigenomic analysis of human thymocytes
(A-E) Human thymocytes (Table S7) were prepared for scATACseq as in Fig. S6A. Data integrates thymocytes from three distinct donors. (A) UMAP plot displaying thymocytes color-coded according to their inferred cell identity. hs denotes Homo sapiens. NC = non-conventional. Unk = unknown. ISC = interferon stimulated. (B) Heatmap shows row-standardized accessibility of 16,972 OCR, selected for their differential accessibility between any two groups of cells (columns) and distributed into classes by K-means clustering (rows). Gene assignment of OCRs performed by Homer; example genes are indicated. (C) Genome browser tracks show average scaled scATACseq signals at indicated genes (bottom) for all cells sharing the indicated IID (right). Red boxes indicate sequence-conserved OCR. (D) Scaled “activity” for indicated transcription factor motifs shown on UMAP plots as in (A). E-box identified as TCF4 motif in enrichment analyses. Circles denote Sig-2 (cyan), Sig-3 (blue), Pre-Treg (yellow), and Treg (pink) clusters on the UMAP plot. (E) Genome browser tracks show average scaled scATACseq signals at BCL2L11 for all cells sharing the indicated IID (right). The enhancer element EBAB is indicated by a red rectangle. The sequence conserved agonist-specific OCR is denoted by a pink star. See also Figures S6–7 and Table S7

Comment in

References

    1. Adoro S, McCaughtry T, Erman B, Alag A, Van Laethem F, Park JH, Tai X, Kimura M, Wang L, Grinberg A, et al. (2012). Coreceptor gene imprinting governs thymocyte lineage fate. EMBO J 31, 366–377. - PMC - PubMed
    1. Aibar S, González-Blas CB, Moerman T, Huynh-Thu VA, Imrichova H, Hulselmans G, Rambow F, Marine J-C, Geurts P, Aerts J, et al. (2017). SCENIC: single-cell regulatory network inference and clustering. Nature methods 14, 1083–1086. - PMC - PubMed
    1. Aliahmad P, and Kaye J. (2008). Development of all CD4 T lineages requires nuclear factor TOX. J Exp Med 205, 245–256. - PMC - PubMed
    1. Anders S, Pyl PT, and Huber W. (2015). HTSeq--a Python framework to work with high-throughput sequencing data. Bioinformatics 31, 166–169. - PMC - PubMed
    1. Au-Yeung BB, Melichar HJ, Ross JO, Cheng DA, Zikherman J, Shokat KM, Robey EA, and Weiss A. (2014). Quantitative and temporal requirements revealed for Zap70 catalytic activity during T cell development. Nat Immunol 15, 687–694. - PMC - PubMed

Publication types

MeSH terms

Substances