. 2020 Dec 8;33(10):108448.
doi: 10.1016/j.celrep.2020.108448. Epub 2020 Nov 25.

Circulating miRNA Spaceflight Signature Reveals Targets for Countermeasure Development

Affiliations

Circulating miRNA Spaceflight Signature Reveals Targets for Countermeasure Development

Sherina Malkani et al. Cell Rep. .

Abstract

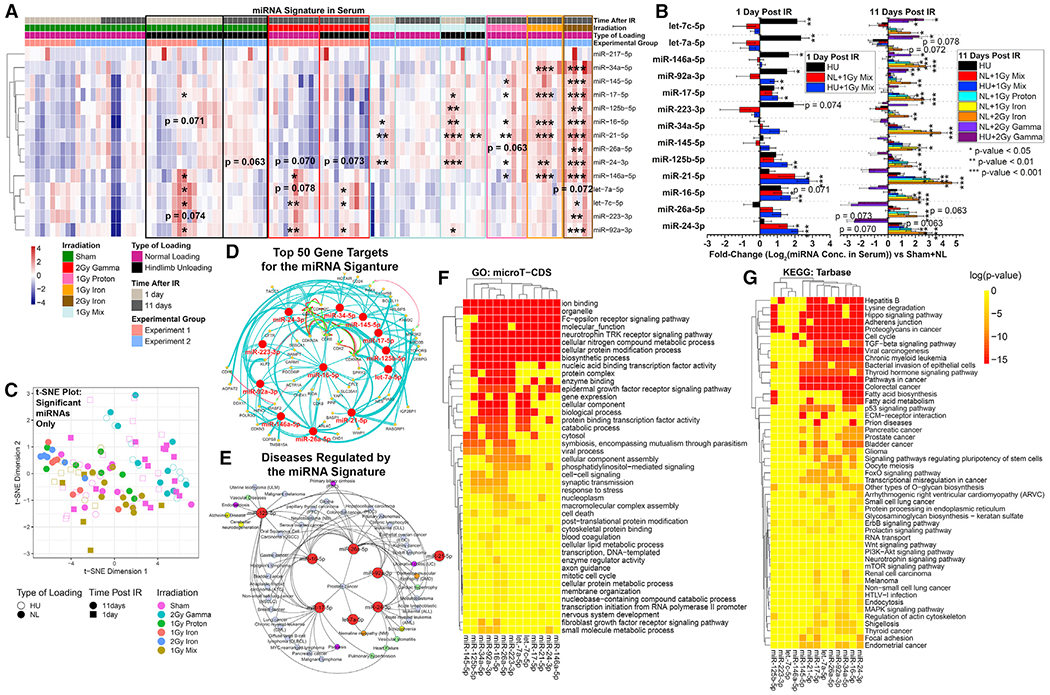
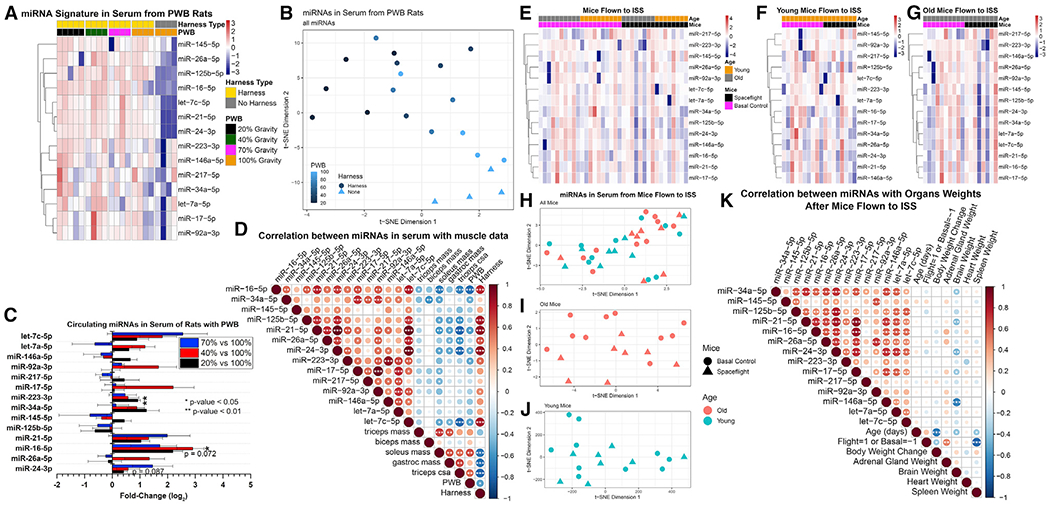
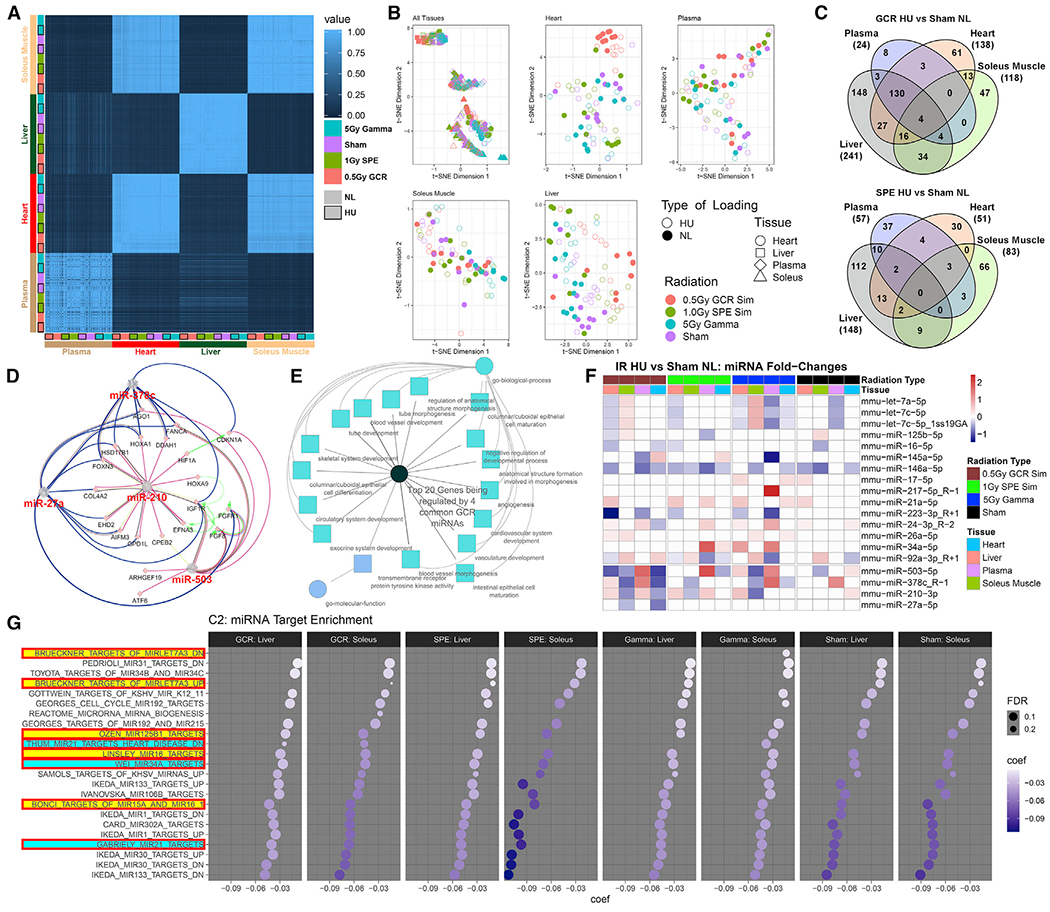
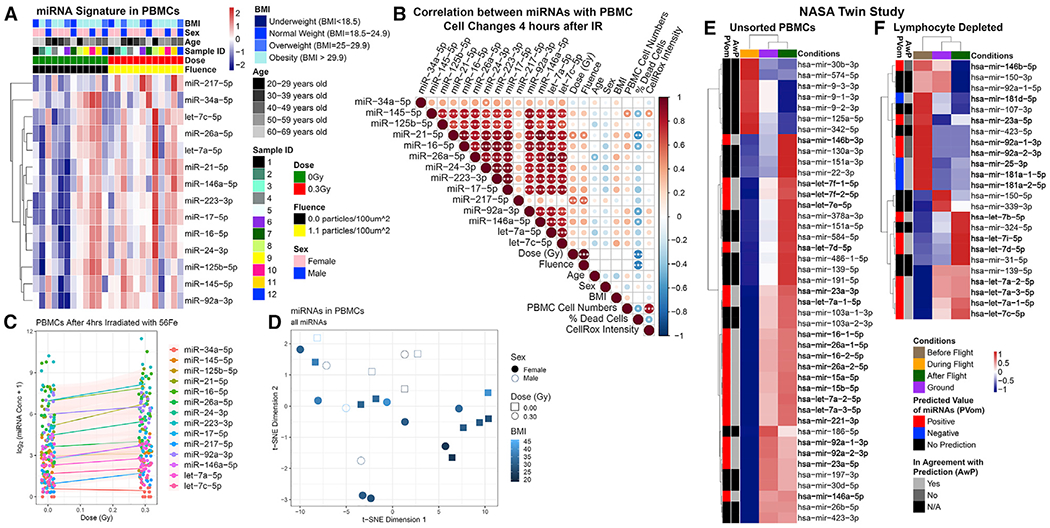
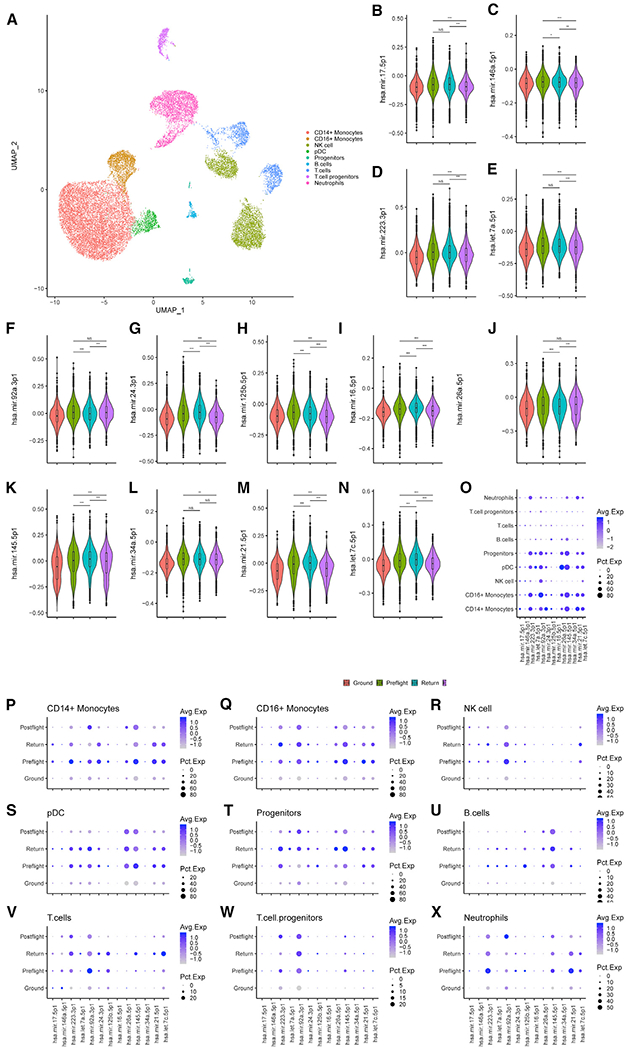
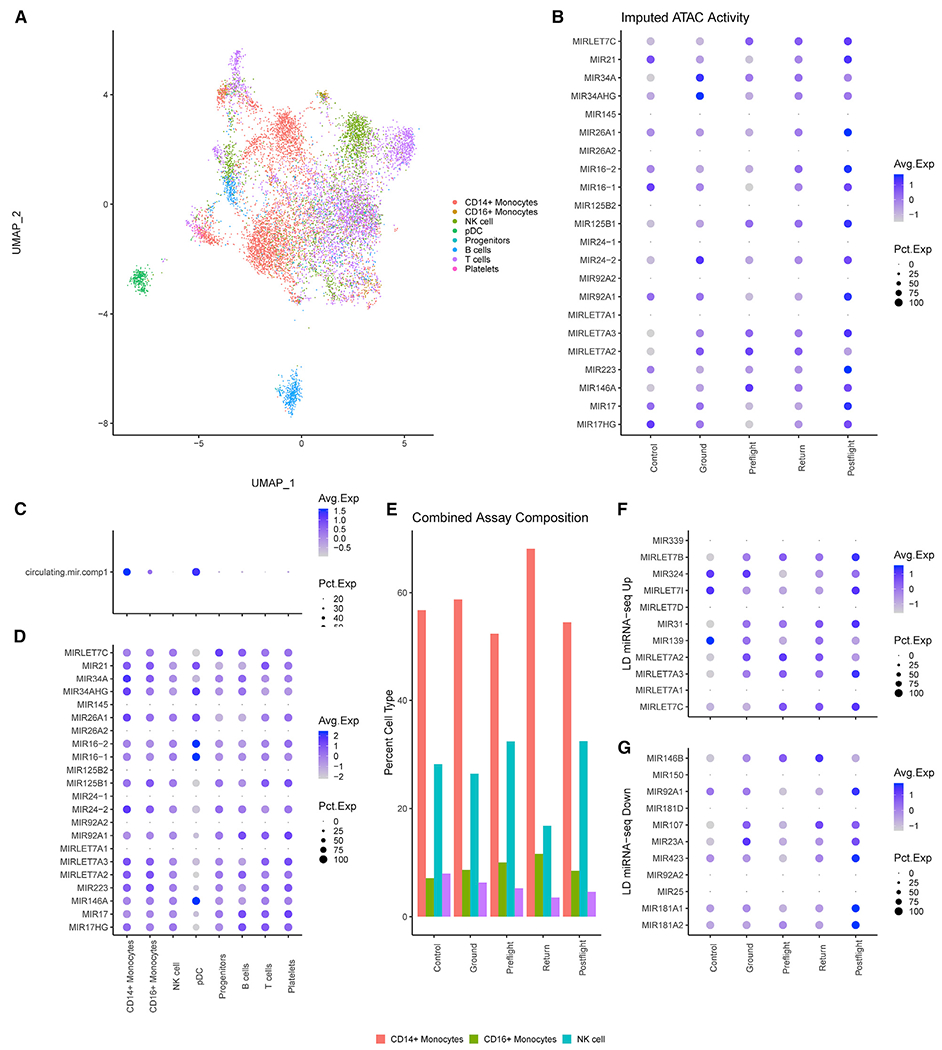
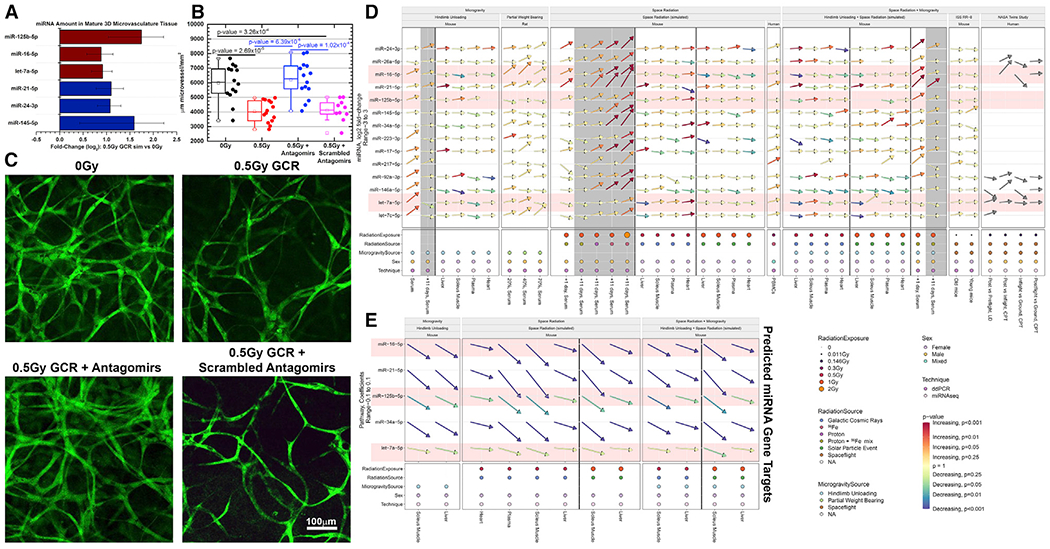
We have identified and validated a spaceflight-associated microRNA (miRNA) signature that is shared by rodents and humans in response to simulated, short-duration and long-duration spaceflight. Previous studies have identified miRNAs that regulate rodent responses to spaceflight in low-Earth orbit, and we have confirmed the expression of these proposed spaceflight-associated miRNAs in rodents reacting to simulated spaceflight conditions. Moreover, astronaut samples from the NASA Twins Study confirmed these expression signatures in miRNA sequencing, single-cell RNA sequencing (scRNA-seq), and single-cell assay for transposase accessible chromatin (scATAC-seq) data. Additionally, a subset of these miRNAs (miR-125, miR-16, and let-7a) was found to regulate vascular damage caused by simulated deep space radiation. To demonstrate the physiological relevance of key spaceflight-associated miRNAs, we utilized antagomirs to inhibit their expression and successfully rescue simulated deep-space-radiation-mediated damage in human 3D vascular constructs.

Keywords: NASA; Twins Study; antagomirs; miRNA-seq; microRNA; microgravity; scATAC-seq; scRNA-seq; space radiation; spaceflight.


Conflict of interest statement

Declaration of Interests The authors declare no competing interests.

Figures

Figure 1.
Figure 1.. Quantified miRNAs in Serum from Rodents Exposed to Ground Analogs of Spaceflight.
Microgravity and radiation conditions of spaceflight were simulated alone and in combination. (A) Quantification of miRNAs in serum from rodents exposed to hindlimb unloading (HU) or normal loading (NL) for 3 days before 2 Gy gamma, 1 Gy proton, 1 Gy 600MeV/n 56Fe, 2 Gy 600MeV/n56Fe, or sham irradiation. HU or NL was continued for another 1 or 11 days after irradiation. (B) Fold changes (log2) of miRNAs compared to NL sham mice. *p < 0.05, **p < 0.01, ***p < 0.001, two-tailed Student’s t test. The error bars represent SEM. (C) t-Distributed Stochastic Neighbor Embedding (t-SNE) plot showing how the significantly regulated miRNAs are associated with each experimental group. Statistical significance is based on comparing each group with the sham irradiated NL mice. (D) Top 50 predicted gene targets for all statistically significant miRNAs determined by Cytoscape plugin ClueGo. (E) The predicted diseases regulated by the miRNA signature determined through miRNet. The blue nodes represent cancer; green, cardiovascular disease; yellow, neurological diseases; orange, muscle degeneration; purple, digestive issues. (F) Gene Ontology (GO) pathways predicted to be regulated by all statistically significant spaceflight-associated miRNAs determined by the DIANA-microT-CDS (v5.0) algorithm. (G) Kyoto Encyclopedia of Genes and Genomes (KEGG) pathways predicted to be regulated by all statistically significant spaceflight-associated miRNAs.
Figure 2.
Figure 2.. Serum miRNA Quantification from PWB Rats Modeled under Four Different Gravity Conditions
(A) Global comparisons of miRNAs from 20%, 40%, 70%, and 100% gravitational loading conditions. The 100% loaded group is further split into FH or NH. (B) t-SNE plot reveals distinct separation of the miRNAs between different experimental groups for each gravity condition, as well as a separation between the NH and FH 100% gravity groups. (C) Fold changes (log2) for miRNA increases compared to 100% gravity with FH group. (D) Correlation between serum miRNA increases and physiological muscle mass over different gravity conditions (PWB). Significance indicated in circles. *p < 0.05, **p < 0.01, ***p < 0.001, two-tailed Student’s t test. Circle size is proportional to the correlation coefficient, also indicated by color (legend on right-hand side). (E) Global comparison of miRNAs in serum from mice flown on the International Space Station (ISS) for 30 days, sacrificed 4 days after returning to Earth. (F) Serum miRNA comparisons for only the 16-week-old mice. (G) Serum miRNA comparisons for only the 37-week-old mice. (H) t-SNE plot of all mice flown on the ISS shows subtle separation between young and old groups. (I and J) t-SNE plot of old mice shows separation between spaceflight and ground mice, while t-SNE plot of young mice fails to show separation. (K) Correlation of miRNA quantities and organ weights for all mice flown on the ISS. The significance of each correlation is indicated in the circles. *p < 0.05, **p < 0.01, ***p < 0.001, two-tailed Student’s t test. Circle size is proportional to the correlation coefficient.
Figure 3.
Figure 3.. miRNA-seq of Heart, Liver, Plasma, and Soleus Muscle from Mice Exposed to Simulated Spaceflight Stressors
(A) Comparison of miRNA expression profiles between organs. (B) Combined and individual t-SNE plots for significantly expressed miRNAs in each organ. (C) Overlap of significant differentially expressed miRNAs between organs for GCR HU and sham NL and for SPE HU versus sham NL. The center, dark gray region indicates significant miRNAs shared by all organs. (D) Top 20 genes regulated by the four common miRNAs differentially expressed in GCR HU versus sham NL. (E) Pathways that are significantly regulated by the top 20 genes shown in (D). (F) miRNA fold changes between HU and NL groups for each irradiation condition. miRNAs from our proposed signature are included, as well as the four additional miRNAs implicated by miRNA-seq in (C). (G) C2 pathways analysis from miRNA-seq data shows pathways that are being suppressed. The larger the circle, the more significant the effect, and darker purple indicates a larger magnitude of suppression. miRNAs highlighted in yellow or blue were included in our predicted spaceflight signature. miRNAs highlighted in yellow are known to be involved in spaceflight-induced cardiac damage.
Figure 4.
Figure 4.. Quantification of miRNAs in Human Samples Exposed to Spaceflight or IR
(A) Comparison of human peripheral blood mononuclear cell (PBMC) samples from 12 subjects 4 h post-irradiation with 0.3 Gy or sham (0 Gy) 56Fe irradiation. (B) Correlation between miRNA quantities and cell phenotypes 4 h post-irradiation. The significance of each correlation is indicated in the circles. *p < 0.05, **p < 0.01, ***p < 0.001, two-tailed Student’s t test. Circle size is proportional to the correlation coefficient. (C) General additive model fit of the miRNA quantities as a function of dose. (D) t-SNE plot of the samples clustering as a function of BMI based on miRNA concentration. (E and F) NASA Twins Study data for (E) unsorted PBMCs and (F) LD cells in comparison to the spaceflight miRNA signature predictions.
Figure 5.
Figure 5.. Spaceflight-Associated miRNA Target Genes Are Downregulated upon TW Return and Postflight Compared to Preflight, with Individual Cell Types Being Differentially Affected
(A) Uniform manifold approximation and projection (UMAP) plot of 23,408 cells grouped by cell-type-identified clusters. (B–N) Violin plots with mean and first and third quartiles of the indicated miRNA target gene module scores. Cells were separated into four groups: cells from HR GD114, GD138, GD182, GD3, GD-66, and GD66 as Ground; TW L-162 and L-148 days as Preflight; TW R0 as Return; and TW R36 and R191 as Postflight. Differences in expression of miRNA target gene modules scores was tested by Wilcoxon rank sum test. *p < 0.05, **p < 0.01, ***p < 0.001. (O–W) Dot plots colored by average expression and size based on percent expression of the spaceflight-associated mRNA target gene module scores of cell types grouped by Ground, Preflight, Return, and Postflight.
Figure 6.
Figure 6.. Spaceflight Does Not Induce Epigenetic Changes around Spaceflight-Associated miRNA
(A) UMAP plot of 11,344 cells grouped by cell type predicted by Seurat’s transfer anchor function from the 10× PBMC dataset (see Method Details). (B) Dot plot colored by ATAC activity and sized based on percentage ATAC activity at the 5-kb bins associated with spaceflight-associated miRNA. Cells were separated into five groups: cells from the control (non-LD) PBMCs as Control, HR GD-66 and GD125 as Ground, TW L-71 as Preflight, TW R3 as Return, and TW R36 as Postflight. (C) Dot plot of spaceflight-associated miRNA module scores with cells grouped by cell type across all samples. (D) Dot plot of the individual spaceflight-associated miRNA ATAC activity with cells grouped by cell type. (E) Composition analysis per group based after removal of B and T cells across both scATAC and scRNA analysis. (F and G) Dot plots of ATAC activity at miRNA upregulated (F) or downregulated (G) in the LD miRNA-seq.
Figure 7.
Figure 7.. miRNA Changes and Impacts in a 3D Microvascular Tissue Model
(A) Quantification of miRNAs from a 3D culture of mature human microvessels with human umbilical vein endothelial cells (HUVECs) irradiated with 0.5 Gy of simplified simulated galactic cosmic rays (SimGCRSim) compared to sham irradiated samples 48 h after irradiation. All candidate miRNAs were examined, but only the miRNAs that seemed to respond differently for each group are shown. The error bars represent SEM. (B and C) Mature microvessels fixed and fluorescently stained with 5-(4,6-dichlorotriazinyl) aminofluorescein (DTAF) (Method Details) 48 h after SimGCRSim irradiation with or without antagomir-induced inhibition of miR-125b, miR-16, and let-7a starting at 24 h prior to irradiation. Scrambled version of the antagomir was used a vehicle control. (D) Summary of all the fold-change values for all experiments utilized in this manuscript (including both ddPCR and miRNA-seq data). (E) The summary of the overall impact of the miRNAs on the gene targets determined in Figure 3D through pathway analysis on the miRNA-seq data. The arrows indicate the degree of up- or downregulation, and the colors of the arrows indicate the significance (i.e., p values). The gray-shaded regions represent the 11-day time points after irradiation. The red-shaded miRNAs represent the miRNAs used for the antagomir experiments in (B) and (C).

References

    1. Baqai FP, Gridley DS, Slater JM, Luo-Owen X, Stodieck LS, Ferguson V, Chapes SK, and Pecaut MJ (2009). Effects of spaceflight on innate immune function and antioxidant gene expression. J. Appl. Physiol 106, 1935–1942. - PMC - PubMed
    1. Beheshti A, Vanderburg C, McDonald JT, Ramkumar C, Kadungure T, Zhang H, Gartenhaus RB, and Evens AM (2017). A Circulating microRNA Signature Predicts Age-Based Development of Lymphoma. PLoS ONE 12, e0170521. - PMC - PubMed
    1. Beheshti A, Ray S, Fogle H, Berrios D, and Costes SV (2018). A microRNA signature and TGF-β1 response were identified as the key master regulators for spaceflight response. PLoS ONE 13, e0199621. - PMC - PubMed
    1. Beheshti A, McDonald JT, Miller J, Grabham P, and Costes SV (2019). GeneLab Database Analyses Suggest Long-Term Impact of Space Radiation on the Cardiovascular System by the Activation of FYN Through Reactive Oxygen Species. Int. J. Mol. Sci 20, 661. - PMC - PubMed
    1. Besnier M, Shantikumar S, Anwar M, Dixit P, Chamorro-Jorganes A, Sweaad W, Sala-Newby G, Madeddu P, Thomas AC, Howard L, et al. (2019). miR-15a/-16 Inhibit Angiogenesis by Targeting the Tie2 Coding Sequence: Therapeutic Potential of a miR-15a/16 Decoy System in Limb Ischemia. Mol. Ther. Nucleic Acids 17, 49–62. - PMC - PubMed

Publication types

LinkOut - more resources