. 2020 Nov 25;183(5):1185-1201.e20.
doi: 10.1016/j.cell.2020.11.002.

Comprehensive Multi-omics Analysis Reveals Mitochondrial Stress as a Central Biological Hub for Spaceflight Impact

Affiliations

Comprehensive Multi-omics Analysis Reveals Mitochondrial Stress as a Central Biological Hub for Spaceflight Impact

Willian A da Silveira et al. Cell. .

Abstract

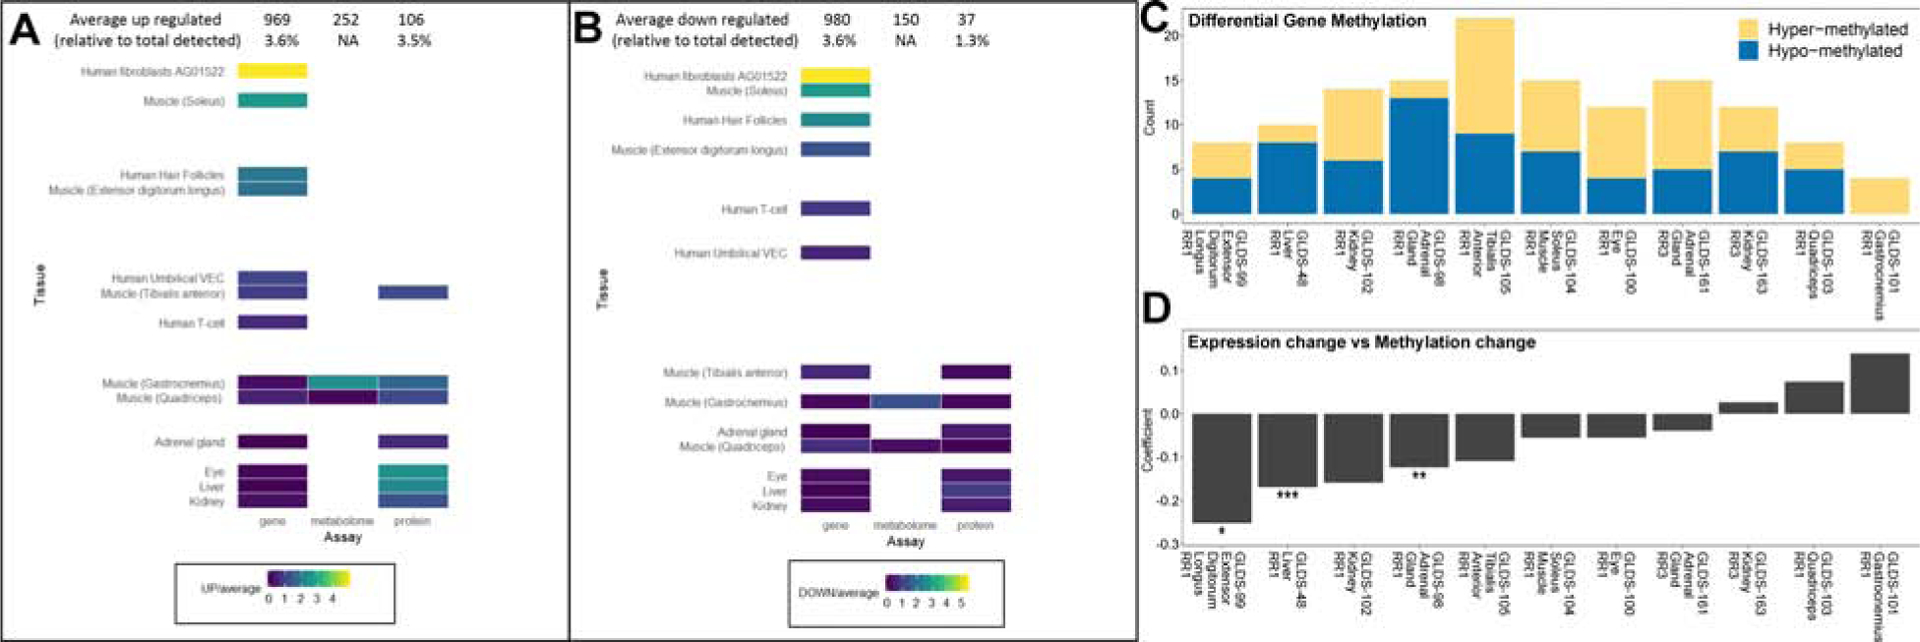
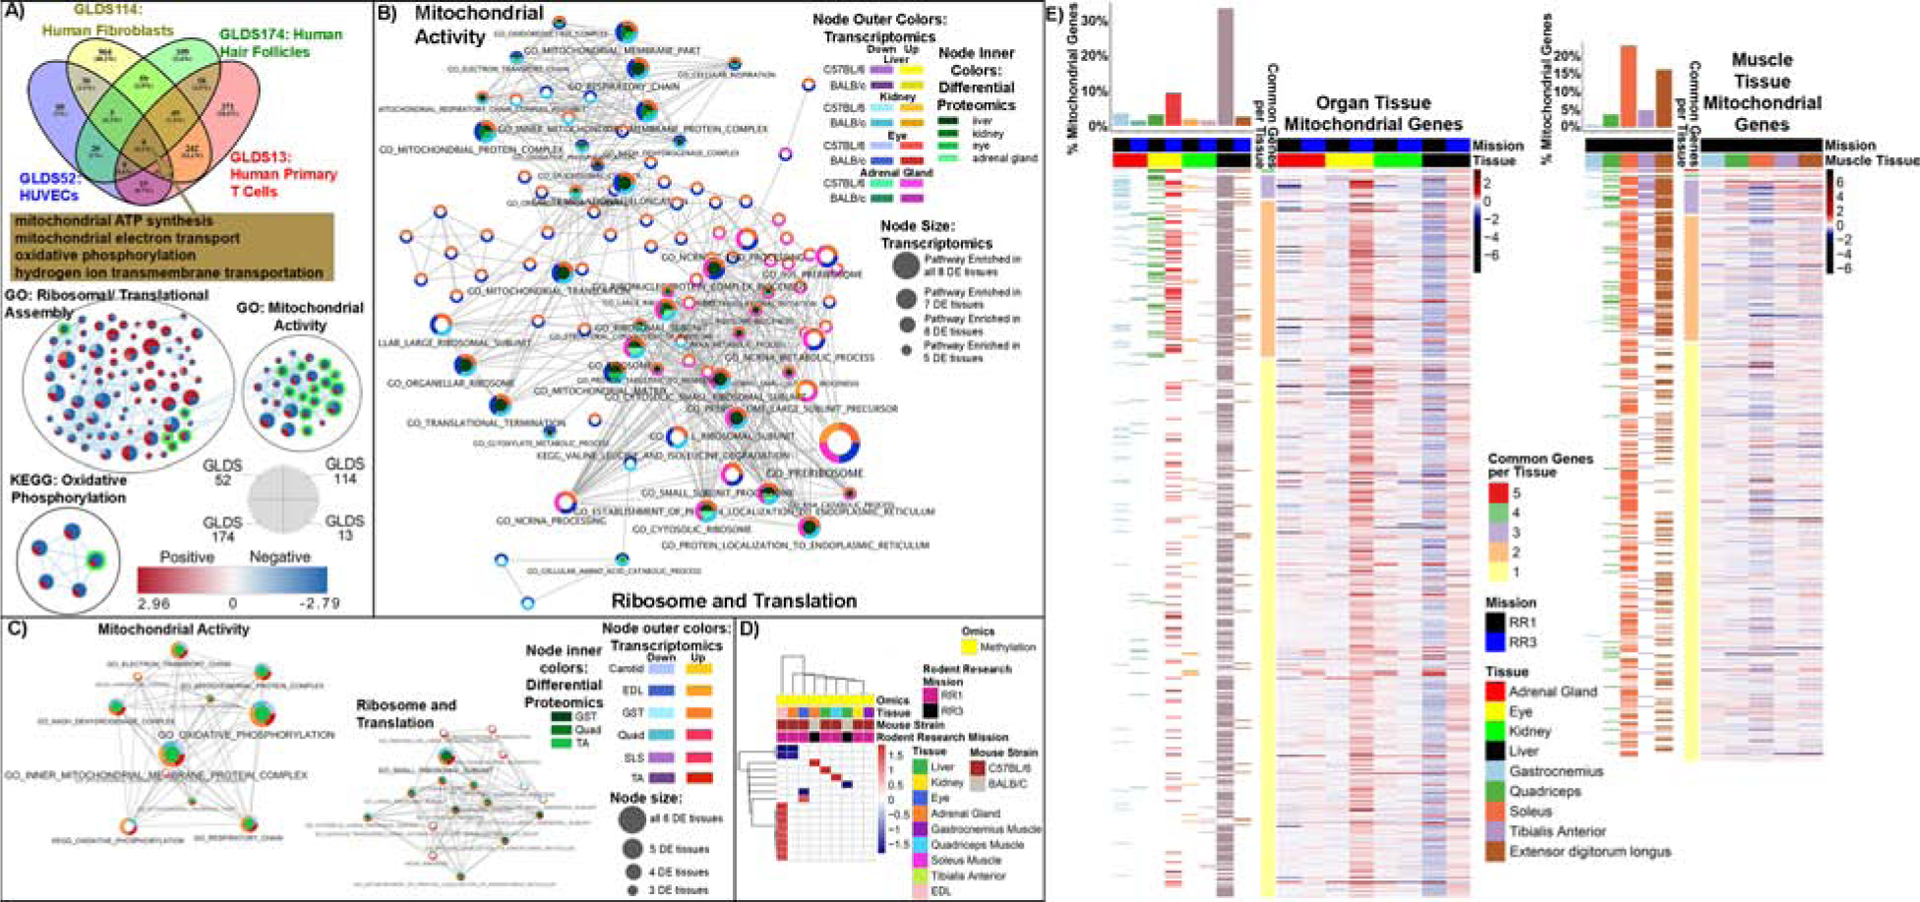
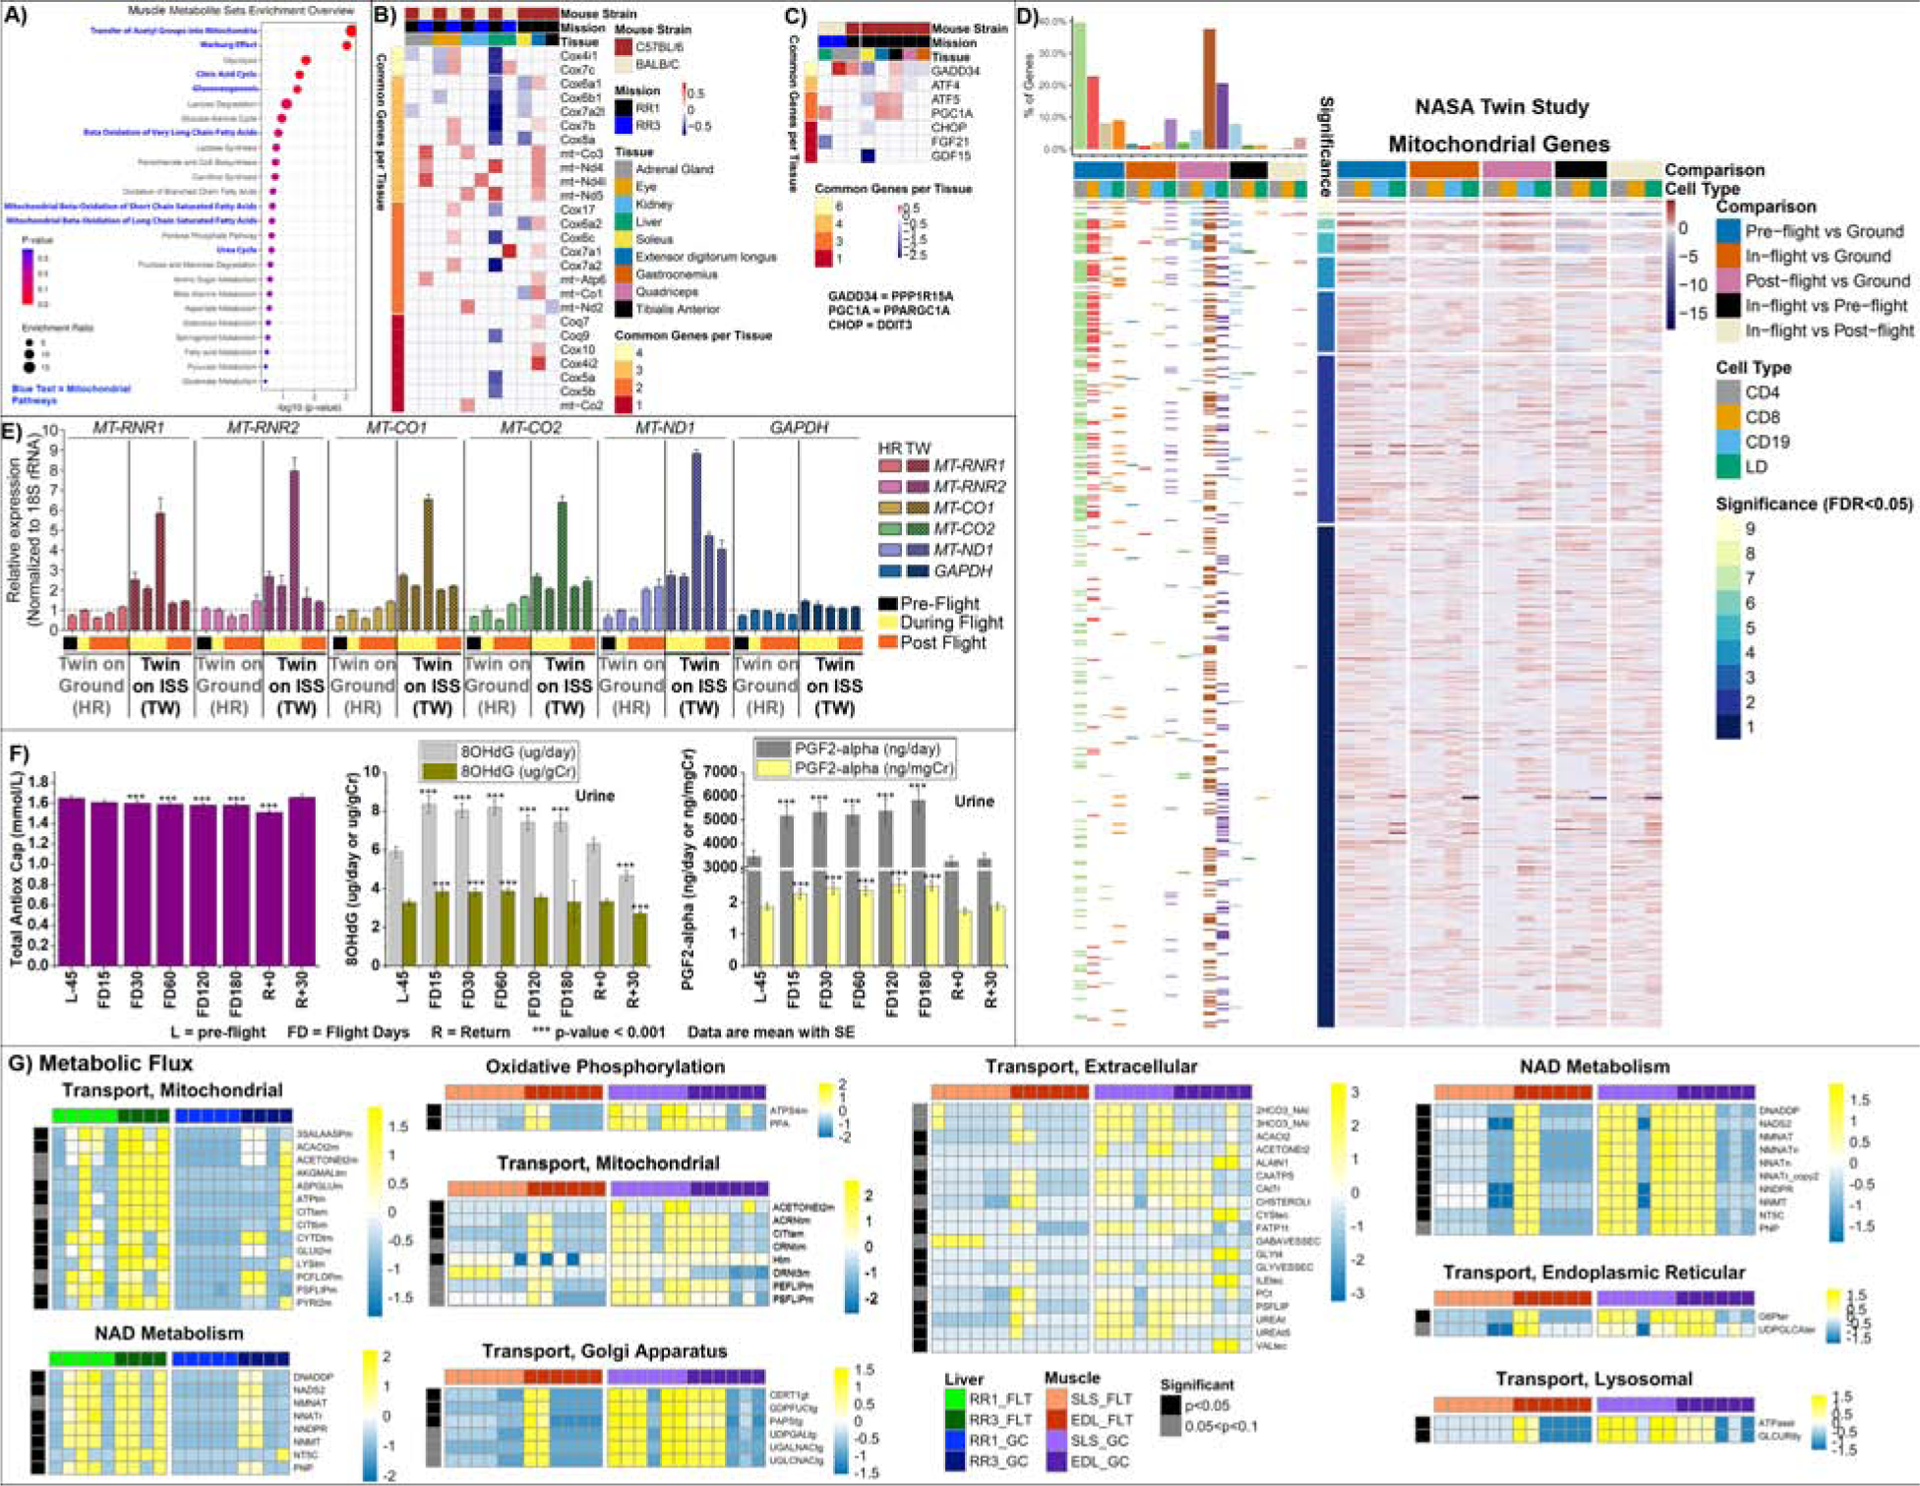
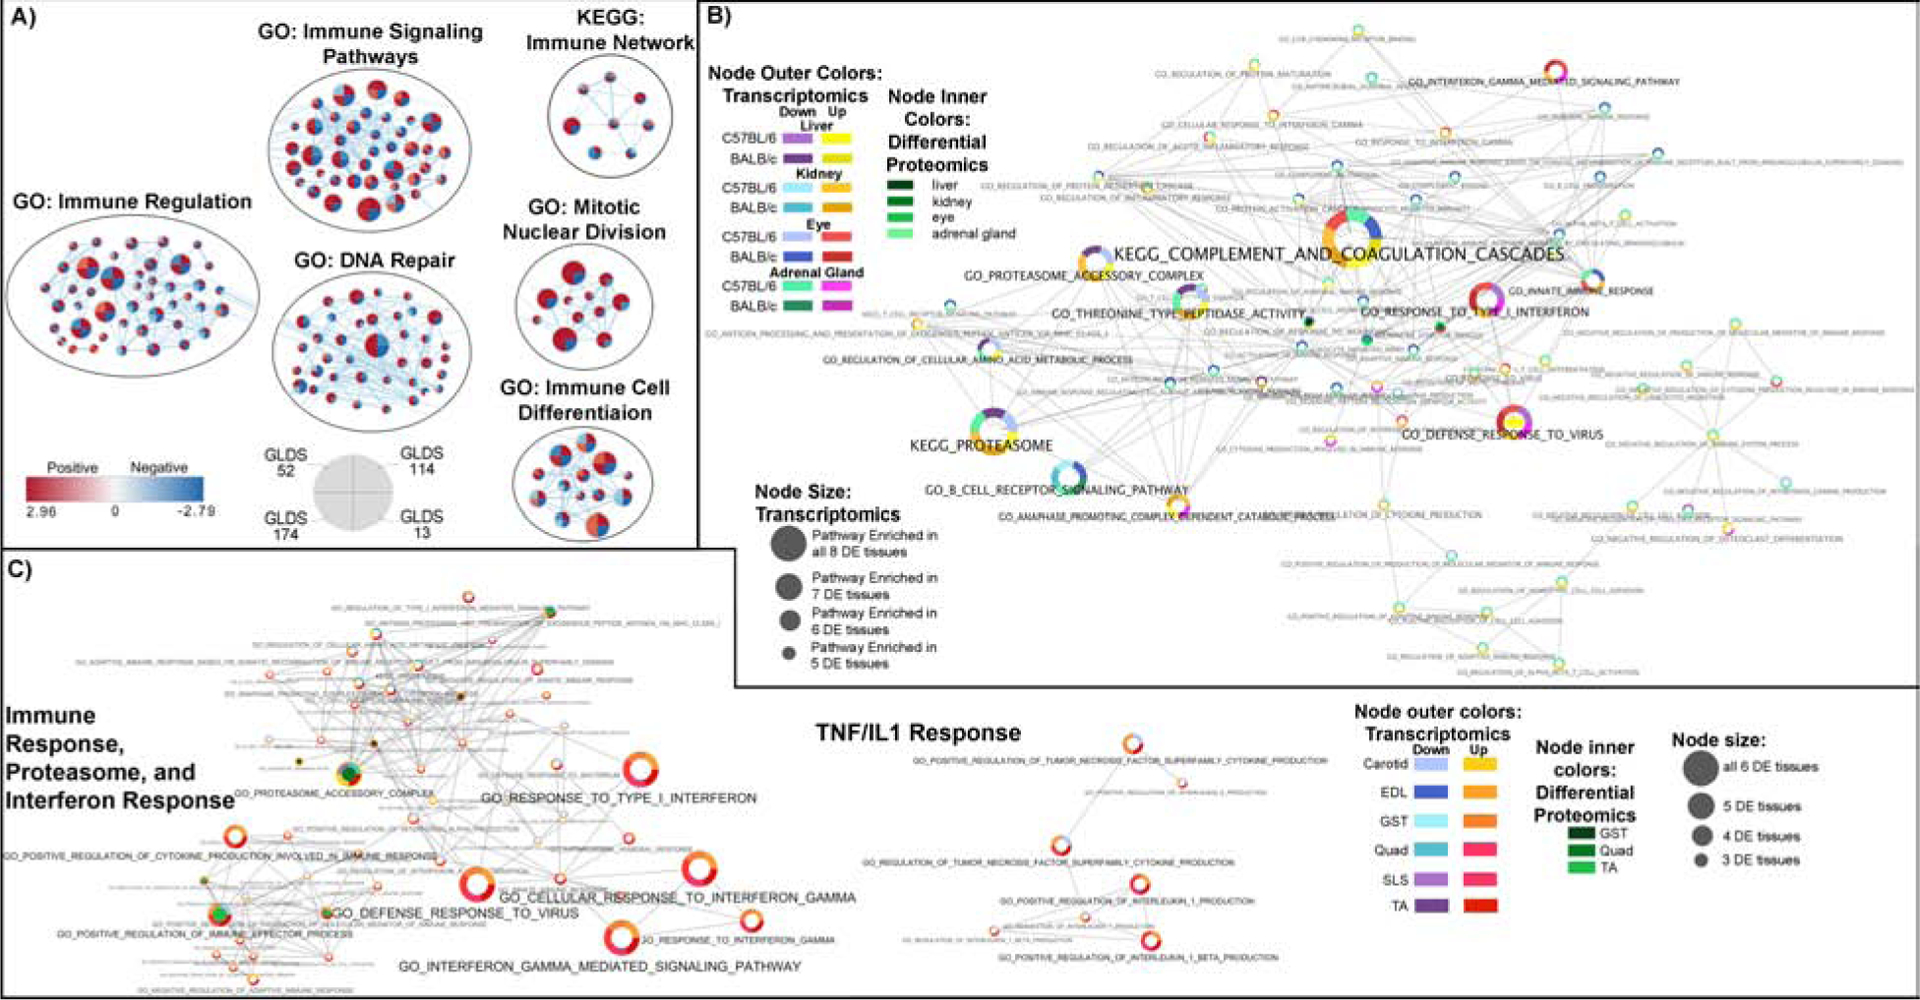
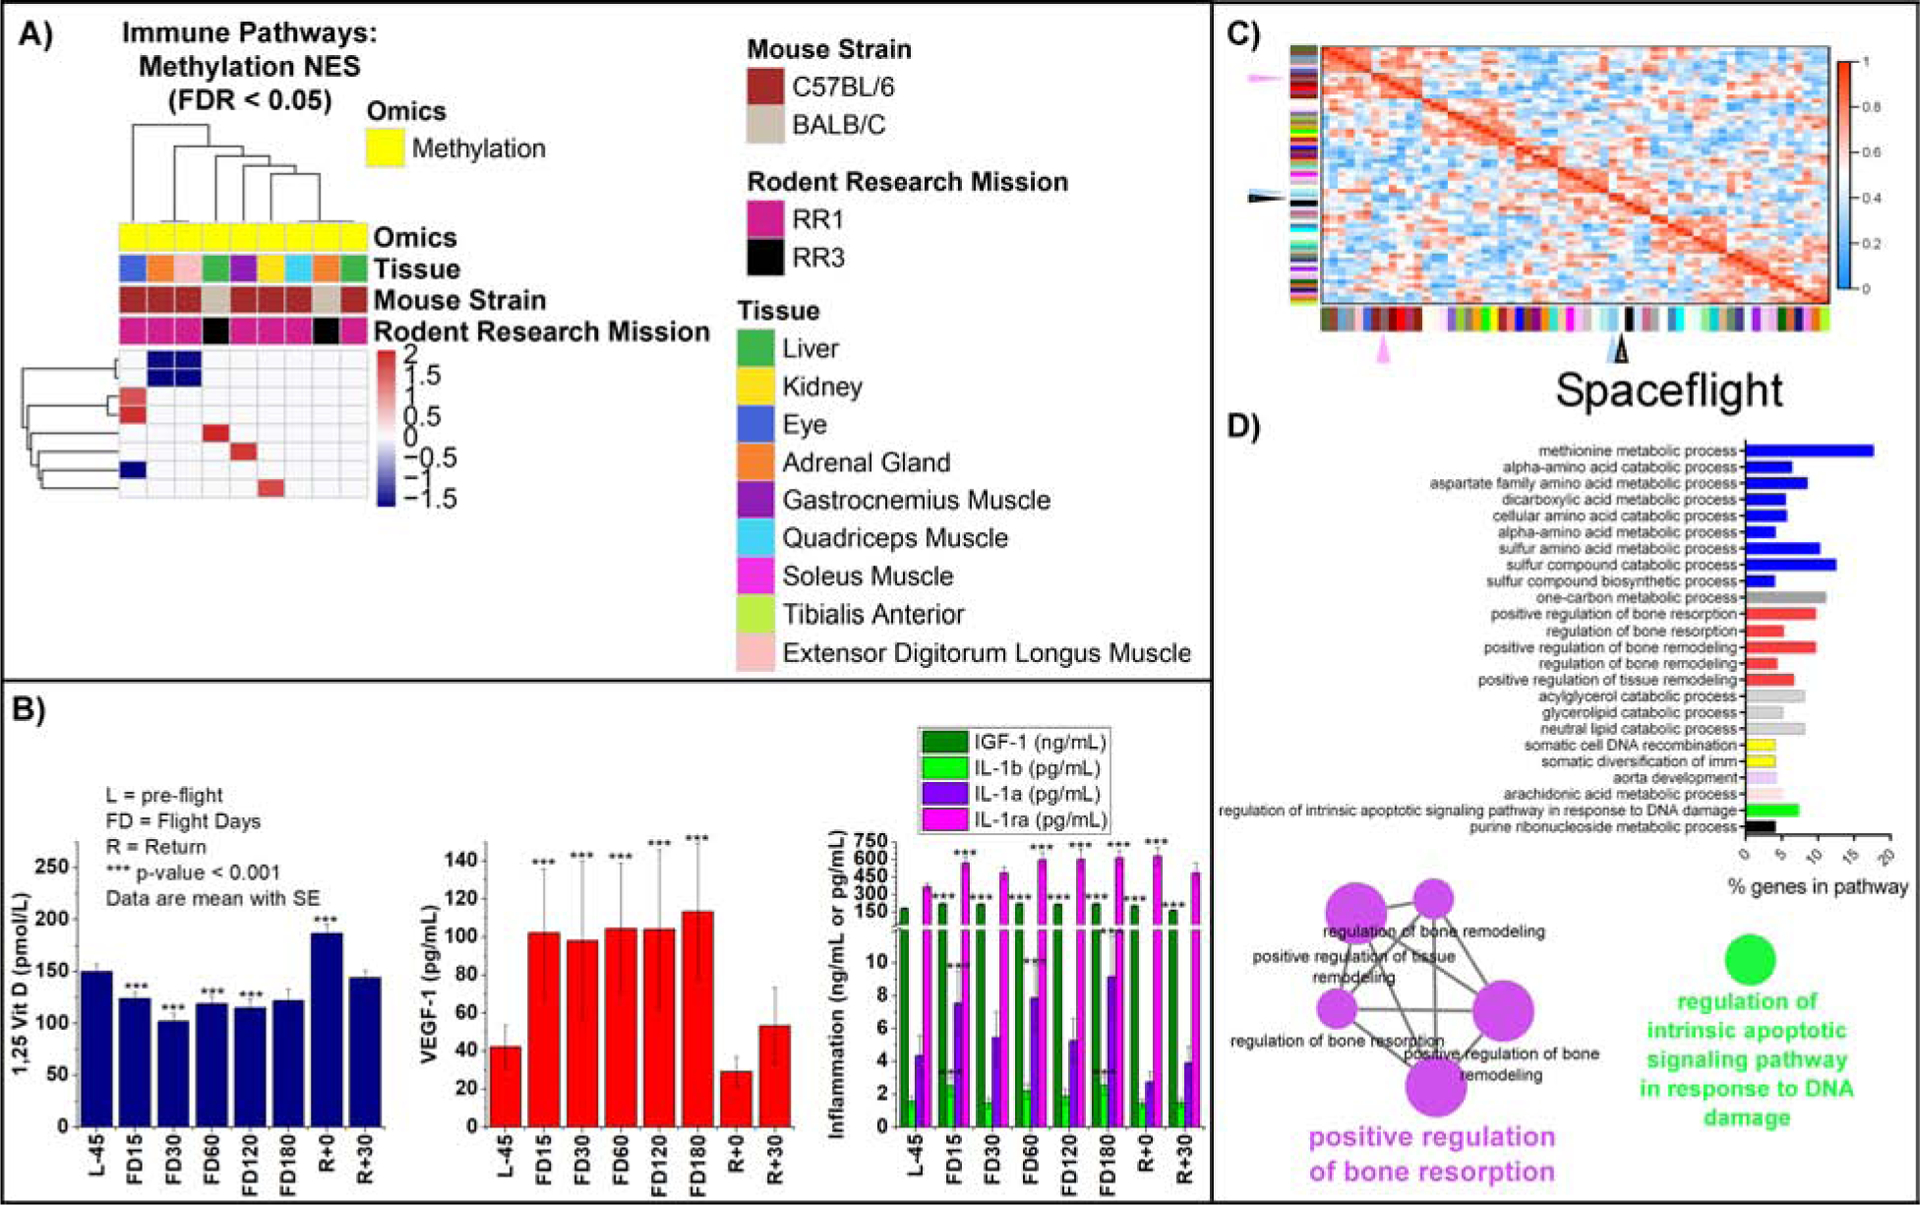
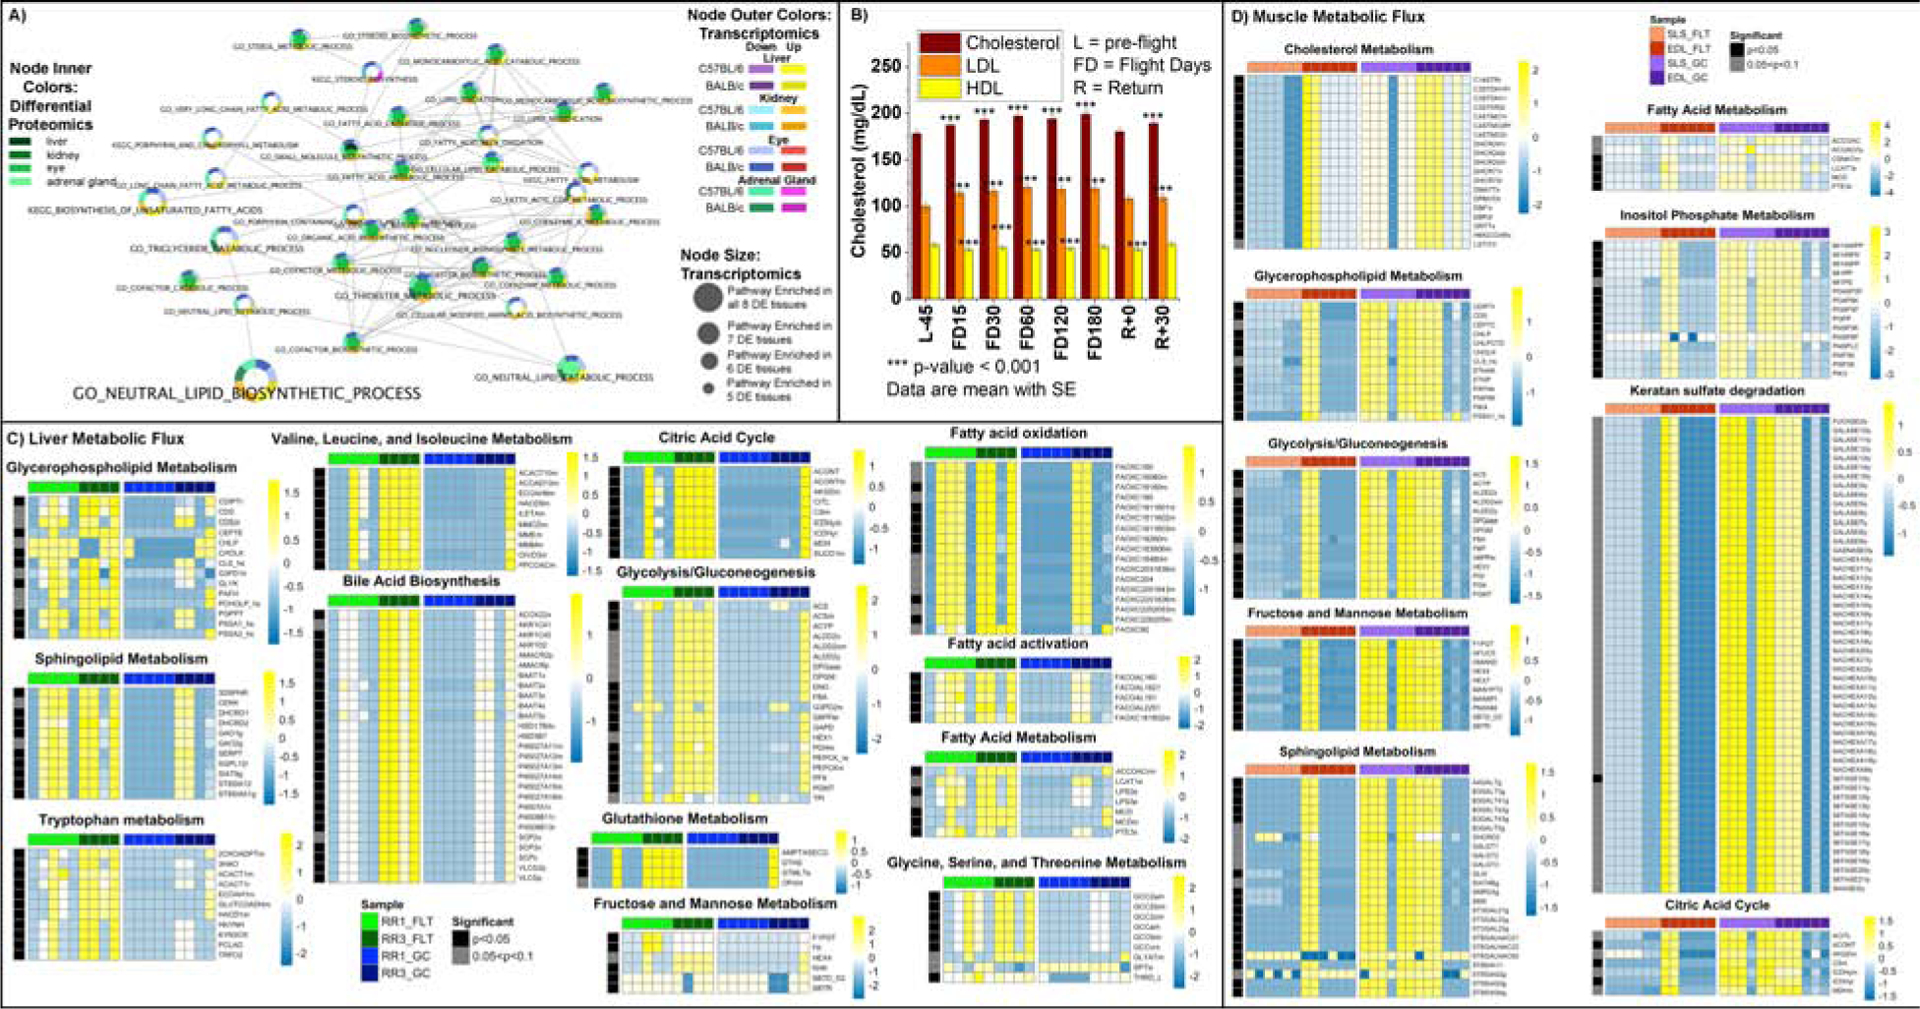
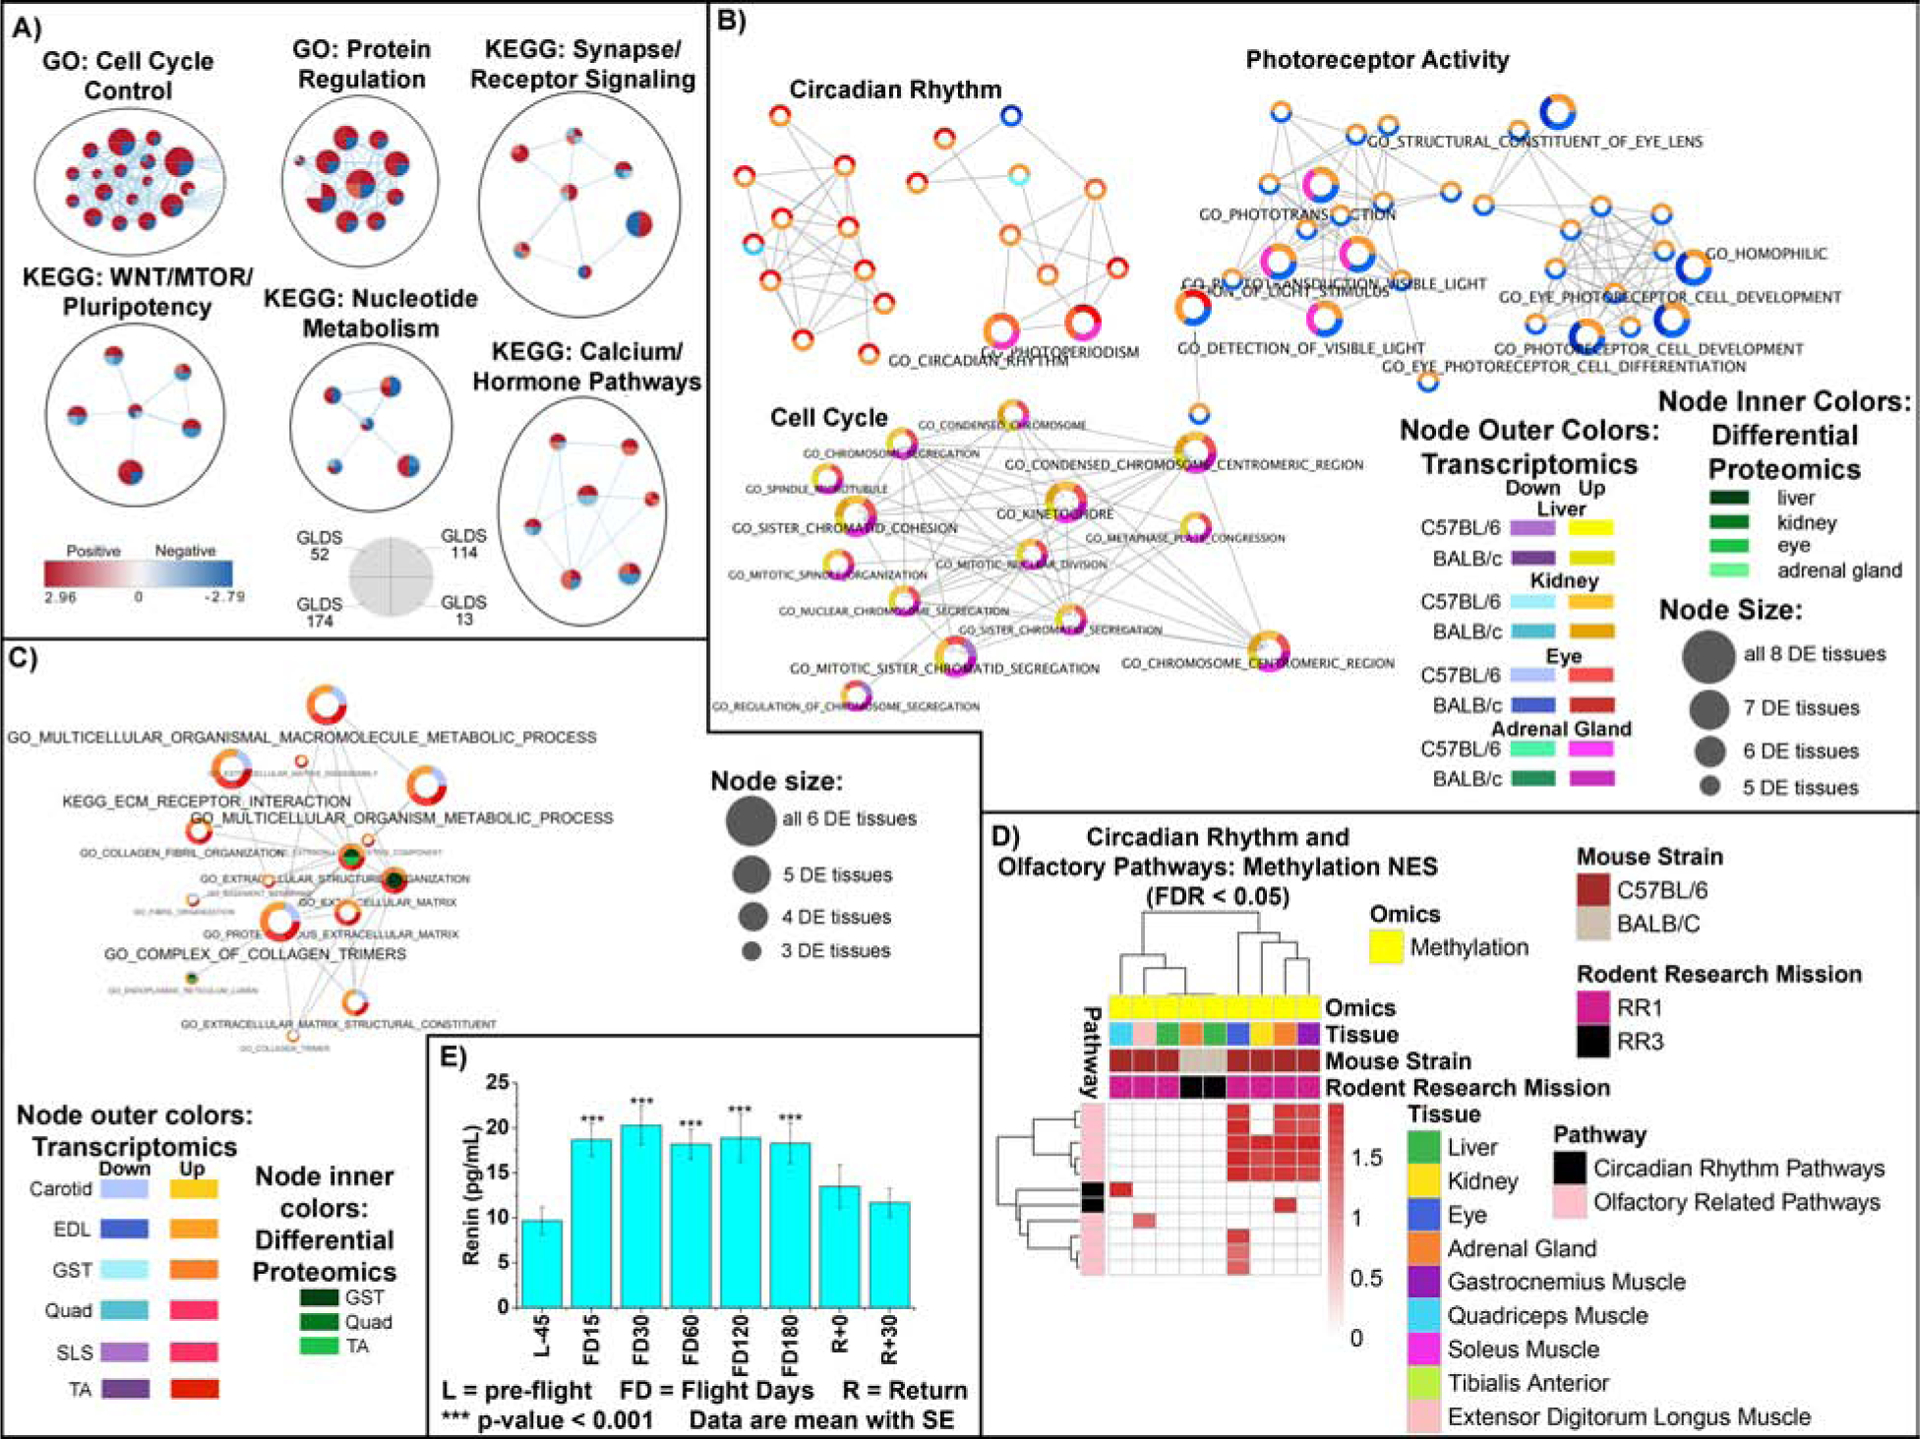
Spaceflight is known to impose changes on human physiology with unknown molecular etiologies. To reveal these causes, we used a multi-omics, systems biology analytical approach using biomedical profiles from fifty-nine astronauts and data from NASA's GeneLab derived from hundreds of samples flown in space to determine transcriptomic, proteomic, metabolomic, and epigenetic responses to spaceflight. Overall pathway analyses on the multi-omics datasets showed significant enrichment for mitochondrial processes, as well as innate immunity, chronic inflammation, cell cycle, circadian rhythm, and olfactory functions. Importantly, NASA's Twin Study provided a platform to confirm several of our principal findings. Evidence of altered mitochondrial function and DNA damage was also found in the urine and blood metabolic data compiled from the astronaut cohort and NASA Twin Study data, indicating mitochondrial stress as a consistent phenotype of spaceflight.

Keywords: GeneLab; NASA; NASA Twin Study; Rodent Research Missions; lipids; microgravity; mitochondria; space radiation; spaceflight; transcriptomic.


Conflict of interest statement

Declaration of Interests The authors declare no competing interests.

Figures

Figure 1.
Figure 1.. Global analysis of the transcriptomics, proteomics, and metabolomics datasets.
To provide a global view of the changes occurring for all GeneLab data used in this manuscript we computed the overall mean levels of up (A) and down (B) regulated molecules across all data sets for each assay and normalized to the individual levels of up and down regulated gene/protein/metabolite by dividing by the average of each assay. Note that regulation here refers to flight versus ground samples. C) Overall summary of the Differential Gene Methylation for hyper- and hypo-methylated genes. D) The relationship between absolute methylation and expression for all genes in each dataset and correlating it to the median promoter methylation of that gene. Significance of the relationship between the methylation change and expression change was calculated by taking the log2 fold-change values for gene expression and methylation and fitting a linear model. The significance is displayed on the plot by * p-value < 0.05, ** p-value < 0.01, and *** p-value < 0.001.
Figure 2:
Figure 2:. Mitochondrial related pathways and mitochondrial genes affected by spaceflight in cells and mice.
A) Pathway analysis of the impact of spaceflight on in vitro data. Gene Set Enrichment Analysis (GSEA) comparing flight to ground treatments. Venn diagrams of statistically significant Gene Ontology (GO) gene sets with FDR < 10%. Cytoscape enrichment maps of GO and KEGG sets with FDR <10% in at least two GLDS datasets. Each node contains 4 wedges for each dataset (indicated by the legend in the figure) and the color of each wedge indicates if the gene set is downregulated (blue) or upregulated (red). The shade of the color indicates degree of regulation. The thickness of the edge (blue lines) represents the number of genes associated with the overlap of the gene sets (or nodes) that the edge connects. In addition, the green highlighted nodes represent the gene sets related to mitochondrial pathways. B) Liver, Kidney, Eye and Adrenal Gland Tissue Analysis from C57BL/6 and BALB/C mice from mission RR1 and RR3, C) C57BL/6 extensor digitorum longus (EDL), gastrocnemius (GST), quadriceps (Quad), soleus (SLS), tibialis anterior (TA), and BALB/C carotid artery (Carotid). B) and C) Pathway results were integrated across multiple tissues and RNAseq and proteomics platforms to summarize the system-wide effects of spaceflight compared to ground control. Enriched GO terms and KEGG pathways were integrated using a network framework, where two pathways are connected by an edge if they share a significant fraction of genes. Pathways dysregulated in two or more tissues are displayed. Pathway up and down regulation is encoded by node color, and pathways dysregulated by multiple tissues are mapped to larger node size. D) Heatmap representation of GSEA analysis on the methylated genes from both mission. E) Heatmap representation of all mitochondrial genes that are significantly expressed (FDR < 0.05) between spaceflight vs ground fold-change values for all tissues. The mitochondrial genes were obtained from MitoCarta. The panel on the left of the heatmap shows the distribution of the significantly regulated (FDR < 0.05) mitochondrial genes for each comparison.
Figure 3.
Figure 3.. Mitochondrial related metabolites, mitochondrial gene confirmation from NASA Twin Study data, and astronaut blood and urine parameters affected by spaceflight.
A) C57BL/6 (RR9 mission) gastrocnemius and quadriceps Pathway enrichment analysis based on the subset of validated metabolites from Table S4. Blue letters highlight pathways with mitochondrial involvement. B) Heatmap representation of differential expression (log2(fold-change) of spaceflight vs ground comparison) of down-regulated nDNA and up-regulated mtDNA coded mitochondrial genes in oxidative tissues from C57BL/6 and BALB/C mice. C) Heatmap representation of differential expression (log2(fold-change) of spaceflight vs ground comparison) of Integrated Stress Response (ISR) genes and PGC1α. The figure legend for (B) and (C) are shared. D) Heatmap representation of the all the mitochondrial genes that are significantly expressed (FDR < 0.05) from RNA-sequencing on the T Lymphocyte CD4+ and CD8+, B Lymphocyte CD19+, and lymphocyte depleted (LD) cells in the blood from the NASA Twin study. Log2(fold-change) values are shown in the heatmap between the Twin in space for pre-, in-, and post-flight compared to the Twin on the ground. The panel on the left of the heatmap shows the distribution of mitochondrial genes for each comparison. The colors in the heatmap represent red being upregulated and blue being downregulated. The mitochondrial genes were obtained from MitoCarta. E) qRT-PCR on NASA Twin study samples comparing ground and flight samples from whole-blood cell fractions for expression of the indicated mitochondrial genes has been plotted relative to 18S rRNA. Solid bars represent the ground samples (HR) over time and the patterned bars represent the flight samples (TW) over time. Expression in the 100215_CPT_HR ground sample (the second bar for ground samples) was set as 1. Sample details can be found in Table S5. The x-axis displays color-coded bars indicating which samples are pre-flight (black), during flight (yellow), and post-flight (orange). The error bars represent technical replicates. F) Levels of antioxidative capacity, 8OHdG, and PGF2-alpha in astronauts’ blood and urine for 59 crewmembers. Repeated measures analysis of variance was conducted to test for differences during and after flight compared to preflight, and comparisons among time points were made using a Bonferroni t-test. Multiple comparisons were accounted for, and only those tests with p<0.001 are reported. Full data table available in Table S3. G) Heatmaps show flux values (rows) vs mice (columns) from both RR1 and RR3 experiments for liver and muscle. Flux values are calculated as described in the methods, showing in the leftmost bar those fluxes whose differential testing results between FLT and GC result in p-values<0.05 (black) or suggestive where p-values fall between 0.05 and 0.1 (grey). Heatmap color scales indicate row-wise Z-scores for a particular flux, with Z-score ranges for that map indicated by key. Links to full heatmaps with all fluxes for all pathways in the tested tissues, as well as flux maps for the above can be found at https://osf.io/utmwf/ which also includes data used to generate these figures.
Figure 4:
Figure 4:. Immune response related pathways and blood parameters affected by spaceflight in vitro and in vivo.
A) Pathway analysis of the impact of spaceflight on in vitro data. Cytoscape enrichment maps from GSEA on GO and KEGG sets with FDR <10% in at least two in vitro GLDS datasets. B) Liver, Kidney, Eye and Adrenal Gland Tissue Analysis from C57BL/6 and BALB/C mice from mission RR1 and RR3, C) C57BL/6 extensor digitorum longus (EDL), gastrocnemius (GST), quadriceps (Quad), soleus (SLS), tibialis anterior (TA), and BALB/C carotid artery (Carotid). B) and C) Pathway results were integrated across multiple tissues and RNAseq and proteomics platforms and details for analysis is available in Figure 2B and 2C.
Figure 5:
Figure 5:. Immune response related methylated pathways, blood parameters, and bone loss pathways affected by spaceflight in vivo and in astronauts.
A) Heatmap representation of GSEA analysis on the methylated genes. B) Blood levels of 1,25 Vitamin D, VEGF-1, IGF-1, IL-1a, IL-1b and IL-1ra in astronauts for 59 crewmembers. Details available on analysis in Figure Legend 3F. C) WGCNA heatmap plot with arrows identify key hubs in spaceflight for liver samples. D) GO pathway analysis utilizing ClueGo from the genes identified in the spaceflight correlated WGCNA modules.
Figure 6.
Figure 6.. Lipid metabolism related pathways and blood parameters affected by spaceflight in mice and in astronauts.
A) Pathway results were integrated across multiple tissues and RNAseq and proteomics platforms and details for analysis is available in Figure 2B and 2C. B) Blood levels for cholesterol and LDL in astronauts for 59 crewmembers. Details available on analysis in Figure Legend 3F. Full data table available in Table S3. C) and D) Heatmaps show flux values (rows) vs mice (columns) from both RR1 and RR3 experiments for liver (C) and muscle (D). Details available on analysis in Figure Legend 3G.
Figure 7.
Figure 7.. Circadian rhythm, olfactory activity and extra-cellular matrix (ECM) related pathways and blood parameters affected by spaceflight in vitro, in vivo, and in astronauts.
A) Network representation of in vitro datasets on GO and KEGG sets with FDR <10% in at least two GLDS datasets. B) and C) Pathway results were integrated across multiple tissues and RNAseq and proteomics platforms and details for analysis is available in Figure 2B and 2C. D) Heatmap representation of GSEA analysis on the methylated genes. E) Blood levels for renin in astronauts’ blood for 59 crewmembers. Details available on analysis in Figure Legend 3F.

References

    1. Akalin A, Kormaksson M, Li S, Garrett-Bakelman FE, Figueroa ME, Melnick A, and Mason CE (2012). methylKit: a comprehensive R package for the analysis of genome-wide DNA methylation profiles. Genome Biol 13, R87. - PMC - PubMed
    1. Alam S, Abdullah CS, Aishwarya R, Morshed M, and Bhuiyan MS (2020). Molecular Perspectives of Mitochondrial Adaptations and Their Role in Cardiac Proteostasis. Front Physiol 11, 1054. - PMC - PubMed
    1. Aranow C (2011). Vitamin D and the immune system. J Investig Med 59, 881–886. - PMC - PubMed
    1. Argiles JM, Campos N, Lopez-Pedrosa JM, Rueda R, and Rodriguez-Manas L (2016). Skeletal Muscle Regulates Metabolism via Interorgan Crosstalk: Roles in Health and Disease. J Am Med Dir Assoc 17, 789–796. - PubMed
    1. Arrieta A, Blackwood EA, Stauffer WT, and Glembotski CC (2020). Integrating ER and Mitochondrial Proteostasis in the Healthy and Diseased Heart. Frontiers in Cardiovascular Medicine 6. - PMC - PubMed

Publication types