. 2021 Apr:199:101962.
doi: 10.1016/j.pneurobio.2020.101962. Epub 2020 Nov 23.

How auditory selectivity for sound timing arises: The diverse roles of GABAergic inhibition in shaping the excitation to interval-selective midbrain neurons

Affiliations

How auditory selectivity for sound timing arises: The diverse roles of GABAergic inhibition in shaping the excitation to interval-selective midbrain neurons

Rishi K Alluri et al. Prog Neurobiol. 2021 Apr.

Abstract

Across sensory systems, temporal frequency information is progressively transformed along ascending central pathways. Despite considerable effort to elucidate the mechanistic basis of these transformations, they remain poorly understood. Here we used a novel constellation of approaches, including whole-cell recordings and focal pharmacological manipulation, in vivo, and new computational algorithms that identify conductances resulting from excitation, inhibition and active membrane properties, to elucidate the mechanisms underlying the selectivity of midbrain auditory neurons for long temporal intervals. Surprisingly, we found that stimulus-driven excitation can be increased and its selectivity decreased following attenuation of inhibition with gabazine or intracellular delivery of fluoride. We propose that this nonlinear interaction is due to shunting inhibition. The rate-dependence of this inhibition results in the illusion that excitation to a cell shows greater temporal selectivity than is actually the case. We also show that rate-dependent depression of excitation, an important component of long-interval selectivity, can be decreased after attenuating inhibition. These novel findings indicate that nonlinear shunting inhibition plays a key role in shaping the amplitude and interval selectivity of excitation. Our findings provide a major advance in understanding how the brain decodes intervals and may explain paradoxical temporal selectivity of excitation to midbrain neurons reported previously.

Keywords: GABA; In vivo; Midbrain; Shunting inhibition; Temporal selectivity; Whole-cell recording.


Figures

Figure 1:
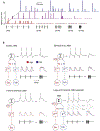
Figure 1:. Range and mechanistic models of long-interval selectivity.
(A) Peristimulus time histograms (PSTHs) of spike occurrences (bin size of 10 ms) per stimulus repetition, recorded from 3 cells in the anuran (L. pipiens) inferior colliculus, that represent the observed range of selectivity to long intervals; stimulus pulse rates (pulses per second, pps) are displayed on the x axis. Top blue, weakly selective neuron with phasic-onset type response; middle (magenta) and bottom (red) histograms show PSTHs for moderately and strongly selective long-interval neurons. (B) Models illustrate how interplay between excitation (Exc, red) and inhibition (Inh, blue) alone (upper left), or with short-term depression (STD) of excitation could generate long-interval selectivity. Inhibition either lags (m < n; z−m is delay by m samples) or precedes (m > n) excitation. Additionally, postinhibitory rebound (PIR) depolarization as postulated by Large and Crawford (2002) could contribute to long-interval selectivity.
Figure 2.
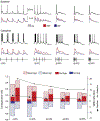
Figure 2.. Inhibition that precedes excitation and is tonic generates strongest long-interval selectivity.
(A) Long-interval neuron showing phasic responses to stimulus onset at fast pulse rates (pulses/s, pps). Whole-cell membrane potential recordings of single (black traces) and averaged (gray traces) responses, at 0nA current injection, to stimulus pulse rates shown; spikes were removed for averaging. Changes in leading excitatory (Δge, red) and lagging inhibitory (Δgi, blue) conductances in response to sound stimuli are shown below voltage traces. Bar plots (right) show the mean Δge (red, striped) and Δgi (blue, striped), net Δge (Δge – Δgi, red) and Δgi (blue), and spike rate measured as spikes per stimulus (sps; black line with solid circle markers) at presented pulse rates. Resting potential = −45 mV; carrier frequency = 375 Hz. stimulus amplitude = 66 dB SPL. (B) Neuron strongly selective for long intervals. Stimulus-elicited inhibition precedes and completely overlaps excitation at fast rates (60 pps). Resting potential = −67 mV; carrier frequency = 600 Hz. stimulus amplitude = 42 dB SPL.
Figure 3.
Figure 3.. Decrease in net excitation across pulse rates best predicts long-interval selectivity.
Drop in (A) net excitation (Δge – Δgi) or (B) mean Δge, from slow (5–10 pulses/s) to fast (40–60 pulses/s) pulse rates vs. long-interval selectivity (measured as drop in mean depolarization, red filled circles and regression line, or drop in spike rate, black crosses and regression line) for 20 neurons. The slope of the regression line (1.283) indicates a strong dependence between net excitation and long-interval selectivity. Results suggest a critical role for inhibition and its interaction with rate-dependent drop in excitation in generating selectivity for long intervals.
Figure 4.
Figure 4.. Inhibition is critical for selectivity in most long-interval neurons.
Relation between long-interval selectivity (% change in spike rate for slow vs. fast pulse rates, PRs) before (baseline, x-axis) and after attenuating inhibition (y-axis); maximum selectivity = 100%. Inhibition was attenuated in two ways: 1) focal iontophoresis of gabazine (circles) or 2) intracellular loading of the cell with fluoride (crosses); pipette solution contained potassium fluoride. The dotted line represents no change in selectivity.
Figure 5.
Figure 5.. Inhibition shapes strength and time course of excitatory inputs.
(A,B) Representative cases of neurons that exhibited decreased selectivity with attenuation of inhibition. Membrane potential recordings (black traces) and spike rate measures (spikes per stimulus presentation, sps) during baseline (filled circles, solid line) and after gabazine iontophoresis (A, 4 min; B, 3 min) (open circles, dotted line); depolarizations and spike rate increased at every pulse rate (PR). Phasic excitation (Δge, red) led inhibition (Δgi, blue) resulting in a phasic onset response at all PRs. (A) Attenuating inhibition increased the strength of excitatory conductance changes (Δge), and transformed the time course from phasic to tonic. Bar plots, corresponding to the markers, show the mean Δge (red, striped) and Δgi (blue, striped), the net Δge (red) and Δgi (blue) at PRs shown. Resting potential = −59 mV; carrier frequency = 1600 Hz. stimulus amplitude = 46 dB SPL. (B) Attenuating inhibition broadened selectivity of the neuron, as seen by spike rate differences at baseline vs. gabazine. In this case, however, the time course of Δge wasn’t altered despite an increase in strength. Resting potential = −62mV; carrier frequency = 340 Hz; stimulus amplitude = 54 dB SPL.
Figure 6.
Figure 6.. Inhibition can decrease response gain without affecting interval selectivity.
Representative case for neurons that showed little or no change in selectivity with attenuation of inhibition (Δgi, blue) despite increased response levels (black traces) across stimulus pulse rates, indicating the role of inhibition in regulating response gain. Iontophoresis of gabazine for 5 min had relatively little effect on the amplitude or time course of excitation (Δge, red). Spike responses, measured as spikes per stimulus presentation (sps) are shown for baseline (solid circles and line) and gabazine (open circles, dotted line) conditions. Bar plots, corresponding to the markers, show the mean Δge (red, striped) and Δgi (blue, striped), the net Δge (red) and Δgi (blue) at presented pulse rates. Resting potential = −69 mV; carrier frequency = 425 Hz. stimulus amplitude = 63 dB SPL.
Figure 7.
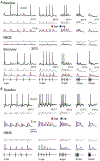
Figure 7.. Evidence for shunting inhibition: Fluoride-mediated attenuation of inhibition to recorded cells increases the amplitude and can decrease the long-interval selectivity of excitation.
(A,B) Membrane potential responses (black traces) and estimates of changes in excitatory (Δge, red traces) and inhibitory (Δgi, blue traces) conductances of two neurons to 12 ms sound pulses presented at the rates shown, before and after (A, 2 min; B, 5 min) loading with fluoride to attenuate inhibition. Excitation preceded (A) or lagged (B) inhibition. Bar plots (right) present mean and net Δge and Δgi before (bars below filled symbols) and after (bars below open symbols) fluoride-mediated attenuation of inhibition. Fluoride moderately (A) or strongly (B) decreased long-interval selectivity, as measured from spike responses (spikes/stimulus presentation, SPS). Fluoride also increased the amplitude and decreased the long-interval selectivity of the mean Δge, suggesting a shunting-type role for inhibition in long-interval selectivity. (A,B) Resting potentials = −51, −45 mV; carrier frequency = 180, 675 Hz. stimulus amplitude = 67, 43 dB SPL.
Figure 8.
Figure 8.. Postinhibitory rebound depolarization does not contribute to long-interval selectivity.
(A, B) Responses (representative, black traces; averaged, grey traces) of two long-interval neurons, to presented stimuli are shown; the spikes per stimulus repetition are presented adjacent to the traces. Estimates of excitation (Δge, red trace) preceded (A) or lagged (B) that of inhibition (Δgi, blue trace). Iontophoresis of NBQX (A, 6.5 min; B 7.2 min) attenuated excitatory input to the cells; a phasic depolarization at the end of the inhibitory time course, a characteristic of postinhibitory rebound was not observed. Following recovery (A, 20 minutes after stopping iontophoresis), the strength of excitation was restored. (A, B) Resting potential = −72, −59 mV; carrier frequency = 1500, 250 Hz; stimulus amplitude = 71, 57 dB SPL.

Similar articles

Cited by

References

    1. ALDER TB & ROSE GJ 2000. Integration and recovery processes contribute to the temporal selectivity of neurons in the midbrain of the northern leopard frog, Rana pipiens. J Comp Physiol A, 186, 923–37. - PubMed
    1. ALLURI RK, ROSE GJ, HANSON JL, LEARY CJ, VASQUEZ-OPAZO GA, GRAHAM JA & WILKERSON J 2016. Phasic, suprathreshold excitation and sustained inhibition underlie neuronal selectivity for short-duration sounds. Proceedings of the National Academy of Sciences, 113, E1927–E1935. - PMC - PubMed
    1. ANDERSON JS, LAMPL I, GILLESPIE DC & FERSTER D 2001. Membrane potential and conductance changes underlying length tuning of cells in cat primary visual cortex. The Journal of Neuroscience, 21, 2104–2112. - PMC - PubMed
    1. ATHERTON LA, BURNELL ES & MELLOR JR 2016. Assessment of methods for the intracellular blockade of GABAA receptors. PloS one, 11, e0160900. - PMC - PubMed
    1. ATKINS G, CHIBA A, ATKINS S & STOUT JF 1988. Low-pass filtering of sound signals by a high-frequency brain neuron and its input in the cricketAcheta domestica L. Journal of Comparative Physiology A, 164, 269–276.

Publication types