

Cerebral oxygen extraction fraction (OEF): Comparison of challenge-free gradient echo QSM+qBOLD (QQ) with 15O PET in healthy adults
- PMID: 33243071
- PMCID: PMC8221765
- DOI: 10.1177/0271678X20973951
Cerebral oxygen extraction fraction (OEF): Comparison of challenge-free gradient echo QSM+qBOLD (QQ) with 15O PET in healthy adults
Abstract
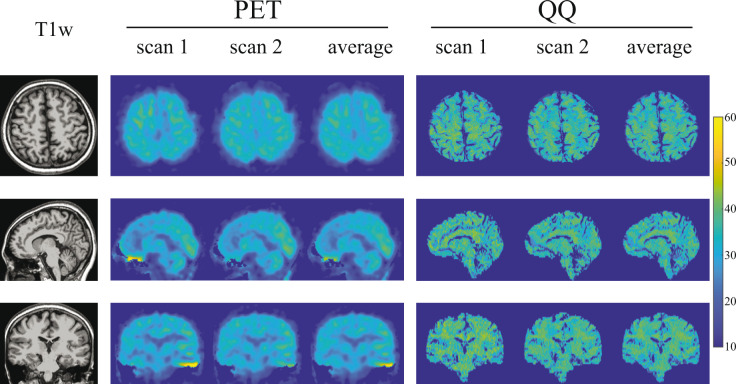
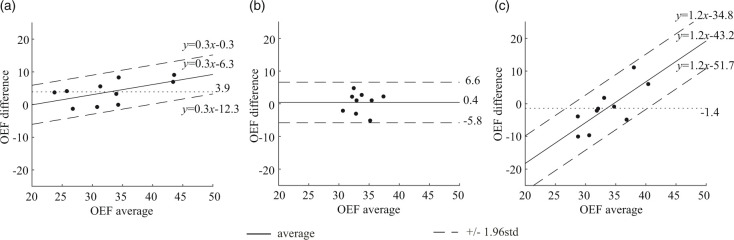
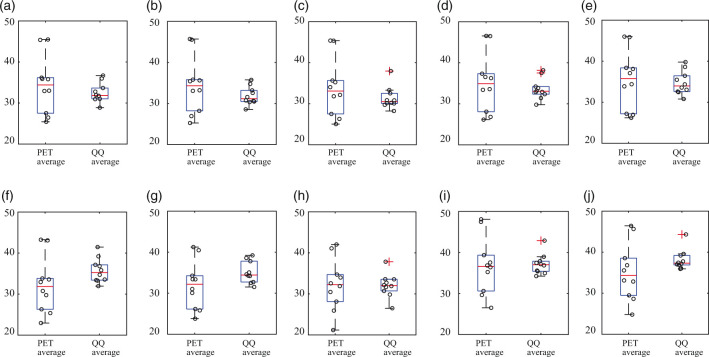
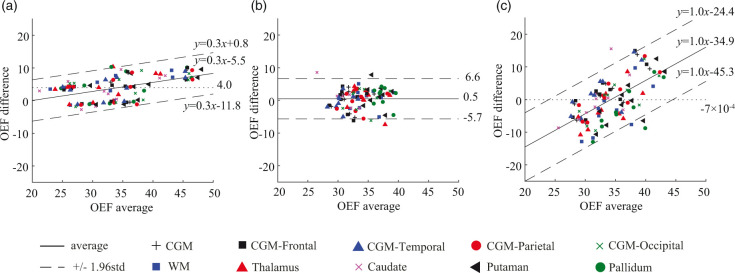
We aimed to validate oxygen extraction fraction (OEF) estimations by quantitative susceptibility mapping plus quantitative blood oxygen-level dependence (QSM+qBOLD, or QQ) using 15O-PET. In ten healthy adult brains, PET and MRI were acquired simultaneously on a PET/MR scanner. PET was acquired using C[15O], O[15O], and H2[15O]. Image-derived arterial input functions and standard models of oxygen metabolism provided quantification of PET. MRI included T1-weighted imaging, time-of-flight angiography, and multi-echo gradient-echo imaging that was processed for QQ. Region of interest (ROI) analyses compared PET OEF and QQ OEF. In ROI analyses, the averaged OEF differences between PET and QQ were generally small and statistically insignificant. For whole brains, the average and standard deviation of OEF was 32.8 ± 6.7% for PET; OEF was 34.2 ± 2.6% for QQ. Bland-Altman plots quantified agreement between PET OEF and QQ OEF. The interval between the 95% limits of agreement was 16.9 ± 4.0% for whole brains. Our validation study suggests that respiratory challenge-free QQ-OEF mapping may be useful for non-invasive clinical assessment of regional OEF impairment.
Keywords: Oxygen extraction fraction; QSM+qBOLD; positron emission tomography; quantitative blood oxygenation level-dependent imaging; quantitative susceptibility mapping.
Conflict of interest statement
Figures
References
-
- Derdeyn CP, Yundt KD, Videen TO, et al. Increased oxygen extraction fraction is associated with prior ischemic events in patients with carotid occlusion. Stroke 1998; 29: 754–758. - PubMed
-
- Yamauchi H, Fukuyama H, Nagahama Y, et al. Significance of increased oxygen extraction fraction in five-year prognosis of major cerebral arterial occlusive diseases. J Nucl Med 1999; 40: 1992–1998. - PubMed
-
- Derdeyn CP, Videen TO, Yundt KD, et al. Variability of cerebral blood volume and oxygen extraction: stages of cerebral haemodynamic impairment revisited. Brain 2002; 125: 595–607. - PubMed
-
- Ito M, Lammertsma AA, Wise RJS, et al. Measurement of regional cerebral blood flow and oxygen utilisation in patients with cerebral tumours using 15O and positron emission tomography: Analytical techniques and preliminary results. Neuroradiology 1982; 23: 63–74. - PubMed
Publication types
MeSH terms
Substances
Grants and funding
LinkOut - more resources
Full Text Sources
