

A distinct neuromelanin magnetic resonance imaging pattern in parkinsonian multiple system atrophy
- PMID: 33243166
- PMCID: PMC7694430
- DOI: 10.1186/s12883-020-02007-5
A distinct neuromelanin magnetic resonance imaging pattern in parkinsonian multiple system atrophy
Abstract
Background: Parkinsonian variant of multiple system atrophy is a neurodegenerative disorder frequently misdiagnosed as Parkinson's disease. No early imaging biomarkers currently differentiate these disorders.
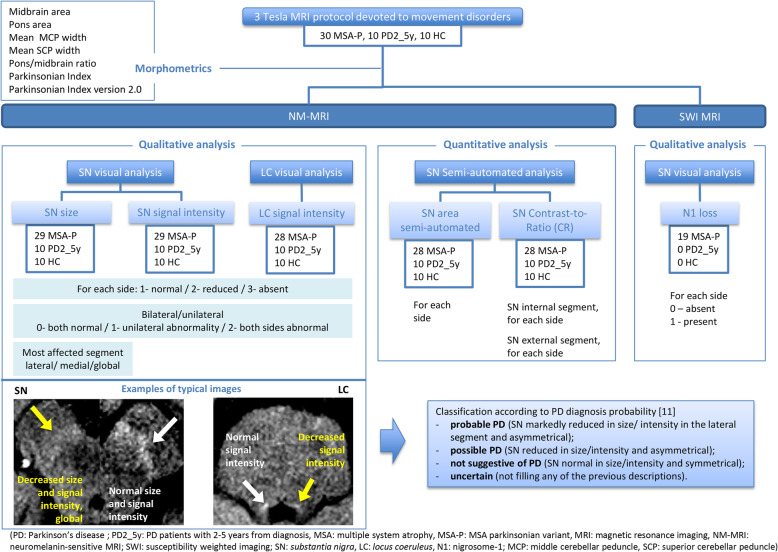
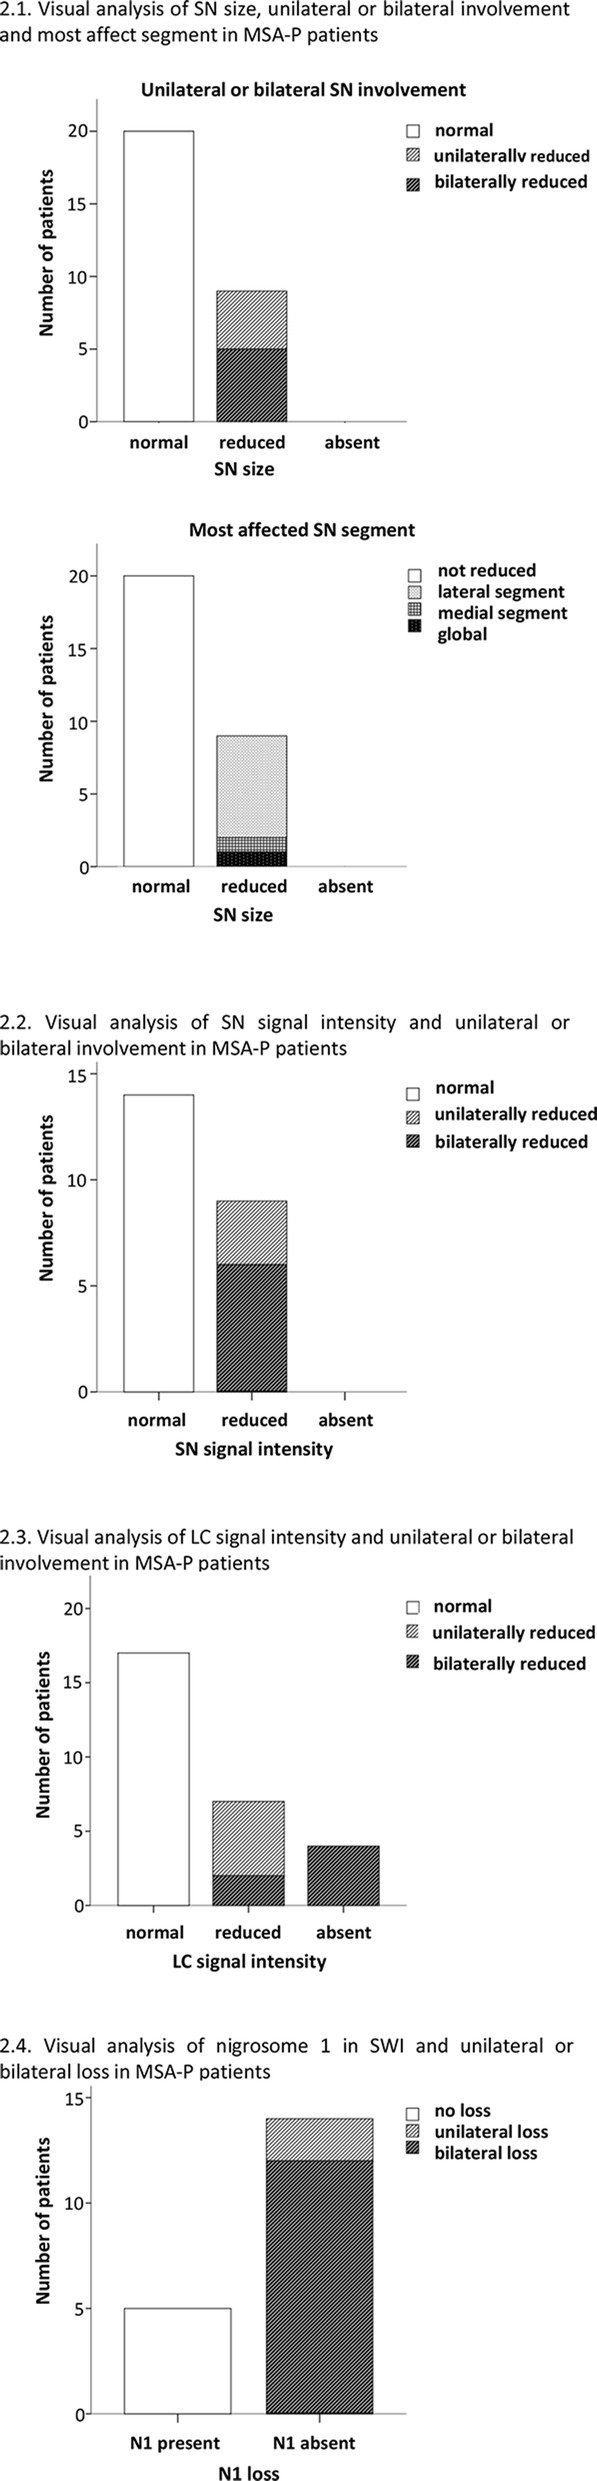
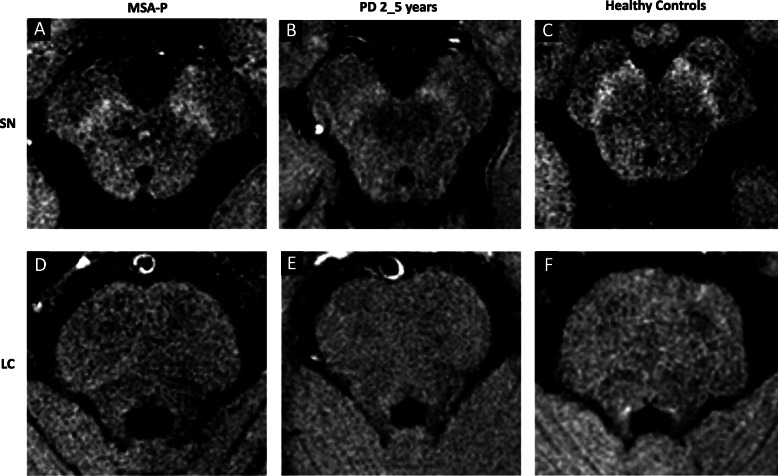
Methods: Simple visual imaging analysis of the substantia nigra and locus coeruleus in neuromelanin-sensitive magnetic resonance imaging and nigrosome 1 in susceptibility-weighted sequences was performed in thirty patients with parkinsonian variant of multiple system atrophy fulfilling possible/probable second consensus diagnostic criteria. The neuromelanin visual pattern was compared to patients with Parkinson's disease with the same disease duration (n = 10) and healthy controls (n = 10). Substantia nigra semi-automated neuromelanin area/signal intensity was compared to the visual data.
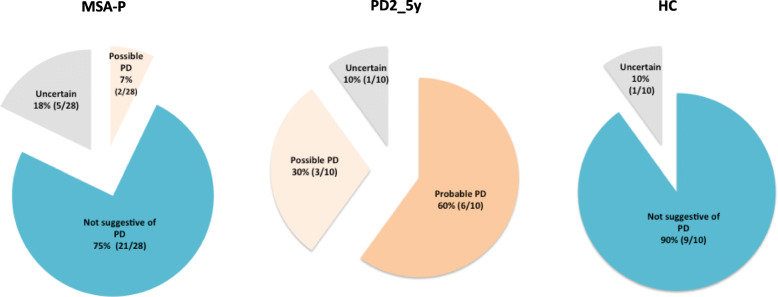
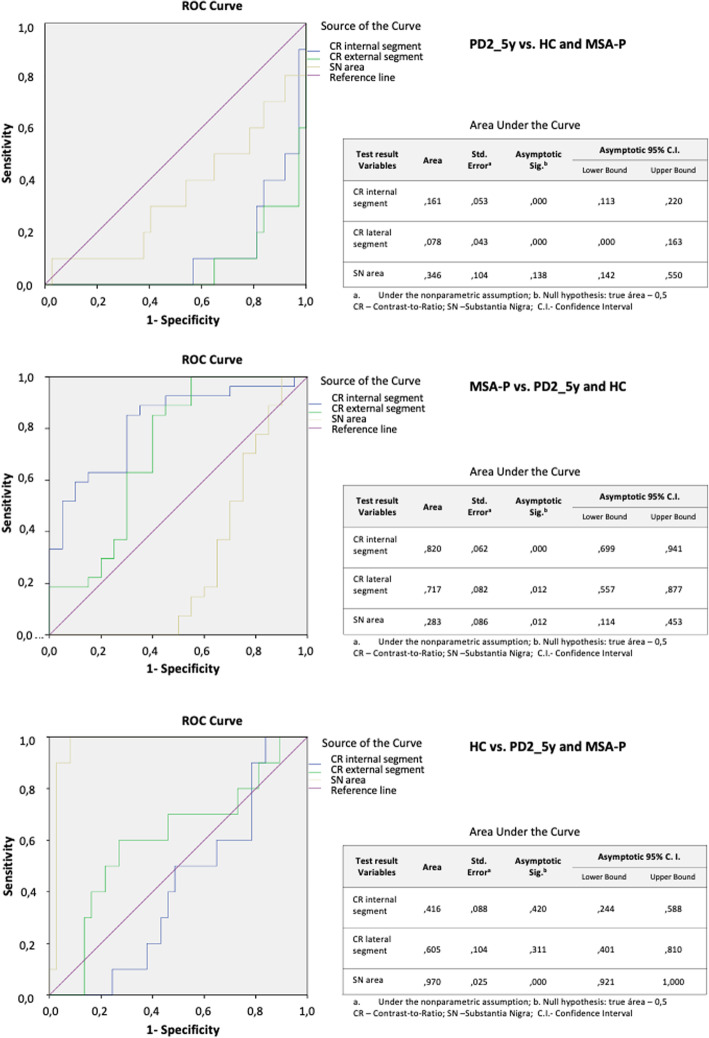
Results: Groups were similar in age, sex, disease duration, and levodopa equivalent dose. Hoehn & Yahr stage was higher in parkinsonian multiple system atrophy patients, 69% of whom had normal neuromelanin size/signal, significantly different from Parkinson's disease patients, and similar to controls. Nigrosome 1 signal was lost in 74% of parkinsonian multiple system atrophy patients. Semi-automated neuromelanin substantia nigra signal, but not area, measurements were able to differentiate groups.
Conclusions: In patients with parkinsonism, simple visual magnetic resonance imaging analysis showing normal neuromelanin substantia nigra and locus coeruleus, combined with nigrosome 1 loss, allowed the distinction of the parkinsonian variant of multiple system atrophy from Parkinson's disease and healthy controls. This easy and widely available method was superior to semi-automated measurements in identifying specific imaging changes in substantia nigra and locus coeruleus.
Keywords: MRI; Multiple system atrophy; Neuromelanin; Nigrosome 1; Susceptibility-weighted imaging.
Conflict of interest statement
RMS has no conflict of interest relevant to this work but is currently a consultant for BIAL – PORTELA & C.a, S.A. and has been a consultant for Zambon and AbbVie.
JJF has no conflict of interest relevant to this work but reports having received grants from GlaxoSmithKline, Grunenthal, Fundação MSD (Portugal), TEVA, MSD, Allergan, Novartis, Medtronic. He received consultancy fees from GlaxoSmithKline, Novartis, TEVA, Lundbeck, Solvay, BIAL, Merck-Serono, Merz, Ipsen, Biogen, Acadia, Allergan, Abbvie, Sunovion Pharmaceuticals. He is employed by Faculdade de Medicina de Lisboa and CNS - Campus Neurológico Sénior. He also participated in advisory boards for Bial and expert testimony to Novartis.
MF has no conflict of interest relevant to this work but received honoraria to speak from AbbVie.
Remaining authors have no conflict of interest nor relevant disclosures for the past 12 months.
Figures

References
MeSH terms
Substances
LinkOut - more resources
Full Text Sources
