Observational Study
. 2021 May;80(5):591-597.
doi: 10.1136/annrheumdis-2020-218186. Epub 2020 Nov 26.

IL-23 skin and joint profiling in psoriatic arthritis: novel perspectives in understanding clinical responses to IL-23 inhibitors

Affiliations
Observational Study

IL-23 skin and joint profiling in psoriatic arthritis: novel perspectives in understanding clinical responses to IL-23 inhibitors

Alessandra Nerviani et al. Ann Rheum Dis. 2021 May.

Abstract

Objectives: To determine the relationship between synovial versus skin transcriptional/histological profiles in patients with active psoriatic arthritis (PsA) and explore mechanistic links between diseased tissue pathology and clinical outcomes.

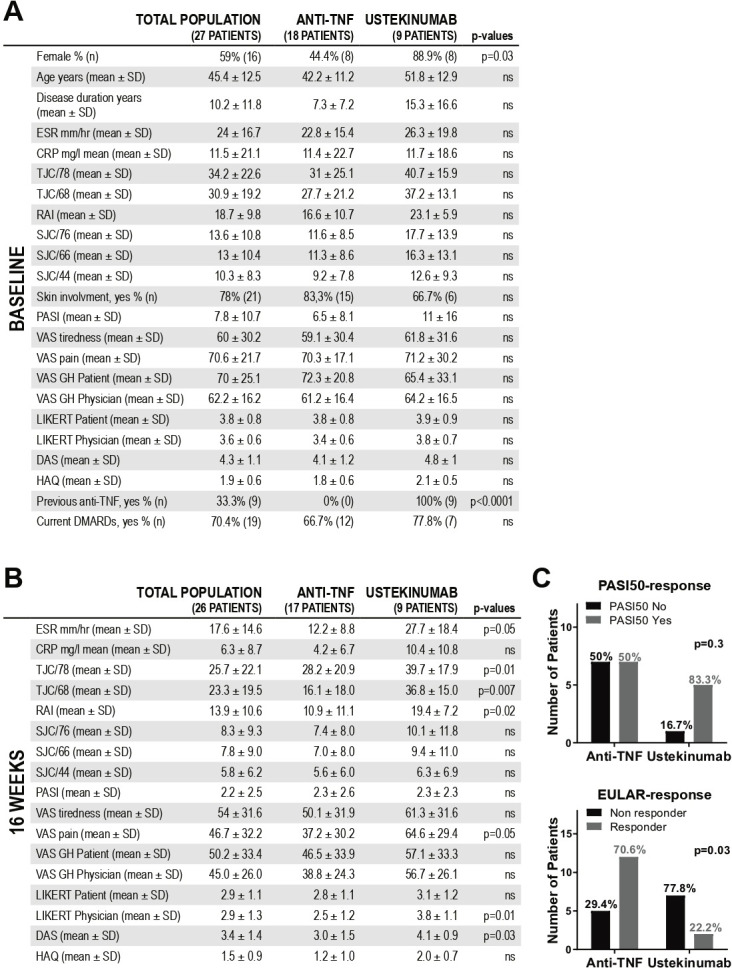
Methods: Twenty-seven active PsA patients were enrolled in an observational/open-label study and underwent biopsies of synovium and paired lesional/non-lesional skin before starting anti-tumour necrosis factor (TNF) (if biologic-naïve) or ustekinumab (if anti-TNF inadequate responders). Molecular analysis of 80-inflammation-related genes and protein levels for interleukin (IL)-23p40/IL-23p19/IL-23R were assessed by real-time-PCR and immunohistochemistry, respectively.

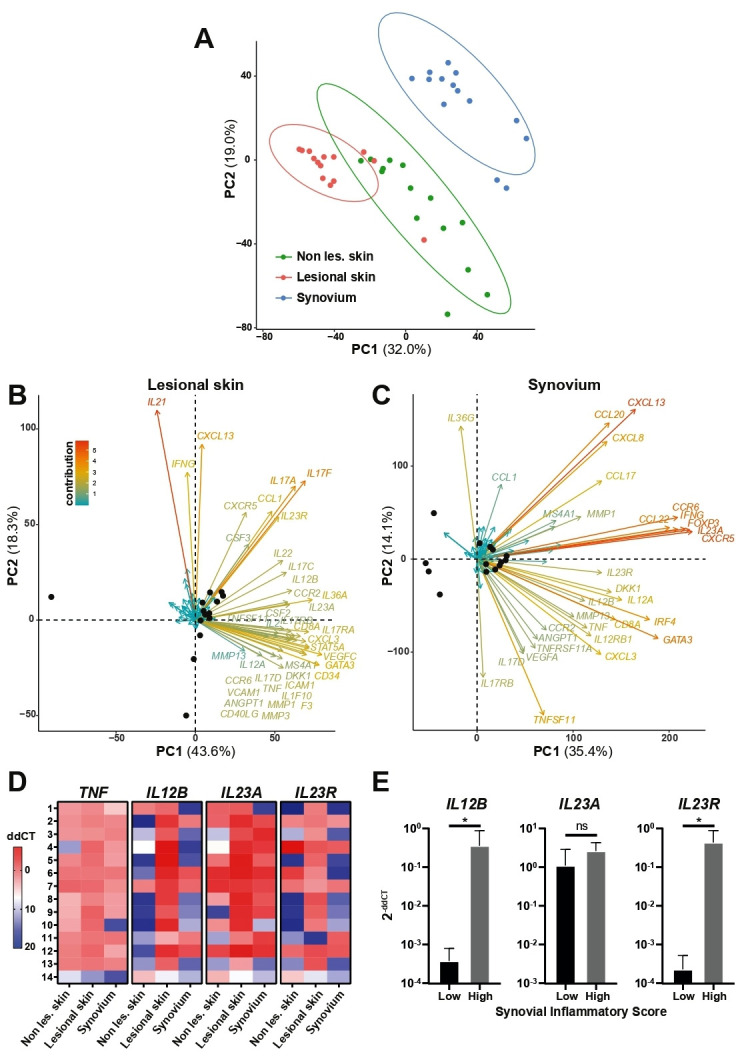
Results: At baseline, all patients had persistent active disease as per inclusion criteria. At primary end-point (16-weeks post-treatment), skin responses favoured ustekinumab, while joint responses favoured anti-TNF therapies. Principal component analysis revealed distinct clustering of synovial tissue gene expression away from the matched skin. While IL12B, IL23A and IL23R were homogeneously expressed in lesional skin, their expression was extremely heterogeneous in paired synovial tissues. Here, IL-23 transcriptomic/protein expression was strongly linked to patients with high-grade synovitis who, however, were not distinguishable by conventional clinimetric measures.

Conclusions: PsA synovial tissue shows a heterogeneous IL-23 axis profile when compared with matched skin. Synovial molecular pathology may help to identify among clinically indistinguishable patients those with a greater probability of responding to IL-23 inhibitors.

Keywords: arthritis; biological therapy; psoriatic; synovitis.


Conflict of interest statement

Competing interests: None declared.

Figures

Figure 1
Figure 1
Baseline and 16 weeks characteristics of the patients included in the psoriatic arthritis pathobiology and its relationship with clinical disease activity (PsABRE) study. (A) Baseline features of the whole cohort (n=27) and comparison of variables between patients receiving anti-TNF (n=18) or ustekinumab (n=9). (B) Patients’ characteristics at the chosen primary endpoint, that is, 16-weeks post-treatment (n=26, one patient lost to follow-up) and comparison between TNFi- (n=17) and ustekinumab-treated patients (n=9). (A, B) P values calculated using Mann-Whitney U test or Fisher’s exact test as required (TNFi-arm vs ustekinumab-arm). (C) Skin (PASI50) and joints (EULAR(DAS) good/moderate vs none) response at 16 weeks. P values calculated using Fisher’s exact test. CRP, C reactive protein; DAS, Disease Activity Score; DMARDs, disease-modifying antirheumatic drugs; ESR, erythrocyte sedimentation rate; N, number; NS, non-significant; PASI, Psoriasis Area and Severity Index; RAI, Ritchie Articular Index; SJC, swollen joints count; TJC, tender joints count; TNF, tumour necrosis factor; VAS, Visual Analogue Scale (0–100).
Figure 2
Figure 2
Gene expression analysis in matched skin and synovium from PsA patients. (A) Principal component (PC) analysis (PCA) performed on the expression data of a set of 80 selected genes in 14 matched non-lesional (non les.) and lesional skin and synovium. The first two eigenvalues were plotted with data ellipses for each tissue type using a CI of 0.95. The PCA clearly separates synovium (blue dots) from non-lesional skin (non les., green dots) and lesional skin (red dots). (B, C) Biplots showing individuals repartition in PC1 and 2 (black dots) and loading plots assessing the contribution of each of the 80 genes analysed in the PC, displayed for the lesional skin (B) and synovial tissues (C). Genes names are indicated if their contribution to the PC variance is >1. The PCA and biplots were created using function prcomp from the stats package within R statistics (version 3.5.3) and factoextra R package (D) Heatmap representing TNF, IL12B (IL-23p40 protein), IL23A (IL-23p19 protein) and IL23R expression in 14 matched non-lesional (non les.) and lesional skin and synovium samples. dd-threshold cycles (ddCTs) are shown in colorimetric scale (low expression in blue, high expression in red). Lines 1–11 represent anti-TNF-treated patients, lines 12–14 ustekinumab-treated patients. E, IL12B, IL23A and IL23R gene expression in synovial biopsies classified as ‘low’ (0–1) and ‘high’ (2–7) synovial inflammatory score (Krenn’s score). P values were calculated using Mann-Whitney U test, *P<0.05, mean and SD are shown. IL-23, interleukin 23; TNF, tumour necrosis factor.
Figure 3
Figure 3
Expression of IL-23p40, IL-23p19 and IL-23R in skin and synovium from PsA patients. (A, C) representative images of sections of PSA non-lesional (non les.) and lesional skin (A) and synovial tissue of different degree of inflammatory scores (C) immunostained for IL-23p40, IL-23p19 and IL-23R. Scale bar=200 µm. Enlarged images correspond to the respective boxed areas. (B, D) Digital image analysis was performed on non-lesional and lesional skin (B) (n=11–12) and synovium (D) (low inflammatory score, n=4–8; high inflammatory score, n=13–14) sections. IL-23p40, IL23p19 and IL23R positive cells were determined using QuPath software and are presented as % of the total number of cells. Results are shown as mean±SD. *P<0.05, **P<0.01 as assessed by Mann-Whitney U test. (E) Correlations between inflammatory scores and IL-23p40, IL-23p19 or IL-23R percentages of positive cells within the synovial tissue. P values, calculated by Spearman’s bivariate correlation analysis, are indicated on each graph. IL-23, interleukin 23; PsA, psoriatic arthritis.

References

    1. Ritchlin CT, Colbert RA, Gladman DD. Psoriatic arthritis. N Engl J Med 2017;376:957–70. 10.1056/NEJMra1505557 - DOI - PubMed
    1. Boutet M-A, Nerviani A, Gallo Afflitto G, et al. . Role of the IL-23/IL-17 axis in psoriasis and psoriatic arthritis: the clinical importance of its divergence in skin and joints. Int J Mol Sci 2018;19:530. 10.3390/ijms19020530 - DOI - PMC - PubMed
    1. Bridgewood C, Sharif K, Sherlock J, et al. . Interleukin-23 pathway at the enthesis: the emerging story of enthesitis in spondyloarthropathy. Immunol Rev 2020;294:27–47. 10.1111/imr.12840 - DOI - PubMed
    1. Coates LC, Kavanaugh A, Mease PJ, et al. . Group for research and assessment of psoriasis and psoriatic arthritis 2015 treatment recommendations for psoriatic arthritis. Arthritis Rheumatol 2016;68:1060–71. 10.1002/art.39573 - DOI - PubMed
    1. Gossec L, Smolen JS, Ramiro S, et al. . European League against rheumatism (EULAR) recommendations for the management of psoriatic arthritis with pharmacological therapies: 2015 update. Ann Rheum Dis 2016;75:499–510. 10.1136/annrheumdis-2015-208337 - DOI - PubMed

Publication types

MeSH terms