. 2020 Nov 27;370(6520):eaaz6063.
doi: 10.1126/science.aaz6063.

In vivo Perturb-Seq reveals neuronal and glial abnormalities associated with autism risk genes

Affiliations

In vivo Perturb-Seq reveals neuronal and glial abnormalities associated with autism risk genes

Xin Jin et al. Science. .

Abstract

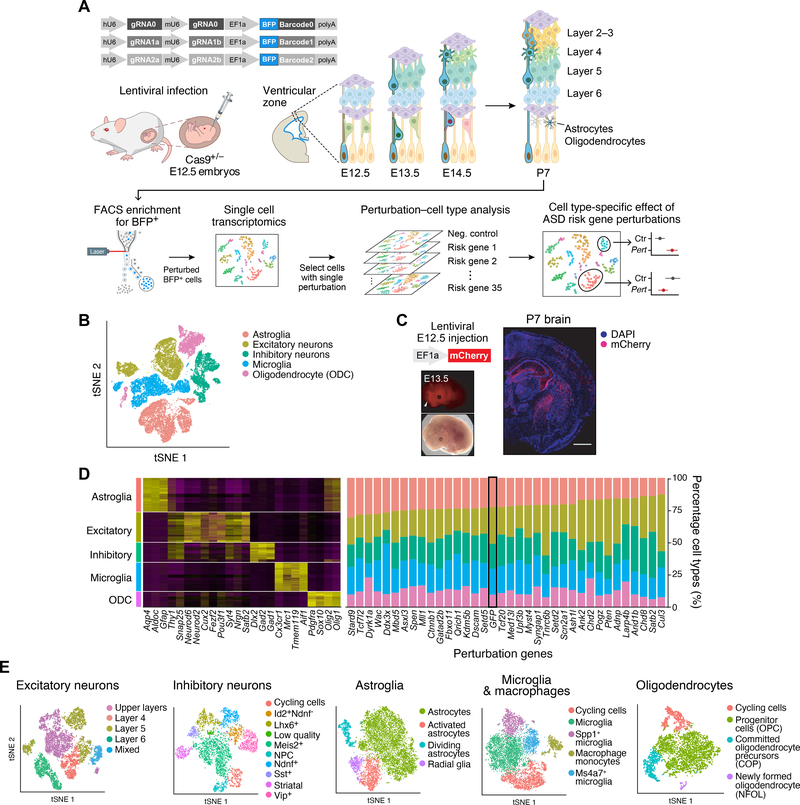
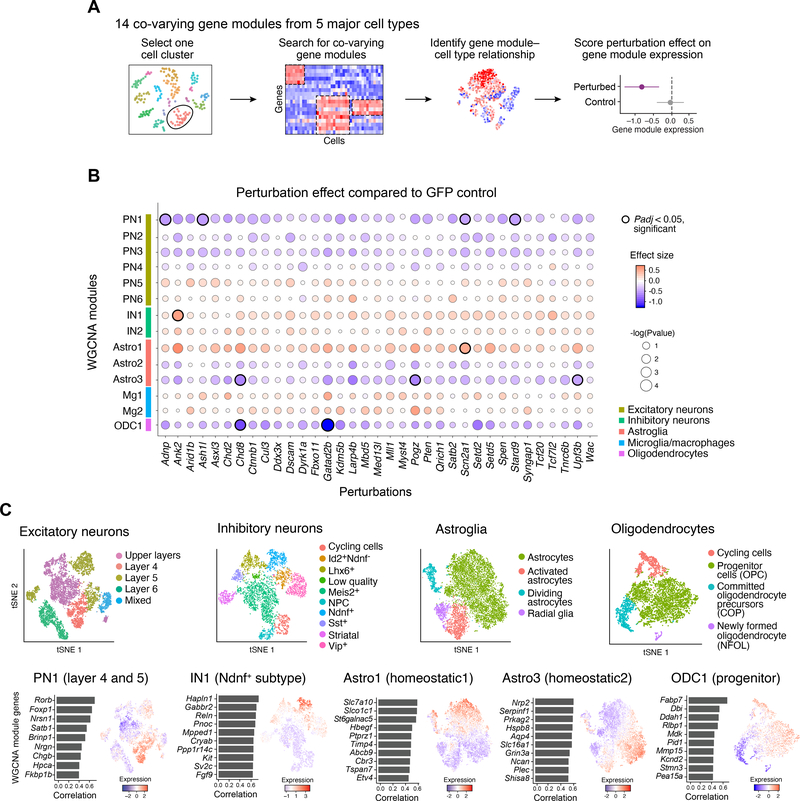
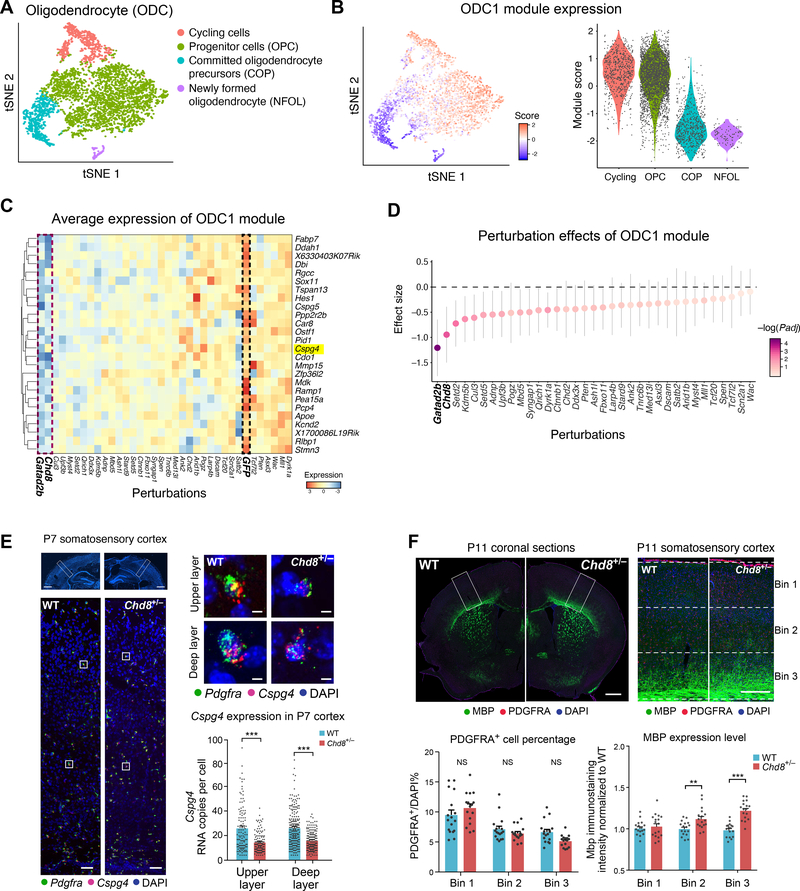
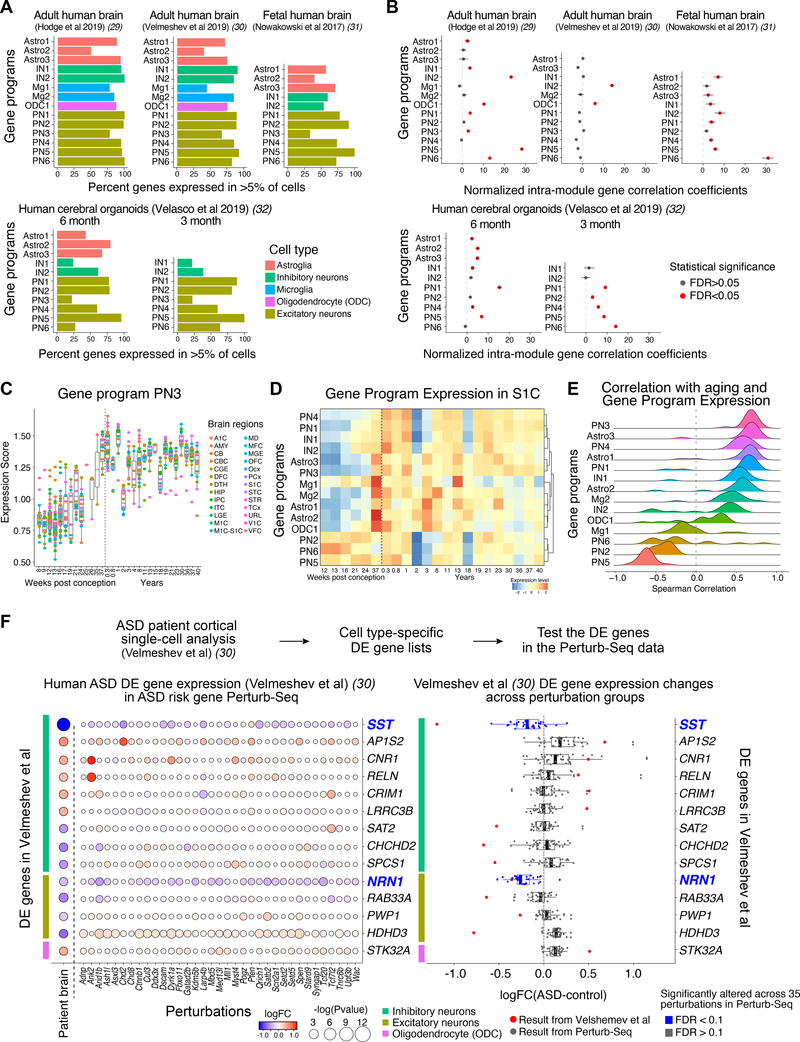
The number of disease risk genes and loci identified through human genetic studies far outstrips the capacity to systematically study their functions. We applied a scalable genetic screening approach, in vivo Perturb-Seq, to functionally evaluate 35 autism spectrum disorder/neurodevelopmental delay (ASD/ND) de novo loss-of-function risk genes. Using CRISPR-Cas9, we introduced frameshift mutations in these risk genes in pools, within the developing mouse brain in utero, followed by single-cell RNA-sequencing of perturbed cells in the postnatal brain. We identified cell type-specific and evolutionarily conserved gene modules from both neuronal and glial cell classes. Recurrent gene modules and cell types are affected across this cohort of perturbations, representing key cellular effects across sets of ASD/ND risk genes. In vivo Perturb-Seq allows us to investigate how diverse mutations affect cell types and states in the developing organism.


Conflict of interest statement

Competing interests: P.A. is a SAB member in System 1 Biosciences and Foresite Labs and is a co-founder of FL60. AR is a co-founder of and equity holder in Celsius Therapeutics, Equity holder in Immunitas. Until July 31, 2020, A.R. was an SAB member of ThermoFisher Scientific, Syros Pharmaceuticlas, Asimov, and Neogene Therapeutics. From August 2020, A.R. is an employee of Genetech. F.Z. is a co-founder of Editas Medicine, Beam Therapeutics, Pairwise Plants, Arbor Biotechnologies, and Sherlock Biosciences. X.J., S.S., A.R., F.Z. and P.A. are co-inventors on in vivo Perturb-Seq and CRISPR inventions filed by the Broad Institute relating to the work in this manuscript.

Figures

Figure 1.
Figure 1.. In vivo Perturb-Seq to investigate functions of a panel of ASD/ND risk genes harboring de novo variants.
(A) Schematics of the in vivo Perturb-Seq platform, which introduces mutations in individual genes in utero at E12.5, followed by transcriptomic profiling of the cellular progeny of these perturbed cells at P7 via single-cell RNA sequencing (scRNA-seq). (B) tSNE of five major cell populations identified in the Perturb-Seq cells. (C) In vivo Perturb-Seq lentiviral vector carrying an mCherry reporter drives detectable expression within 24h, and can sparsely infect brain cells across many brain regions. Scale bar is 1000μm. (D) Cell-type analysis of in vivo Perturb-Seq of ASD/ND de novo risk genes. Canonical marker genes were used to identify major cell clusters (left), and cell-type distribution in each perturbation group (right). Negative control (GFP) is highlighted by a black rectangle. (E) tSNEs showing the subclusters of each of the five major cell types, identified by re-clustering each cell type separately.
Figure 2.
Figure 2.. In vivo Perturb-Seq reveals cell-type specific effects of ASD/ND risk gene perturbations.
(A) Schematic illustration of the Perturb-Seq analysis pipeline. (B) ASD/ND risk gene perturbation effects in different WGCNA gene modules compared to GFP controls. Dot color corresponds to effect size, dot size corresponds to negative base 10 log(P-value). Module gene lists are presented in Table S2. P-values were calculated from linear modeling, Padj was calculated by Benjamini & Hochberg FDR correction. (C) The four cell types and five gene modules that were altered by ASD risk gene perturbations. Top row: subcluster tSNE of each cell class (repeated from Fig. 1E for ease of comparison). Bottom row: feature plots of gene module expression scores and the top correlated genes within each module across the relevant cell class.
Figure 3.
Figure 3.. Perturbation effect in oligodendrocytes and validation in the Chd8+/− mouse model.
(A) tSNE of oligodendrocyte subtypes from the Perturb-Seq data. (B) The ODC1 gene module expression score in each cell (left) and in each subcluster (right). (C) Average expression of genes in the ODC1 gene module (by row) in each perturbation group (by column), scaled by row. (D) Effect size of each perturbation on the ODC1 gene module compared to the control group. Note that the perturbation effects of the different genes present a continuous gradient. Error bars represent 95% confidence intervals. (E) In situ hybridization for Cspg4, a gene in module ODC1 that is a known marker of oligodendrocyte precursor cells (OPC), in the somatosensory cortex of P7 Chd8+/− and wild-type littermates. The bottom images of represent the higher magnifications of top images, and the right images represent higher magnifications for each cell. Right: quantification of Cspg4 expression in P7 cortex of Chd8+/− and wild-type littermates. Each dot represents the gene expression value from one cell; error bars represent standard error of the mean (n=3 animals per genotype). Scale bar is 1000μm (left bottom panel), 100μm (left top panel), and 10μm (right panel), respectively. (F) Immunohistochemistry for PDGFRA and MBP (markers for immature OPC and mature oligodendrocytes, respectively), PDGFRA+ cell counts, and distribution of MBP expression, in the somatosensory cortex of P11 Chd8+/− animals and wild-type littermates. Scale bar is 1000μm (left panel) and 250μm (right panel), respectively.
Figure 4.
Figure 4.. Cell-type specific gene modules from Perturb-Seq are conserved in developing human brains.
(A) Percent of genes with a human orthologue expressed in >5% of cells of the associated cell type in scRNA-seq datasets from the human brain or human brain organoids. (B) Normalized average pairwise correlation of gene expression within each gene module in the human brain or human brain organoids. Correlation values were normalized to the mean correlation from the background distribution, and divided by the standard deviation of the background distribution. Correlations are shown for modules with at least 4 genes after filtering out genes expressed in less than 5% of cells. Bars represent 95% confidence intervals. Red color represents statistical significance (FDR<0.05). (C) Expression of module PN3 over developmental time in human brain tissues across regions (BrainSpan data) (9). (D) Expression of each module over developmental time in human primary somatosensory cortex S1C (BrainSpan) (9). (E) Distribution of the Spearman correlation of module expression with age in human brain data over various brain regions (BrainSpan) (9). (F) Differential gene expression analysis of human prefrontal cortical samples from ASD donors and controls. Left: Expression of differentially expressed (DE) genes across cell types (color bars) from Velmeshev et al (31) (rows) in the Perturb-Seq data across a panel of ASD/ND risk genes (columns). Right: DE gene expression changes in Perturb-Seq data (black dots; each dot represents an ASD/ND risk gene perturbation) compared to DE values for the 14 genes found to be DE in ASD patients in the Velmeshev et al dataset (31) (FDR<0.2) (red dots). The two highlighted genes, SST and NRN1, showed decreased expression in the Perturb-Seq data (FDR<0.1), consistent with the ASD patient dataset.

Comment in

References

    1. de la Torre-Ubieta L, Won H, Stein JL, Geschwind DH, Advancing the understanding of autism disease mechanisms through genetics. Nat Med 22, 345–361 (2016). - PMC - PubMed
    1. Schizophrenia C Working Group of the Psychiatric Genomics, Biological insights from 108 schizophrenia-associated genetic loci. Nature 511, 421–427 (2014). - PMC - PubMed
    1. Jostins L et al., Host-microbe interactions have shaped the genetic architecture of inflammatory bowel disease. Nature 491, 119–124 (2012). - PMC - PubMed
    1. Satterstrom FK et al., Novel genes for autism implicate both excitatory and inhibitory cell lineages in risk. bioRxiv, 484113 (2018).
    1. Sanders SJ et al., De novo mutations revealed by whole-exome sequencing are strongly associated with autism. Nature 485, 237–241 (2012). - PMC - PubMed

Publication types

MeSH terms