. 2020 Nov 26;11(1):6016.
doi: 10.1038/s41467-020-19787-6.

Direct RNA sequencing reveals m6A modifications on adenovirus RNA are necessary for efficient splicing

Affiliations

Direct RNA sequencing reveals m6A modifications on adenovirus RNA are necessary for efficient splicing

Alexander M Price et al. Nat Commun. .

Abstract

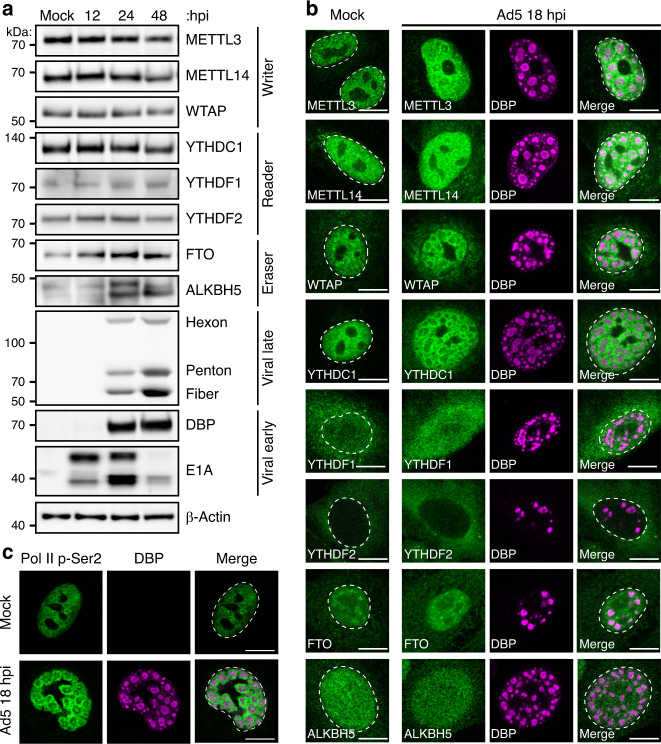
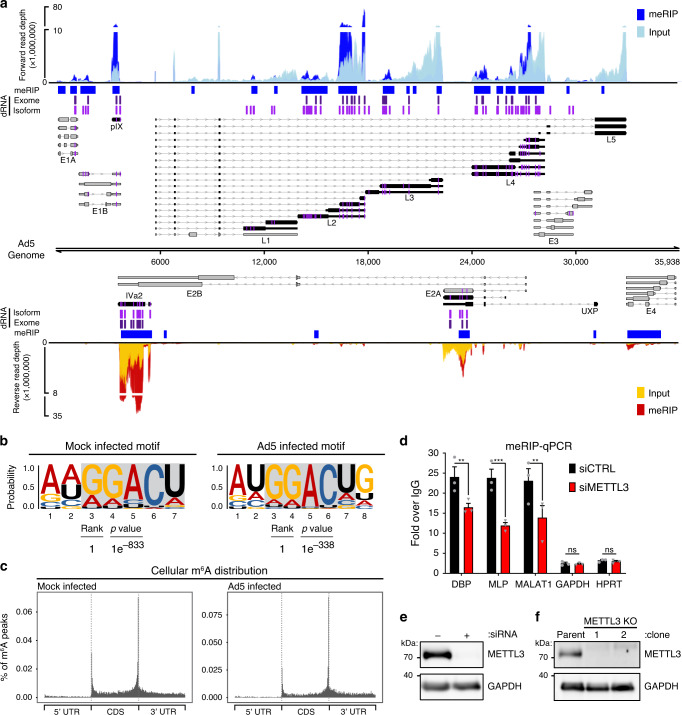
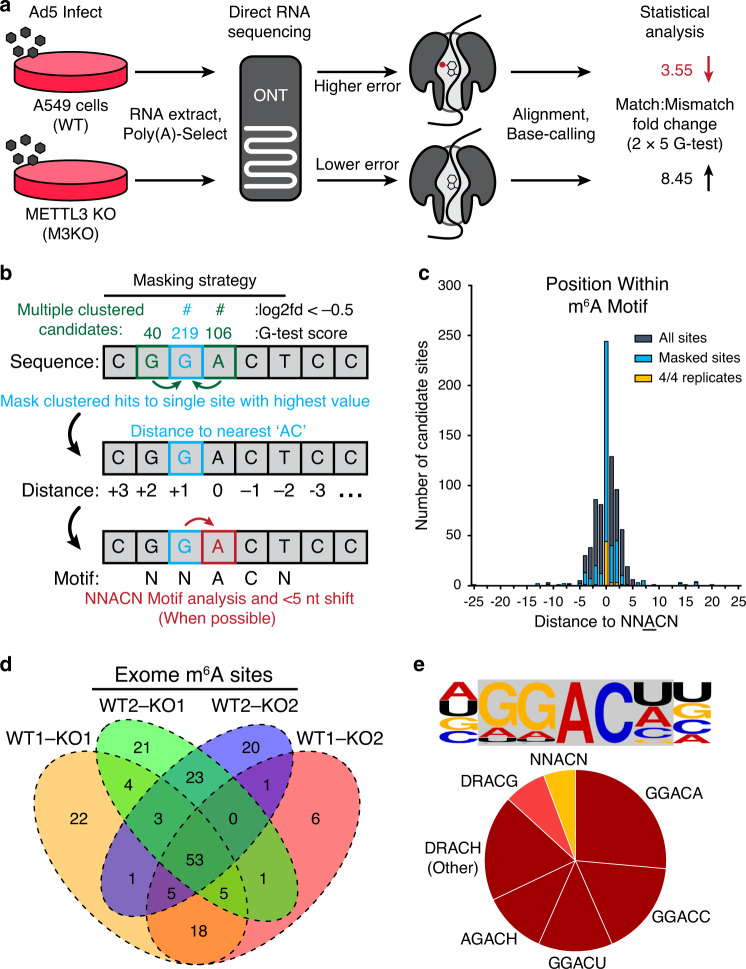
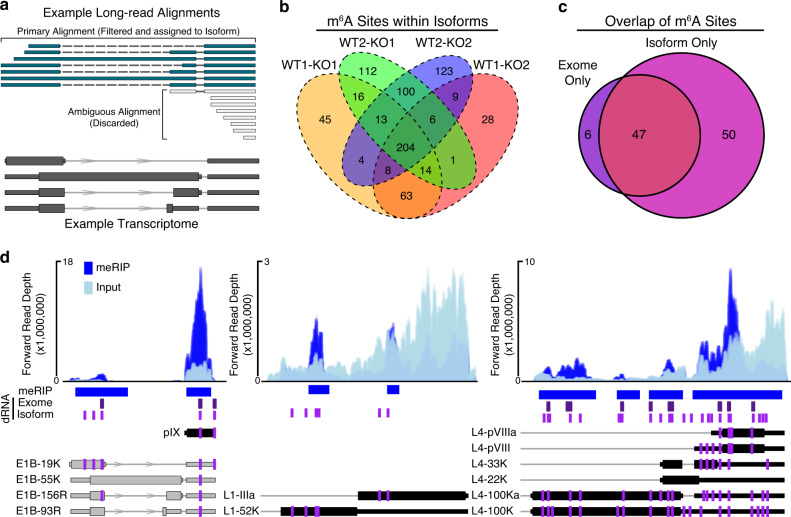
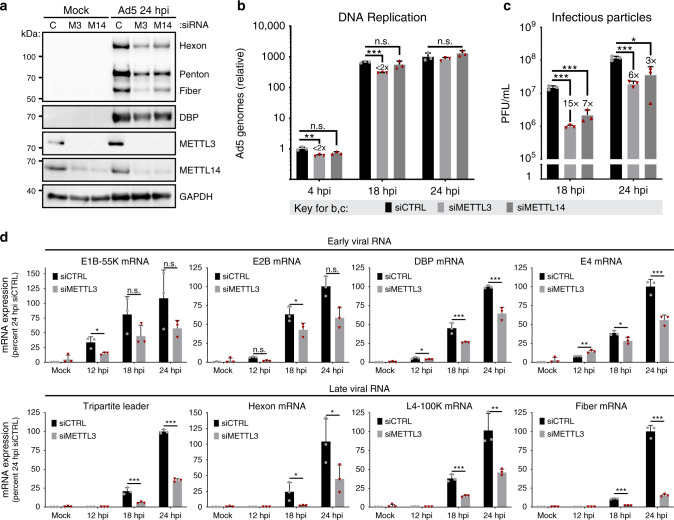
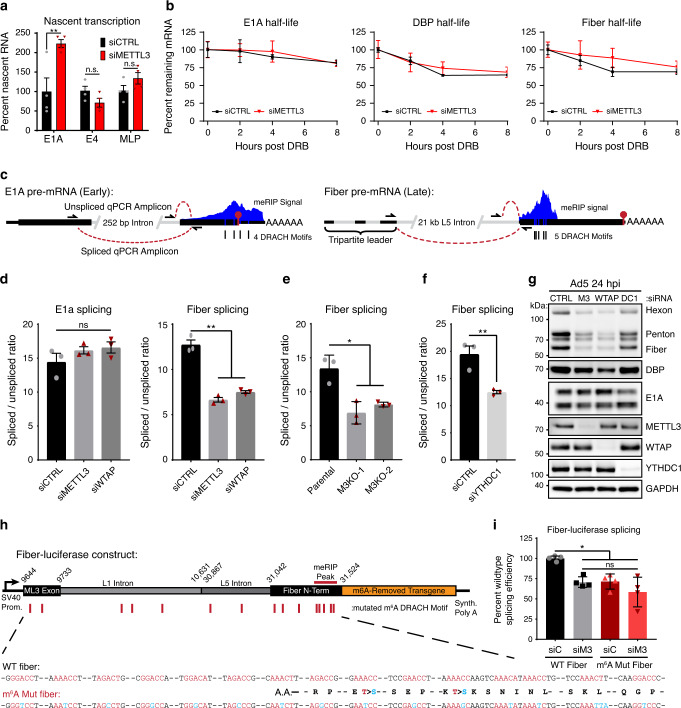
Adenovirus is a nuclear replicating DNA virus reliant on host RNA processing machinery. Processing and metabolism of cellular RNAs can be regulated by METTL3, which catalyzes the addition of N6-methyladenosine (m6A) to mRNAs. While m6A-modified adenoviral RNAs have been previously detected, the location and function of this mark within the infectious cycle is unknown. Since the complex adenovirus transcriptome includes overlapping spliced units that would impede accurate m6A mapping using short-read sequencing, here we profile m6A within the adenovirus transcriptome using a combination of meRIP-seq and direct RNA long-read sequencing to yield both nucleotide and transcript-resolved m6A detection. Although both early and late viral transcripts contain m6A, depletion of m6A writer METTL3 specifically impacts viral late transcripts by reducing their splicing efficiency. These data showcase a new technique for m6A discovery within individual transcripts at nucleotide resolution, and highlight the role of m6A in regulating splicing of a viral pathogen.


Conflict of interest statement

C.E.M. is a cofounder and board member for Biotia and Onegevity Health, as well as an advisor or compensated speaker for Abbvie, Acuamark Diagnostics, ArcBio, BioRad, DNA Genotek, Genialis, Genpro, Karius, Illumina, New England Biolabs, QIAGEN, Whole Biome, and Zymo Research. The remaining authors declare no competing interests.

Figures

Fig. 1
Fig. 1. Nuclear m6A-interacting factors concentrate at sites of nascent viral RNA synthesis.
a Abundance of cellular m6A proteins is unchanged during infection. Immunoblot showing abundance of m6A writers, readers, and putative erasers over a time-course of adenovirus infection. Viral early (E1A and DBP) and late (Hexon, Penton, and Fiber) proteins demonstrate representative kinetic classes. β-Actin is the loading control. Kilodalton size markers shown on the left. b Confocal microscopy of m6A-interacting proteins (green) in mock-infected or Ad5-infected A549 cells 18 h post-infection (hpi). DBP (magenta) is the viral DNA binding protein that marks sites of nuclear viral replication centers. The nuclear periphery is shown by a dotted white line as assessed by DAPI staining. Scale bar = 10 µm. c Confocal microscopy showing the pattern of actively transcribing RNA Polymerase II phosphorylated on serine 2 of CTD (Pol II p-Ser2, green) in mock-infected cells or relative to DBP (magenta) in infected cells. Scale bar = 10 µm. All data are representative of at least three independent experiments.
Fig. 2
Fig. 2. Transcript-specific analysis reveals adenovirus RNAs contain METTL3-dependent m6A modifications.
a The viral transcriptome is schematized with forward facing transcripts above the genome and reverse transcripts below. Viral gene kinetic classes are color-coded to denote early (gray) or late (black) genes. Lines with arrows denote introns, thin bars are untranslated exonic regions, and thick bars represent open reading frames. The names of each viral transcriptional unit are shown below the transcript cluster. meRIP-Seq was performed in triplicate on Ad5-infected A549 cells at 24 hpi. Representative meRIP data (blue/red) and total input RNA (light blue/yellow) sequence coverage is plotted against the adenovirus genome. Peaks containing increased meRIP-seq signal over input were called with MACS2 and denoted by blue boxes. Using direct RNA (dRNA) sequencing, full-length RNAs were sequenced from A549 parental cells or METTL3 knockout cells infected with adenovirus for 24 h. Specific m6A sites were predicted by comparing the nucleotide error rate of dRNA sequence data from WT to KO cells. Indicated in purple vertical lines are individual adenosines predicted to be modified by m6A that reach statistical significance when applied to all RNA that maps to a single nucleotide of the Ad genome (dRNA Exome). All Ad5-mapping transcripts were binned into unique full-length reads spanning entire transcript isoform and the same m6A prediction was applied on a transcript-by-transcript basis. Magenta vertical lines indicate predicted m6A residues found on the transcriptome level (dRNA Isoform). In addition, the position of m6A present in each viral transcript is highlighted in magenta directly on the transcript schemes. b HOMER reveals nucleotide motifs through analysis of MACS2 called peaks in cellular meRIP-seq data from Mock or Ad5-infected samples. Statistical significance was determined using hypergeometric enrichment calculations to find enriched motifs, and p-value was corrected for multiple testing. c Metagene analysis of m6A-peak distribution across cellular mRNA molecules containing 5’ and 3’ untranslated regions (UTR) and coding sequence (CDS) in Mock or Ad5-infected samples. d meRIP-qRT-PCR was performed on total RNA isolated from Ad5-infected control or METTL3 knockdown A549 cells 24 h post-infection. e Immunoblot showing knockdown efficiency of METTL3 in A549 cells. f Representative immunoblot showing two clones generated from Cas9-mediated knockout of METTL3 in A549 cells. For all assays, significance was determined by unpaired two-tailed Student’s T-test, **p ≤ 0.01, ***p ≤ 0.001, ns = not significant. Exact p-Values are included in the source data file. Sequencing experiments are representative of three biological replicates for Illumina data and two biological replicates analyzed in a four-way comparison for Nanopore data. Immunoblots in panels e and f were independently performed at least three times. Graphs represent mean +/− standard deviation.
Fig. 3
Fig. 3. A statistical framework for m6A detection using direct RNA sequencing.
a Schematic diagram of proposed strategy to detect m6A sites using direct RNA sequencing. RNAs generated in WT cells (METTL3 positive) will contain m6A modifications, while RNA from METTL3 KO cells (M3KO) will not. As modified RNA passes through the pore there will be a higher error rate during base-calling compared to unmodified RNA. When compared to the reference transcriptome, the aggregate fold change in the Match:Mismatch ratio will be lower in at nucleotides containing m6A. b Proposed strategy for masking neighboring candidates. Here, three sites within five nucleotides of an AC produce significant G-test scores. All candidates are collapsed to the single candidate within five nucleotides giving the highest G-test statistic. Collapsed/masked candidates are analyzed for their distance to nearest ‘AC’ dinucleotide. When nearest ‘AC’ dinucleotide is within the five-nucleotide window (dictated by nanopore size) the candidate is shifted to the closest ‘A’ within an ‘AC’ core, if possible. c For each significant candidate site with a one-fold or greater difference in the match:mismatch ratio, the distance to the nearest AC motif was calculated and plotted (gray). This was repeated after masking neighboring candidates (blue) and for the 53 genome-level sites identified across all four comparisons (gold). d Comparisons between WT and M3KO (KO) datasets yields 184 putative m6A modified bases (post-collapse) of which 53 are consistently detected across all four comparisons. e The consensus five-nucleotide motif for putative m6A modified bases in the Ad5 transcriptome is predominantly comprised of four common DRACH motifs.
Fig. 4
Fig. 4. Exome versus isoform-level m6A analysis.
a Example of read filtering. Overlapping RNA isoforms are shown in dark gray. Sequence reads that map unambiguously (teal) are filtered and retained for m6A analysis. Sequence reads with multiple primary alignments (gray) are discarded if no single alignment is considered superior. b Isoform-level comparisons between WT and M3KO datasets yields 747 candidates (post-collapse) of which 204 are consistently detected across all four comparisons. c Overlap of all m6A sites detected in 4/4 exome-mapped replicates and 4/4 isoform-mapped replicates. Isoform only candidates were collapsed to unique genomic loci. d Representative plots showing isoform-specific m6A predictions on adenovirus transcripts. MACS2 peaks and meRIP-seq signal (blue) is shown on top. Direct RNA (dRNA) predicted m6A sites at the exome-level (purple) or isoform-level (magenta) are shown below meRIP peaks as vertical lines. The positioning of m6A within individual viral transcripts from Fig. 2 are shown as magenta lines. Transcript names are shown to the left of each transcript.
Fig. 5
Fig. 5. Loss of METTL3 differentially impacts late viral gene expression.
a A549 cells were transfected with control siRNA (C), or siRNA targeting METTL3 (M3) or METTL14 (M14) for 48 h before Ad5 infection. Viral late proteins were analyzed at 24 hpi with polyclonal antibody against structural proteins (Hexon, Penton, and Fiber) or early protein DBP. b Viral DNA replication was measured in biological triplicate samples with qPCR at different times after infecting A549 cells depleted of METTL3 or METTL14 by siRNA. Fold-change in genome copy was normalized to the amount of input DNA at 4 hpi in control siRNA treated cells. c Infectious particle production was measured at different times by plaque assay after infecting A549 cells depleted of METTL3 or METTL14 by siRNA. d Viral RNA expression was measured by qRT-PCR in a time-course of infection after control or METTL3 knockdown for 48 h. Viral early transcripts are shown on the top, while late stage transcripts are shown on the bottom. For all assays significance was determined by unpaired two-tailed Student’s T-test, *p ≤ 0.05, **p ≤ 0.01, ***p ≤ 0.001, ns = not significant. Exact p-values are included in the source data file. Experiments are representative of three biological replicates and graphs represent mean +/− standard deviation.
Fig. 6
Fig. 6. Splicing efficiency of late viral RNA is mediated by m6A.
a Nascent transcription was analyzed by labeling RNA with 1 mM 4-thiouridine (4sU) for exactly 10 min at 24 hpi for infections of A549 cells transfected with control (siCTRL) or siRNA-mediated knockdown of METTL3 (siMETTL3). Nascent 4sU-labeled RNA was extracted for use in qRT-PCR for analysis of relative transcription rates of two viral early genes (E1A and E4) and the tripartite leader (MLP) found in all Ad5 late transcripts. Samples include four biological replicates. b Transcriptional shut-off was performed by adding 60 µM of the RNA Pol II elongation inhibitor DRB to the media of cells infected with Ad5 for 24 h, and stability of labeled spliced transcripts was measured by qRT-PCR for 2, 4, or 8 h post shut-off. Samples include three biological replicates. c Schematic of the early transcript E1A and the late transcript Fiber that both contain m6A sites. Three primers allow for the distinction between spliced and unspliced PCR products that can be analyzed by qRT-PCR. d Splice efficiency as defined by the relative ratio of spliced to unspliced transcripts of E1A and Fiber were analyzed by qRT-PCR in A549 cells infected with Ad5 for 24 h after depletion of METTL3 or WTAP. Data represents three biological experiments. e Fiber splice efficiency was analyzed in Parental A549 cells or two independent METTL3 KO cell lines. f Splice efficiency of Fiber was analyzed after siRNA-mediated depletion of the nuclear m6A reader YTHDC1. g Immunoblot showing viral late proteins Hexon, Penton, and Fiber, as well as viral early proteins DBP and E1A. A549 cells were depleted of METTL3 (M3), WTAP, YTHDC1 (DC1) or control siRNA (siC) for 48 h prior to infection with Ad5 for 24 h. Immunoblot representative of three independent experiments. h Schematic design for a luciferase construct that expresses the third adenovirus tripartite leader to Fiber splice site with intervening L1 and L5 adenoviral intron. The 5’ fragment of Fiber that contains the m6A signal peak was fused in-frame to a Renilla luciferase transgene where all m6A DRACH motifs have been ablated by silent mutation. A matching construct was generated with all 15 potential m6A DRACH motifs ablated by silent or synonymous mutation (m6A Mut Fiber). i HeLa cells were control transfected (siC) or depleted of METTL3 (siM3) by siRNA for 48 h before transfection with either WT Fiber or m6A Mut Fiber plasmid. At 24 h after the second transfection, splicing efficiency of the transgene was assayed using Fiber-specific primers. Data represent four biological replicates. For all assays significance was determined by unpaired two-tailed Student’s T-test, *p ≤ 0.05, **p ≤ 0.01, ns=not significant. Exact p-Values are included in the source data file. Graphs represent mean +/− standard deviation.
Fig. 7
Fig. 7. METTL3 knockdown globally dysregulates adenoviral late RNA processing.
a Schematic showing how junction-containing splice reads generated by Illumina sequencing can be used to predict specific transcript abundances when genes overlap. Short reads (dark blue) aligning specifically to viral exons (black) were filtered for the presence of a splice junction (dashed light blue line) that was only present in one viral transcript. b Splice junction containing reads indicative of adenovirus transcripts present in Illumina RNA-Seq data generated after infection of A549 cells where METTL3 was depleted by siRNA. Splice junction read depth was normalized to the total amount of reads mapping to both human and viral RNA per library. Early viral transcripts are shown on the left, MLP-derived late transcripts shown on the right. Fold-change (FC) between control siRNA and siMETTL3 for each transcript was plotted as a heatmap below the bar chart. Data depict three biological replicates with error bars showing standard deviation. For all assays significance was determined by unpaired two-tailed Student’s T-test, where *p ≤ 0.05 and ns = not significant. Graphs represent means +/− standard deviation. c Independently derived RNA was sequenced by ONT after METTL3 knockdown and adenovirus infection to yield full-length RNA sequences indicative of the labeled early and late viral transcripts. Fold-change (FC) between control siRNA and siMETTL3 for each transcript was plotted as a heatmap below the bar chart. d Individual viral transcripts are plotted as a function of log2 fold change of the siMETTL3/siCTRL data from Fig. 7c and the number of isoform-level m6A sites detected in Fig. 2a. Canonical early genes are coded with black squares and canonical late genes coded with red triangles, however the entire dataset was analyzed by Spearman’s correlation test to yield a correlation rho (ρ) value and significance p-value. e Analysis performed as in d, but with log2 fold change and the total number of splice sites contained within each viral transcript. f Analysis performed as in d, but with log2 fold change and the length (in nucleotides) of the longest intron contained within each viral transcript. For panels df the black line represents the calculated best-fit linear regression, and the shaded gray area represents 95% confidence interval. Exact p-values are included in the source data file.

References

    1. Arnold J. Berk Adenoviridae. In Fields Virology (eds. David M. Knipe & Peter M. Howley) Vol. 2, 1704–1731 (Wolters Kluwer Health/Lippincott Williams & Wilkins, 2013).
    1. Sommer S, et al. The methylation of adenovirus-specific nuclear and cytoplasmic RNA. Nucleic Acids Res. 1976;3:749–765. doi: 10.1093/nar/3.3.749. - DOI - PMC - PubMed
    1. Chen-Kiang S, Nevins JR, Darnell JE. N-6-methyl-adenosine in adenovirus type 2 nuclear RNA is conserved in the formation of messenger RNA. J. Mol. Biol. 1979;135:733–752. doi: 10.1016/0022-2836(79)90174-8. - DOI - PubMed
    1. Zhao BS, Roundtree IA, He C. Post-transcriptional gene regulation by mRNA modifications. Nat. Rev. Mol. Cell Biol. 2017;18:31–42. doi: 10.1038/nrm.2016.132. - DOI - PMC - PubMed
    1. Williams GD, Gokhale NS, Horner SM. Regulation of viral infection by the RNA modification N6-methyladenosine. Annu. Rev. Virol. 2019;6:235–253. doi: 10.1146/annurev-virology-092818-015559. - DOI - PMC - PubMed

Publication types

MeSH terms