. 2020 Nov 26;11(1):6017.
doi: 10.1038/s41467-020-19795-6.

Seven centuries of reconstructed Brahmaputra River discharge demonstrate underestimated high discharge and flood hazard frequency

Affiliations

Seven centuries of reconstructed Brahmaputra River discharge demonstrate underestimated high discharge and flood hazard frequency

Mukund P Rao et al. Nat Commun. .

Abstract

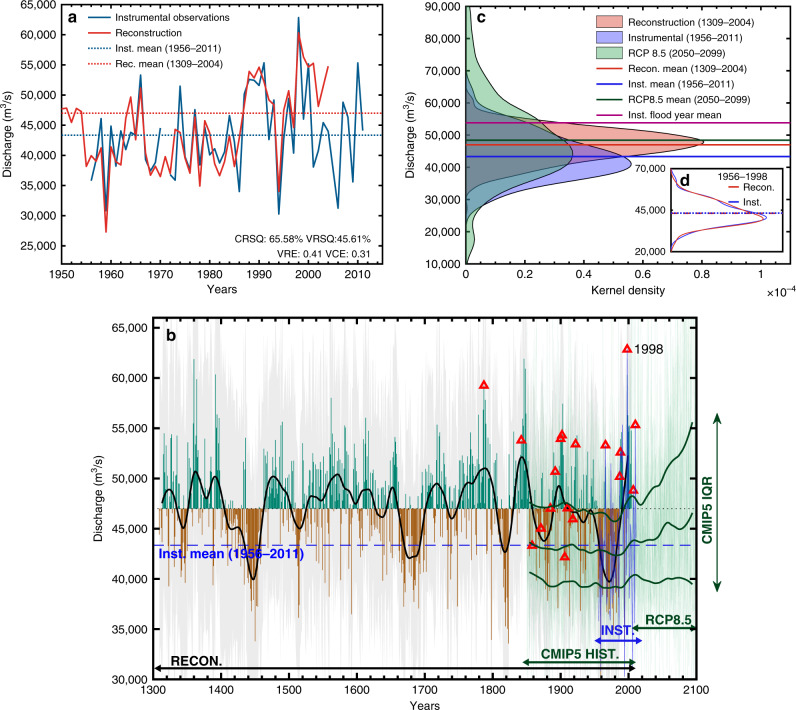
The lower Brahmaputra River in Bangladesh and Northeast India often floods during the monsoon season, with catastrophic consequences for people throughout the region. While most climate models predict an intensified monsoon and increase in flood risk with warming, robust baseline estimates of natural climate variability in the basin are limited by the short observational record. Here we use a new seven-century (1309-2004 C.E) tree-ring reconstruction of monsoon season Brahmaputra discharge to demonstrate that the early instrumental period (1956-1986 C.E.) ranks amongst the driest of the past seven centuries (13th percentile). Further, flood hazard inferred from the recurrence frequency of high discharge years is severely underestimated by 24-38% in the instrumental record compared to previous centuries and climate model projections. A focus on only recent observations will therefore be insufficient to accurately characterise flood hazard risk in the region, both in the context of natural variability and climate change.


Conflict of interest statement

The authors declare no competing interests.

Figures

Fig. 1
Fig. 1. Climate-streamflow-tree-growth relationships in the Brahmaputra watershed (red dashed lines).
The figures also highlight the larger Ganga–Brahmaputra–Meghna watershed (black dashed line), and the locations of the 28 tree-ring predictors (diamonds) used in the mean July–August–September (JAS) streamflow reconstruction at the Bahadurabad gauge, Bangladesh (red star). a Infill shading in diamond markers represent the Pearson correlation between mean JAS discharge at Bahadurabad and each tree ring predictor (1956–1998 C.E.). Background shading is the spatial field correlation between mean JAS discharge at Bahadurabad and mean JAS precipitation (1956–2011 C.E.) b Spatial field correlation between the first principal component (PC1) of the 28 tree ring predictors (variance explained: 24.86%) and mean JAS precipitation (1956–1998 C.E.). Spatial correlations in (a) and (b) are against CRU Ts 4.01 precipitation. Together, (a) and (b) show that monsoon season JAS flow in the Brahmaputra is positively related to upper basin precipitation in a region largely co-located with the tree ring predictor network. They also demonstrate that the predictor network effectively captures regional JAS precipitation independent to its correlation with JAS Brahmaputra discharge. Note that the locations of predictors are jittered for display. Only correlations significant at p < 0.05 using a 2-tailed t-test are shown. See Supplementary Table 1 for more information on the predictor network and Supplementary Fig. 2 for similar analyses with GPCC precipitation.
Fig. 2
Fig. 2. Discharge characteristics of the Brahmaputra at Bahadurabad, Bangladesh between 1956 and 2011 C.E.
a Annual 10-day mean discharge hydrograph. The brown and green envelopes represent the 5th, 50th, and 95th percentiles of 10-day mean discharge, respectively. The 5 grey and 1 red line represent 10-day mean discharge during instrumental period flood years in 1966, 1987, 1988, 1998 (in red), 2007, and 2010 C.E. b Scatter plot of mean JAS discharge against maximum 10-day mean daily discharge. The six flood years are highlighted in red. The vertical dashed line highlights mean JAS discharge in 2007 (48,800 m3/s), the lowest discharge of the 6 instrumental period documented flood years. The bootstrapped Pearson and Spearman rank correlations are calculated as the median and 5th and 95th percentile of 1000 draws with replacement. The grey uncertainty envelope (±2σ) is derived from the best-fit linear regression (blue line).
Fig. 3
Fig. 3. Instrumental observations, the reconstruction, and CMIP5 projections of mean JAS discharge at Bahadurabad.
a JAS instrumental discharge and its mean (43,350 m3/s) compared against reconstructed JAS discharge and its long-term mean (46,993 ± 812 m3/s). b Reconstructed discharge for each year between 1309 and 2004 C.E. as a departure from the reconstructed mean (as green and brown bars), along with the 50-year low-pass filtered reconstruction (solid black) highlighting multi-decadal variability. The instrumental JAS discharge and its mean between 1956 and 2011 C.E. is shown in the blue and dashed blue lines, respectively. Red triangles mark 18 documented flood years between 1787 and 2010 C.E. The 3 dark green lines represent the 50-year low-pass filtered interquartile range (IQR—25th, 50th, and 75th percentiles) of the multi-model CMIP5 RCP8.5 ensemble (20 models; 42 runs; Supplementary Table 2) along with the full range of variability (light green lines) during both the ‘historical’ (1850–2005 C.E.) and ‘future’ (2006–2099 C.E.) simulation period of these runs. c Kernel density profiles of the median reconstruction (in red), instrumental period (in blue), the full 42 member CMIP5 RCP8.5 end of the century simulation period (2050–2099 C.E.) ensemble suite (in green) and their respective means. The observed mean discharge of the 6 instrumental period flood years from Fig. 2 are shown in purple. The inset figure d shows the kernel density profiles of mean JAS instrumental discharge (in red) and reconstructed mean JAS discharge (in blue) over the calibration-validation period (1956–1998 C.E.) along with their means. The reconstruction matches the features of instrumental discharge such at its mean and variance in this period.
Fig. 4
Fig. 4. Discharge characteristics of wet and dry periods and flood years.
a Superposed epoch analysis (SEA) showing higher than normal flows in historical and instrumental period flood years (in year t+0) between 1780 and 2004 C.E. than would be expected by chance. The response is the 5th, 50th, and 95th percentiles of mean flow across 1000 unique draws of 10 flood years at random out of 16. The horizontal dotted lines indicate the threshold required for epochal anomalies to be statistically significant using random bootstrapping at three different statistical thresholds. These thresholds were calculated by compositing 10,000 draws of 10 years at random (or ‘pseudo-flood years’) from the reconstruction between 1780 and 2004 C.E. b Recurrence intervals (in years) of discharge greater than the 2007 C.E. flood year JAS discharge calculated from 1000 draws of 30 years with replacement form the instrumental data (1956–2011 C.E.), the reconstructions (over the instrumental period, 1956–2004 C.E.), and the full 42 ensemble member CMIP5 RCP8.5 simulation suite between 2050–2074 C.E. and 2075–2099 C.E. The median recurrence interval for each dataset is noted below each boxplot. The median recurrence interval for instrumental discharge between 1956–2004 C.E. and 1956–1998 C.E. remains 4.35 (Supplementary Fig. 11).

References

    1. Best J. Anthropogenic stresses on the world’s big rivers. Nat. Geosci. 2019;12:7–21. doi: 10.1038/s41561-018-0262-x. - DOI
    1. Smith T, Bookhagen B. Changes in seasonal snow water equivalent distribution in High Mountain Asia (1987 to 2009) Sci. Adv. 2018;4:e1701550. doi: 10.1126/sciadv.1701550. - DOI - PMC - PubMed
    1. Immerzeel WW, Pellicciotti F, Bierkens MFP. Rising river flows throughout the twenty-first century in two Himalayan glacierized watersheds. Nat. Geosci. 2013;6:742. doi: 10.1038/ngeo1896. - DOI
    1. Bookhagen, B. & Burbank, D. W. Toward a complete Himalayan hydrological budget: Spatiotemporal distribution of snowmelt and rainfall and their impact on river discharge. J. Geophys. Res. Earth Surface10.1029/2009jf001426 (2010).
    1. Pritchard HD. Asia’s shrinking glaciers protect large populations from drought stress. Nature. 2019;569:649–654. doi: 10.1038/s41586-019-1240-1. - DOI - PubMed

Publication types