. 2020 Nov 26;10(1):20723.
doi: 10.1038/s41598-020-77216-6.

Rethinking glottal midline detection

Affiliations

Rethinking glottal midline detection

Andreas M Kist et al. Sci Rep. .

Abstract

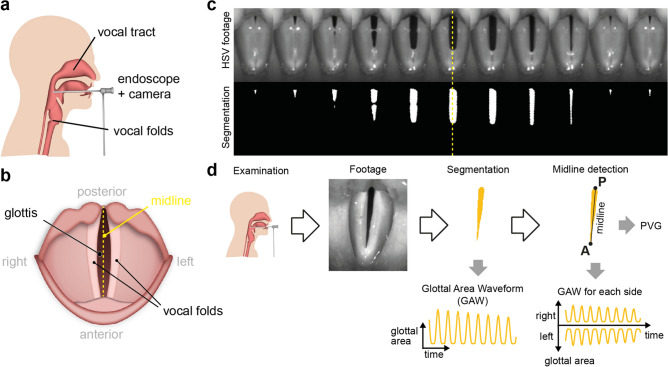
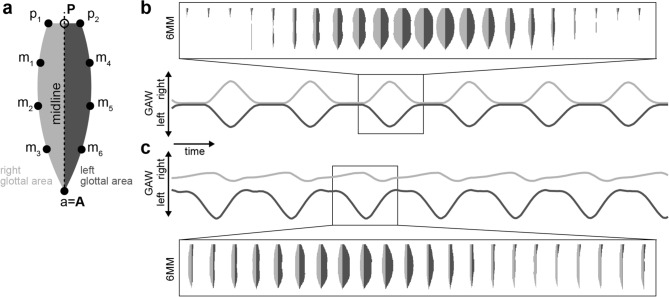
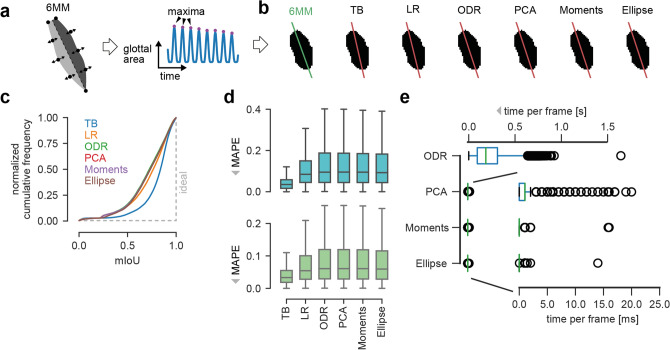
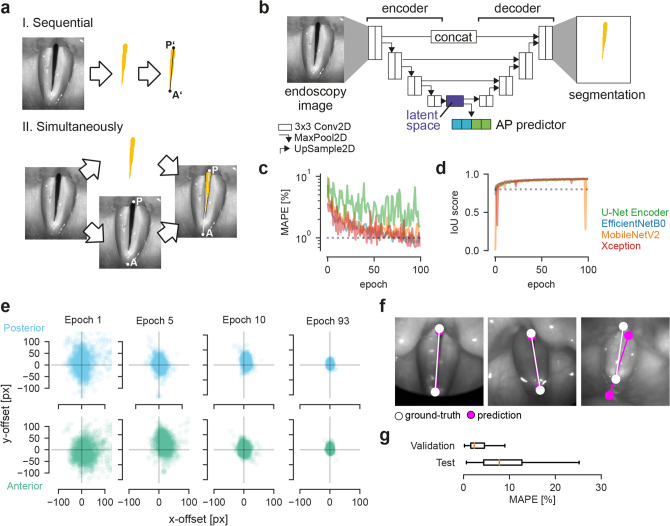
A healthy voice is crucial for verbal communication and hence in daily as well as professional life. The basis for a healthy voice are the sound producing vocal folds in the larynx. A hallmark of healthy vocal fold oscillation is the symmetric motion of the left and right vocal fold. Clinically, videoendoscopy is applied to assess the symmetry of the oscillation and evaluated subjectively. High-speed videoendoscopy, an emerging method that allows quantification of the vocal fold oscillation, is more commonly employed in research due to the amount of data and the complex, semi-automatic analysis. In this study, we provide a comprehensive evaluation of methods that detect fully automatically the glottal midline. We used a biophysical model to simulate different vocal fold oscillations, extended the openly available BAGLS dataset using manual annotations, utilized both, simulations and annotated endoscopic images, to train deep neural networks at different stages of the analysis workflow, and compared these to established computer vision algorithms. We found that classical computer vision perform well on detecting the glottal midline in glottis segmentation data, but are outperformed by deep neural networks on this task. We further suggest GlottisNet, a multi-task neural architecture featuring the simultaneous prediction of both, the opening between the vocal folds and the symmetry axis, leading to a huge step forward towards clinical applicability of quantitative, deep learning-assisted laryngeal endoscopy, by fully automating segmentation and midline detection.


Conflict of interest statement

The authors declare no competing interests.

Figures

Figure 1
Figure 1
The glottal midline is crucial to compute clinically relevant dynamic left-right symmetry parameters. (a) High-speed videoendoscopy (HSV) examination setup, (b) top view onto the vocal folds during HSV. (c) A single HSV oscillation cycle from a healthy individual together with its corresponding glottis segmentation mask. Note the symmetry to the yellow dashed midline. (d) State-of-the-art workflow to determine the glottal midline. HSV footage gained from examination is first segmented and converted to a glottal area waveform (GAW). On local maxima, the midline is predicted via the posterior (P) and anterior points (A). Using the midline, the GAW for each vocal fold and the phonovibrogram (PVG) can be computed.
Figure 2
Figure 2
The six mass model (6MM). (a) an example glottal area, split into left (dark gray) and right (light gray) using the glottal midline connecting posterior (P) and anterior (A) point. The six movable masses (m1–m6) are arranged left and right from the glottal midline. The posterior point can be divided into two fixed masses (p1 and p2) inducing a posterior gap, as seen in healthy female individuals (see also panel b), whereas the anterior point (a) is a fixed mass. (b) Symmetric oscillation of the left and right masses result in symmetric glottal area waveforms (GAWs) indicated in the same gray color as shown in panel (a). Glottal area model output is shown for an example cycle. (c) same arrangement as in (b), however, with an asymmetric oscillation pattern. Note the right vocal fold insufficiency leading to an always partially open glottis on the right side.
Figure 3
Figure 3
Performance of computer vision algorithms. (a) Evaluation procedure. GAWs are computed from 6MM simulations. Maxima were found and respective image frames were analyzed by computer vision algorithms. (b) Midline predictions of computer vision algorithms (red lines) compared to ground-truth (green) on exemplary 6MM data. (c) Cumulative mIoU scores across the synthetic dataset for all algorithms tested. The ideal curve is indicated as gray dashed line. (d) Distribution of the mean absolute percentage error (MAPE) for posterior (cyan) and anterior (green) point across the synthetic dataset for all algorithms tested. (e) Computation time of new algorithms tested. TB and LR required virtually no computation time.
Figure 4
Figure 4
Introducing time increases performance in most algorithms. (a) Maximum is detected in GAW. The respective frame together with a pre-defined range is summed over time. An example of summing multiple frames over different ranges are shown on the right. (b) Cumulative mIoU scores for algorithms tested when considering a total of 21 frames. (c) MAPE scores of algorithms for posterior (cyan) and anterior (green) points when considering 21 frames. (d) Median mIoU scores for different algorithms compared to the amount of frames summed around the detected maximum peak. Same color scheme as in (b).
Figure 5
Figure 5
Deep neural networks outperform classical computer vision methods. (a) Overview of prediction methods. Either a neural network architecture directly predicts anterior and posterior point coordinates from the maximum opened glottis (and a range of adjacent frames, optionally), or it uses a history-based approach together with ConvLSTM2D cells to predict continuously posterior and anterior point coordinates. (b) Distribution of median mIoU scores across different neural network architectures and seeds on the test set. (c) Average cumulative mIoU scores on the test set for selected neural architectures shown in (d). Shaded error indicates standard deviation. (d) Median mIoU scores for different neural architectures and varying temporal context. (e) Average cumulative mIoU scores of MidlineNet and its ConvLSTM2D-variant. Shaded error indicates standard deviation. (f) Colormap of median mIoU scores depending on sequence length and ConvLSTM2D filters. (g) Distribution of median mIoU scores of MidlineNet and its ConvLSTM2D-variant across different seeds. (h) Overview of neural network performance depending on size. Gray circles indicate baseline performance (single frame inference) and blue circles indicate temporal context by summing frames. Yellow circle indicates the MidlineNet ConvLSTM2D-variant.
Figure 6
Figure 6
GlottisNet is a multi-task architecture that predicts simultaneously both, glottal midline and area. (a) Comparison of sequential (upper panel) and simultaneous prediction (lower panel) of the glottal midline. Note the differences of posterior (P) and anterior (A) points. (b) General GlottisNet architecture consisting of an encoder-decoder network with an additional AP predictor. (c) Convergence of MAPE across training epochs for different encoding backbones. (d) Convergence of IoU score across training epochs for different encoding backbones. (e) X–Y accuracy of P and A point prediction. (f) Example images of endoscopic images with glottal midline ground-truth and prediction. (g) Distribution of MAPE scores across validation and test dataset for GlottisNet with EfficientNetB0 backbone.

References

    1. Titze, I. R. & Martin, D. W. Principles of voice production. J. Acoust. Soci. Am., 104(3), 1148, (1998). 10.1121/1.424266.
    1. Deliyski, D. D., Hillman, R. E. & Mehta, D. D. Laryngeal high-speed videoendoscopy: Rationale and recommendation for accurate and consistent terminology. J. Speech Lang. Hear. Res. JSLHR58(5), 1488–1492. 10.1044/2015_JSLHR-S-14-0253 (2015). - PMC - PubMed
    1. Mehta DD, Hillman RE. Current role of stroboscopy in laryngeal imaging. Curr. Opin. Otolaryngol. Head Neck Surg. 2012;20(6):429. doi: 10.1097/MOO.0b013e3283585f04. - DOI - PMC - PubMed
    1. Herbst CT, et al. Glottal opening and closing events investigated by electroglottography and super-high-speed video recordings. J. Exp. Biol. 2014;217(6):955–963. doi: 10.1242/jeb.093203. - DOI - PubMed
    1. Larsson H, Hertegård S, Lindestad P, Hammarberg B. Vocal fold vibrations: high-speed imaging, kymography, and acoustic analysis: a preliminary report. Laryngoscope. 2000;110(12):2117–2122. doi: 10.1097/00005537-200012000-00028. - DOI - PubMed

Publication types