. 2020 Nov 26;10(1):20669.
doi: 10.1038/s41598-020-77686-8.

Salt-responsive transcriptome analysis of triticale reveals candidate genes involved in the key metabolic pathway in response to salt stress

Affiliations

Salt-responsive transcriptome analysis of triticale reveals candidate genes involved in the key metabolic pathway in response to salt stress

Chaohong Deng et al. Sci Rep. .

Abstract

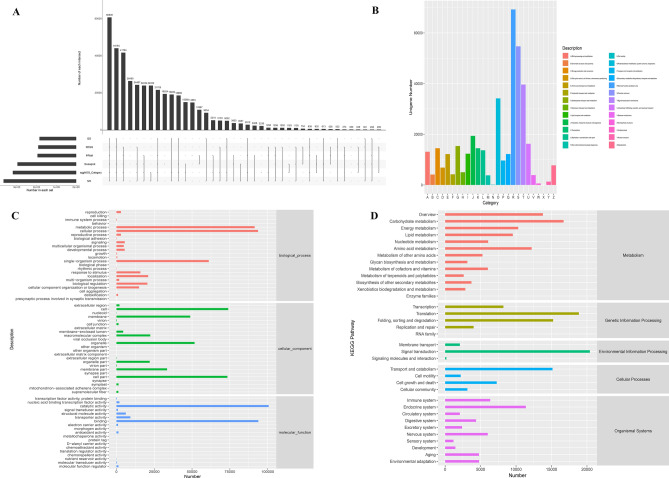
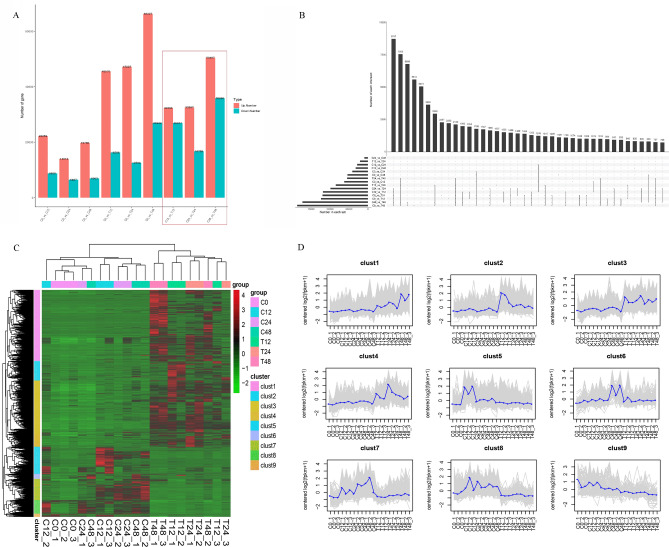
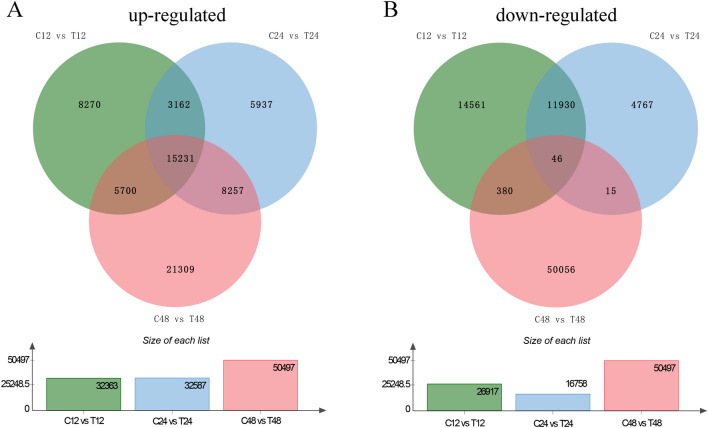
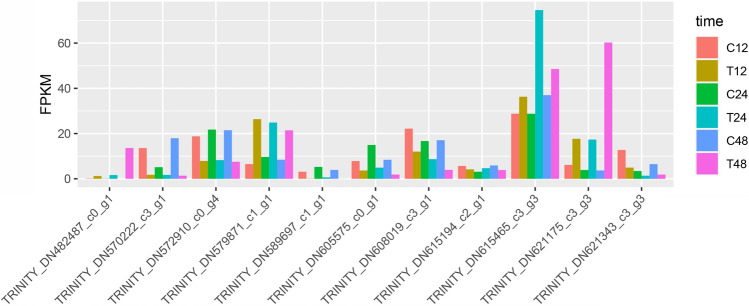
Triticale is tolerant of many environmental stresses, especially highly resistant to salt stress. However, the molecular regulatory mechanism of triticale seedlings under salt stress conditions is still unclear so far. In this study, a salt-responsive transcriptome analysis was conducted to identify candidate genes or transcription factors related to salt tolerance in triticale. The root of salt-tolerant triticale cultivars TW004 with salt-treated and non-salt stress at different time points were sampled and subjected to de novo transcriptome sequencing. Total 877,858 uniquely assembled transcripts were identified and most contigs were annotated in public databases including nr, GO, KEGG, eggNOG, Swiss-Prot and Pfam. 59,280, 49,345, and 85,922 differentially expressed uniquely assembled transcripts between salt treated and control triticale root samples at three different time points (C12_vs_T12, C24_vs_T24, and C48_vs_T48) were identified, respectively. Expression profile and functional enrichment analysis of DEGs found that some DEGs were significantly enriched in metabolic pathways related to salt tolerance, such as reduction-oxidation pathways, starch and sucrose metabolism. In addition, several transcription factor families that may be associated with salt tolerance were also identified, including AP2/ERF, NAC, bHLH, WRKY and MYB. Furthermore, 14 DEGs were selected to validate the transcriptome profiles via quantitative RT-PCR. In conclusion, these results provide a foundation for further researches on the regulatory mechanism of triticale seedlings adaptation to salt stress in the future.


Conflict of interest statement

The authors declare no competing interests.

Figures

Figure 1
Figure 1
Sequence annotation of all uniquely assembled transcripts generated via de novo assembly in triticale. (A) The Upset diagram of statistical results for all uniquely assembled transcripts annotated to databases nr, GO, KEGG, eggNOG, Swiss-Prot, and Pfam. (B) All contigs were assigned to database eggNOG and classified into 25 functional categories. (C) All contigs were assigned to GO categories and classified into 47 functional terms. (D) All contigs were assigned to database KEGG and classified into 33 functional categories.
Figure 2
Figure 2
All differentially expressed genes identified in this study. (A) Statistical results of all DEGs. (B) The numbers of unique and common DEGs among different comparison groups. These DEGs are divided into 9 clusters based on gene expression level and displayed with a heatmap (C) and expression tendency (D).
Figure 3
Figure 3
Differentially expressed genes at 12, 24, 48 h after salt stress in triticale. The Venn diagram shows the number of up-regulated DEGs (A) and down-regulated DEGs (B) after 12 (T_12h), 24 (T_24h), and 48 h (T_48h) of salt stress.
Figure 4
Figure 4
KEGG pathway enrichment analysis of DEGs after 12 (T_12h) (A), 24 (T_24h) (B), and 48 h (T_48h) (C) of salt stress, respectively. (D) Transcription factor family identified in triticale. (E) Verification of gene expression by real-time quantitative PCR. The black bars represent fold changes based on FPKM calculated from globally normalized RNA-seq data. The red bars with standard errors indicate fold changes based on the relative expression level determined by qPCR using the 2−ΔΔCT method for three biological replicates under saline and normal conditions.
Figure 5
Figure 5
The changes of expression levels of 11 transcription factors under salt stress.

Similar articles

Cited by

References

    1. Rhoades J, Loveday J. Salinity in irrigated agriculture. Agronomy. 1990;30:1089–1142.
    1. Zhu JK. Plant salt tolerance. Trends Plant Sci. 2001;6:66–71. doi: 10.1016/S1360-1385(00)01838-0. - DOI - PubMed
    1. Long XH, Liu LP, Shao TY, Shao HB, Liu ZP. Developing and sustainably utilize the coastal mudflat areas in China. Sci. Total Environ. 2016;570:1077–1086. doi: 10.1016/j.scitotenv.2016.06.170. - DOI - PubMed
    1. Flowers TJ, Colmer TD. Plant salt tolerance: adaptations in halophytes. Ann. Bot. 2015;115:327–331. doi: 10.1093/aob/mcu267. - DOI - PMC - PubMed
    1. Gu J, Xia Z, Luo Y, Jiang X, Qian B, Xie H, Zhu JK, Xiong L, Zhu J, Wang ZY. Spliceosomal protein U1A is involved in alternative splicing and salt stress tolerance in Arabidopsis thaliana. Nucleic Acids Res. 2018;46:1777–1792. doi: 10.1093/nar/gkx1229. - DOI - PMC - PubMed

Publication types

MeSH terms

Substances