. 2020 Nov 26;3(1):714.
doi: 10.1038/s42003-020-01443-w.

Enhancing calmodulin binding to cardiac ryanodine receptor completely inhibits pressure-overload induced hypertrophic signaling

Affiliations

Enhancing calmodulin binding to cardiac ryanodine receptor completely inhibits pressure-overload induced hypertrophic signaling

Michiaki Kohno et al. Commun Biol. .

Abstract

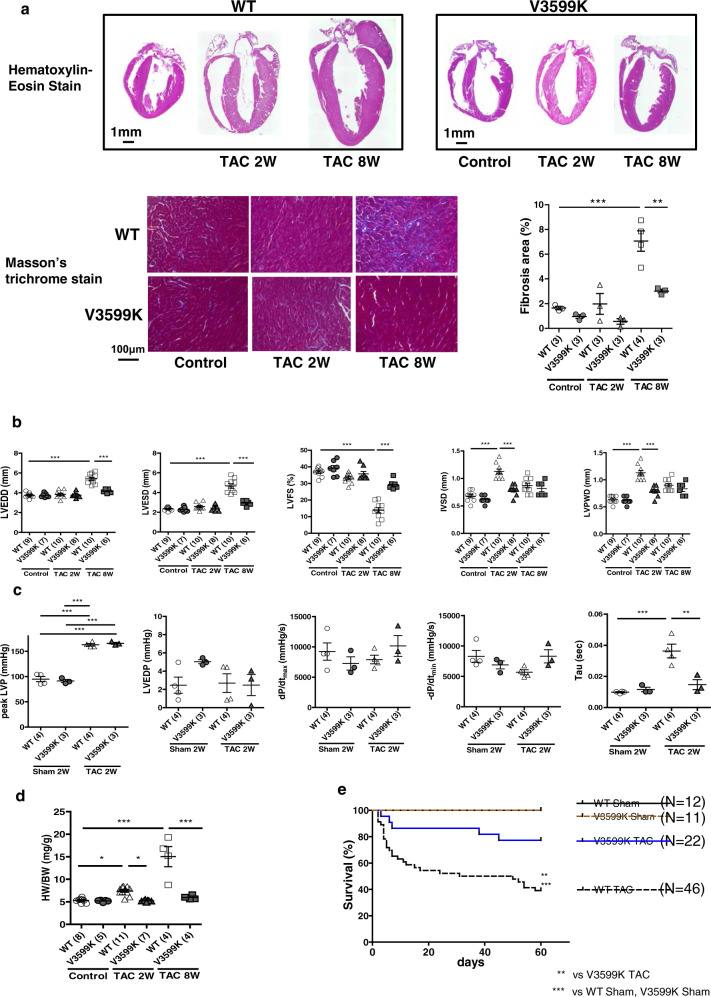
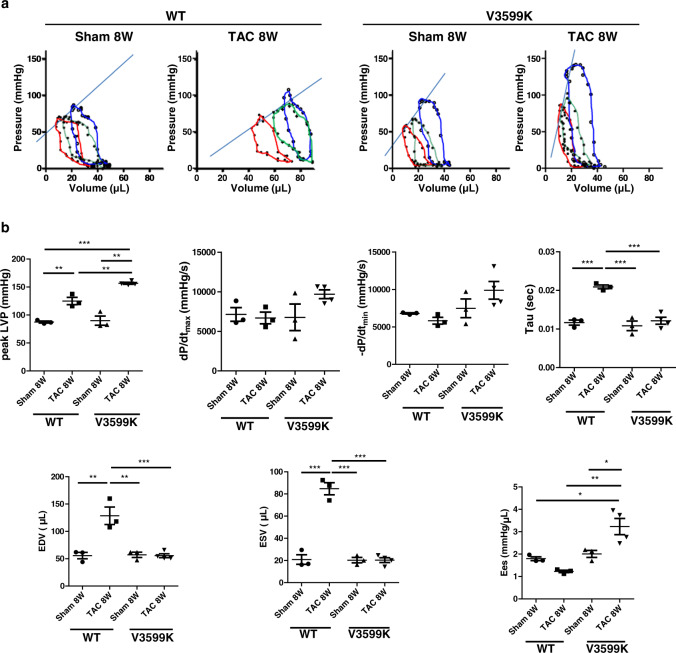
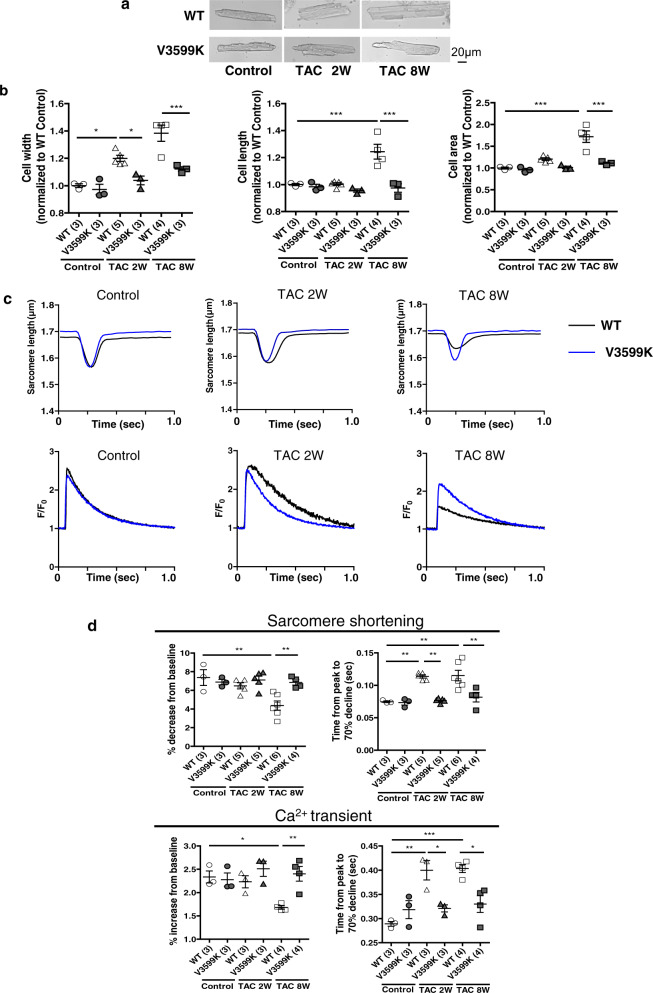
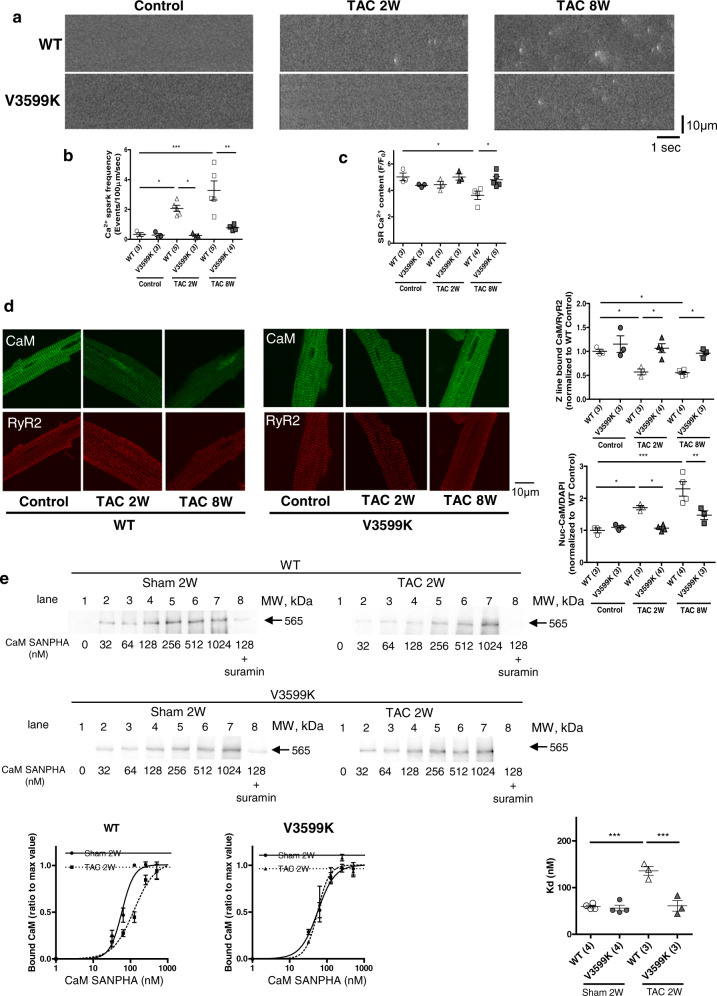
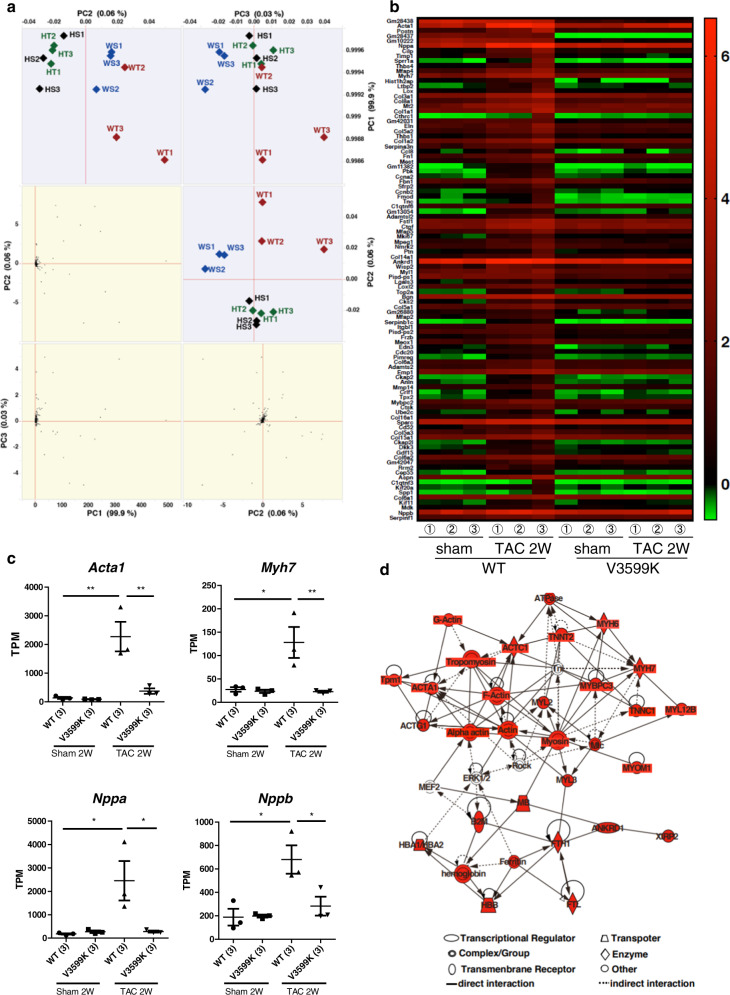
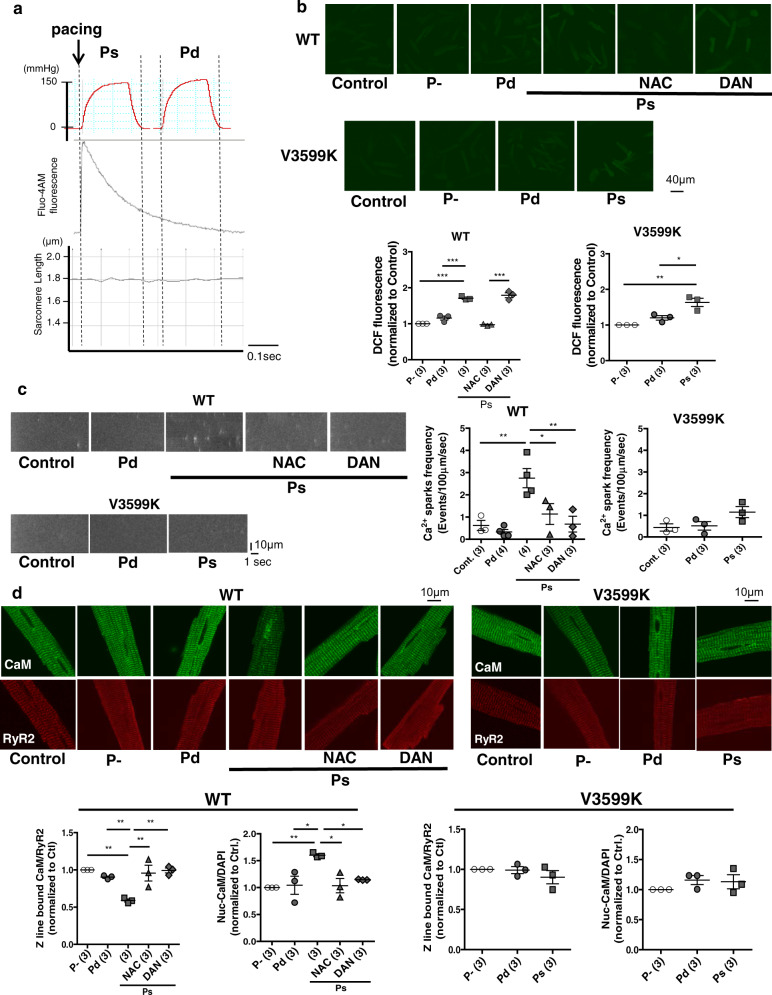
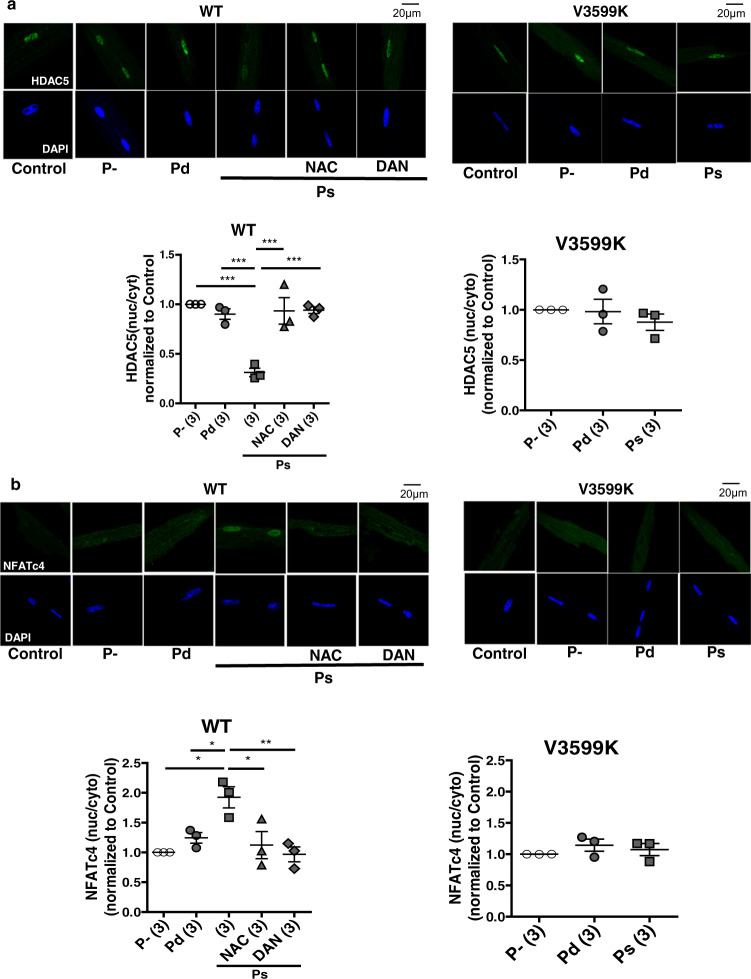
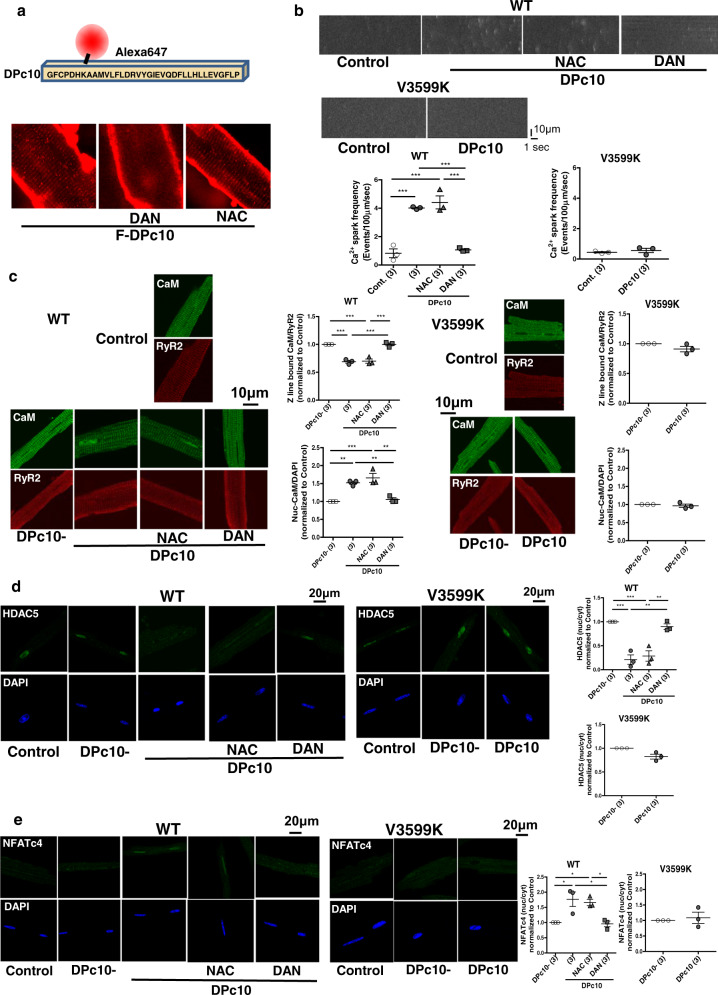
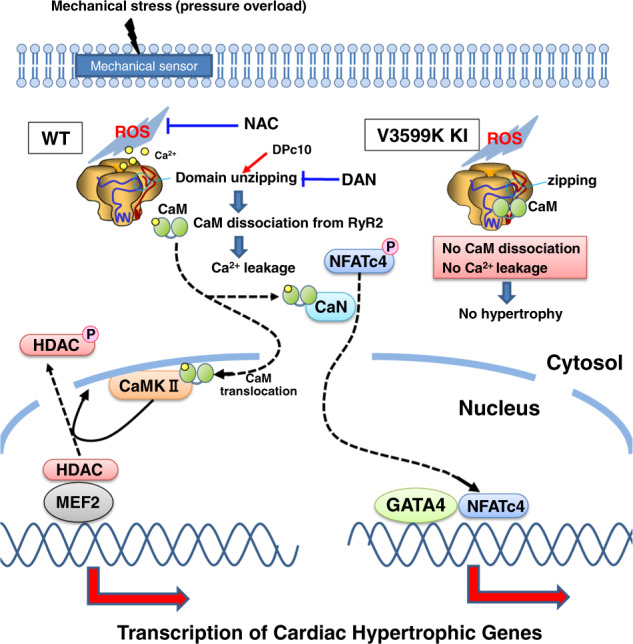
Cardiac hypertrophy is a well-known major risk factor for poor prognosis in patients with cardiovascular diseases. Dysregulation of intracellular Ca2+ is involved in the pathogenesis of cardiac hypertrophy. However, the precise mechanism underlying cardiac hypertrophy remains elusive. Here, we investigate whether pressure-overload induced hypertrophy can be induced by destabilization of cardiac ryanodine receptor (RyR2) through calmodulin (CaM) dissociation and subsequent Ca2+ leakage, and whether it can be genetically rescued by enhancing the binding affinity of CaM to RyR2. In the very initial phase of pressure-overload induced cardiac hypertrophy, when cardiac contractile function is preserved, reactive oxygen species (ROS)-mediated RyR2 destabilization already occurs in association with relaxation dysfunction. Further, stabilizing RyR2 by enhancing the binding affinity of CaM to RyR2 completely inhibits hypertrophic signaling and improves survival. Our study uncovers a critical missing link between RyR2 destabilization and cardiac hypertrophy.


Conflict of interest statement

The authors declare no competing interests.

Figures

Fig. 1
Fig. 1. Structural and functional characteristics, and prognosis after TAC in WT and V3599K mice.
a Representative images of long axis sections of the hearts, and hematoxylin and eosin or Masson’s trichrome stained LV tissue. b LV end-diastolic diameter (LVEDD), LV end-systolic diameter (LVESD), LV fractional shortening ((LVEDD − LVESD)/LVEDD × 100), intra-ventricular septum diastolic thickness (IVSD), left ventricular posterior wall diastolic thickness (LVPWD). c Peak LVP, LVEDP, dP/dt max of LVP, dP/dt min of LVP, Tau. d LV weight/body weight. e A Kaplan–Meier survival analysis. Values for individual mice are plotted together with mean ± SEM. Parentheses indicate the number of mice. *P < 0.05, **P < 0.01, ***P < 0.001 (one-way ANOVA with post-hoc Tukey’s multiple comparison test).
Fig. 2
Fig. 2. LV pressure (P) –volume (V) relationship after chronic pressure-overload.
a Representative P-V loops. b Hemodynamic parameters: Peak LVP, dP/dt max of LVP, dP/dt min of LVP, Tau. LV end-diastolic volume (LVEDV), LV end-systolic volume (LVESV), and Ees. *P < 0.05, **P < 0.01, ***P < 0.001 (one-way ANOVA with post-hoc Tukey’s multiple comparison test).
Fig. 3
Fig. 3. Morphology and Ca2+ transients in intact cardiomyocytes.
a Representative images of cardiomyocytes. b Summarized data of cell width, cell length, and cell area in isolated cardiomyocytes. N = 250–400 cells from 3–5 hearts. c Representative recordings of sarcomere shortening and fluo-4AM fluorescence signal, at a pacing rate of 1 Hz. d Summarized data of sarcomere shortening, peak Ca2+ transient, time from peak to 70% decline of Ca2+ transient, and sarcomere shortening. N = 22–31 cells from 3 to 6 hearts. Values for individual mice are plotted together with mean ± SEM. Parentheses indicate the number of mice. *P < 0.05, **P < 0.01, ***P < 0.001 (one-way ANOVA with post-hoc Tukey’s multiple comparison test).
Fig. 4
Fig. 4. Ca2+ sparks and CaM-RyR2 interaction in cardiomyocytes.
a Representative recordings of spontaneous Ca2+ sparks. b Summarized data of spontaneous Ca2+ spark frequency. N = 20–40 cells from 3 to 5 hearts. c Summarized data of SR Ca2+ content measured from caffeine-induced Ca2+ transient. N = 12–15 cells from 3 to 5 hearts. d Representative images of endogenous CaM co-localized with RyR2 and summarized data of the Z-line bound CaM and nuclear CaM. The immuno-fluorescence signal of the Z-line bound CaM was divided by that of RyR2, normalized to control (baseline of WT), and expressed as a ratio. The immuno-fluorescence signal of nuclear CaM was divided by that of DAPI for nuclear staining, normalized to control (baseline of WT), and expressed as a ratio. N = 20–38 cells from 3 to 4 hearts. e (Top) Representative immunoblots of RyR2-bound CaM-SANPAH (a photoreactive crosslinker; N-succinimidyl-6-[4′-azido-2′-nitrophenylamino]). CaM binding to RyR2 was determined with immunoblotting with anti-CaM to detect RyR2-bound CaM. (Bottom) Right: summarized data of CaM binding to RyR2 as a function of the concentration of CaM–SANPAH. CaM binding was expressed as the ratio to the maximum binding of CaM (at 1024 nM). (Left) Dissociation constants (Kd). Values for individual mice are plotted together with mean ± SEM. Parentheses indicate the number of mice. *P < 0.05, **P < 0.01, ***P < 0.001 (one-way ANOVA with post-hoc Tukey’s multiple comparison test).
Fig. 5
Fig. 5. Analysis of gene expression and network pathways after chronic pressure-overload of hearts in TAC model mice.
a Principal Component Analysis (PCA) showing gene expression in WT mice {without (WS: n = 3) or with TAC (WT: n = 3) } and V3599K mice {without (HS: n = 3) or with TAC (HT: n = 3)}. b The heat map shows the gene expression of the upper 100 genes of scores in factor loadings of PC3. c The bar graphs show the gene expression of hypertrophic markers genes, Acta1, Myh7, Nppa, or Nppb in the hearts of WS, WT, HS, and HT mouse models. d The network shows the signaling pathway detected in upper 100 genes in factor loadings of PC3. The red symbols mean the upper 100 genes. Values for individual mice are plotted together with mean ± SEM. Parentheses indicate the number of mice. *P < 0.05, **P < 0.01 (one-way ANOVA with post-hoc Tukey’s multiple comparison test).
Fig. 6
Fig. 6. Effect of acute pressure-overload on ROS, Ca2+ sparks, CaM-RyR2 interaction, and hypertrophic signaling in WT and V3599K cardiomyocytes.
a Timing of acute pressure overload by air compression (+150 mmHg) to cardiomyocytes. Top: Ca2+ transient; bottom: sarcomere shortening. b Representative images of DCFHDA fluorescence and the summarized data. N = 30–51 cells from 3 to 4 hearts. c Representative images of Ca2+ sparks and the summarized data. N = 19–28 cells from 3 to 4 hearts. d Representative images of endogenous CaM, co-localized with RyR2, and the summarized data of the Z-line bound CaM and nuclear CaM. The immuno-fluorescence signal of the Z-line bound CaM was divided by that of RyR2, normalized to control (baseline of WT), and expressed as a ratio. The immuno-fluorescence signal of the nuclear CaM was divided by that of DAPI for nuclear staining, normalized to control (baseline of WT), and expressed as a ratio. N = 23–39 cells from 3 hearts. Values for individual mice are plotted together with mean ± SEM. Parentheses indicate the number of mice. *P < 0.05, **P < 0.01, ***P < 0.001 (one-way ANOVA with post-hoc Tukey’s multiple comparison test).
Fig. 7
Fig. 7. Effect of acute pressure-overload by air compression (+150 mmHg) to cardiomyocytes on hypertrophic signaling.
a Translocations of HDAC. N = 42–60 cells from 3 hearts. b Translocations of NFAT. N = 47–58 cells from 3 hearts Values for individual mice are plotted together with mean ± SEM. Parentheses indicate the number of mice. *P < 0.05, **P < 0.01 (one-way ANOVA with post-hoc Tukey’s multiple comparison test).
Fig. 8
Fig. 8. Effect of DPc10 on Ca2+ sparks, CaM-RyR2 interaction, and hypertrophic signaling.
a Incorporation of fluorescently labeled DPc10 along the Z line in cardiomyocytes. b Ca2+ sparks. N = 18–31 cells from 3 hearts. c Fluorescence signal of RyR2-bound endogenous CaM. N = 19–25 cells from 3 hearts. d Translocation of HDAC. N = 38–50 cells from 3 hearts. e Translocation of NFAT. N = 36–53 cells from 3 hearts. Values for individual mice are plotted together with mean ± SEM. Parentheses indicate the number of mice. *P < 0.05, ***P < 0.001 (one-way ANOVA with post-hoc Tukey’s multiple comparison test).
Fig. 9
Fig. 9. Molecular mechanism of pressure-overload induced cardiac hypertrophy.
Pressure-overload first induces ROS production, which in turn induces CaM dissociation and Ca2+ leakage, thereby activating hypertrophic signaling mediated through the CaM-CaMKII and Ca2+-calcineurin pathway. V3599K mutation within CaM binding domain of RyR2 enhances CaM binding to RyR2, thereby inhibiting CaM dissociation and Ca2+ leakage despite ROS production due to pressure-overload, and thus hypertrophic signaling is not activated.

Similar articles

Cited by

References

    1. Grossman W, Jones D, McLaurin LP. Wall stress and patterns of hypertrophy in the human left ventricle. J. Clin. Invest. 1975;56:56–64. doi: 10.1172/JCI108079. - DOI - PMC - PubMed
    1. Hill JA, et al. Cardiac hypertrophy is not a required compensatory response to short-term pressure overload. Circulation. 2000;101:2863–9. doi: 10.1161/01.CIR.101.24.2863. - DOI - PubMed
    1. Esposito G, et al. Genetic alterations that inhibit in vivo pressure-overload hypertrophy prevent cardiac dysfunction despite increased wall stress. Circulation. 2002;105:85–92. doi: 10.1161/hc0102.101365. - DOI - PubMed
    1. Bers DM. Calcium cycling and signaling in cardiac myocytes. Annu. Rev. Physiol. 2008;70:23–49. doi: 10.1146/annurev.physiol.70.113006.100455. - DOI - PubMed
    1. Sedej S, et al. Subclinical abnormalities in sarcoplasmic reticulum Ca2+ release promote eccentric myocardial remodeling and pump failure death in response to pressure overload. J. Am. Coll. Cardiol. 2014;63:1569–79. doi: 10.1016/j.jacc.2013.11.010. - DOI - PubMed

Publication types