. 2020 Nov 26;10(1):20615.
doi: 10.1038/s41598-020-77699-3.

Activity-dependent interdomain dynamics of matrix metalloprotease-1 on fibrin

Affiliations

Activity-dependent interdomain dynamics of matrix metalloprotease-1 on fibrin

Lokender Kumar et al. Sci Rep. .

Abstract

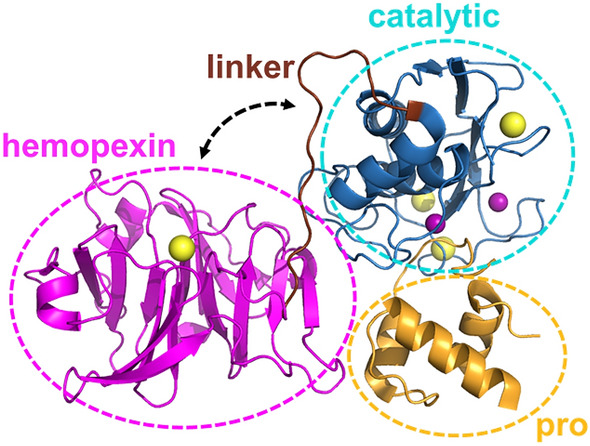
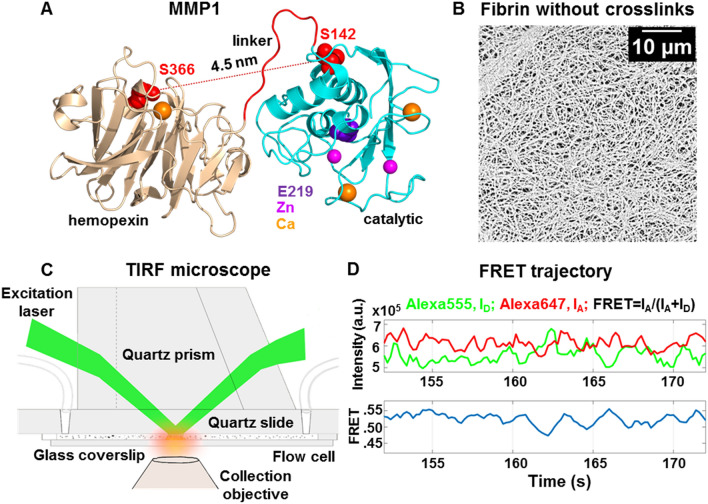
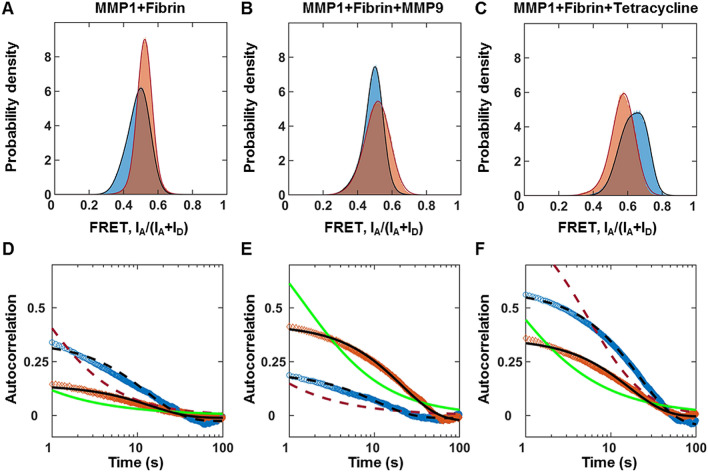
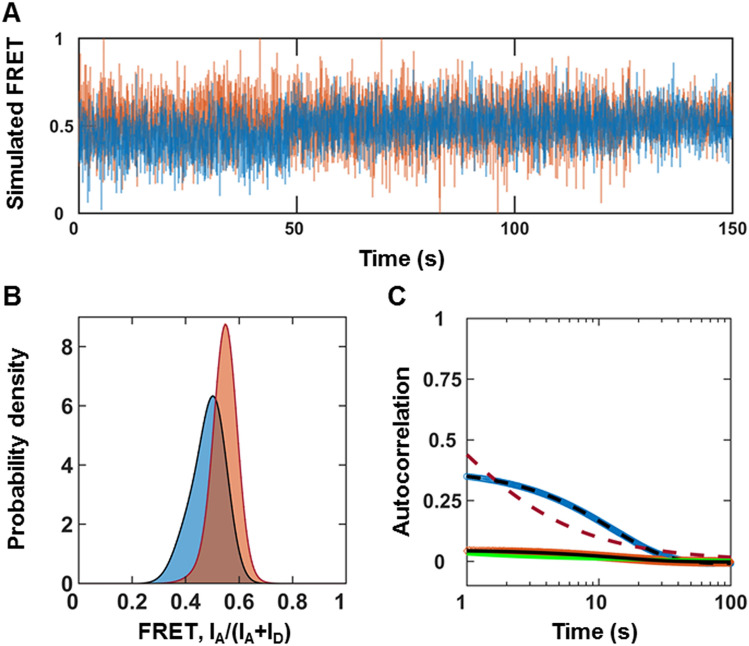
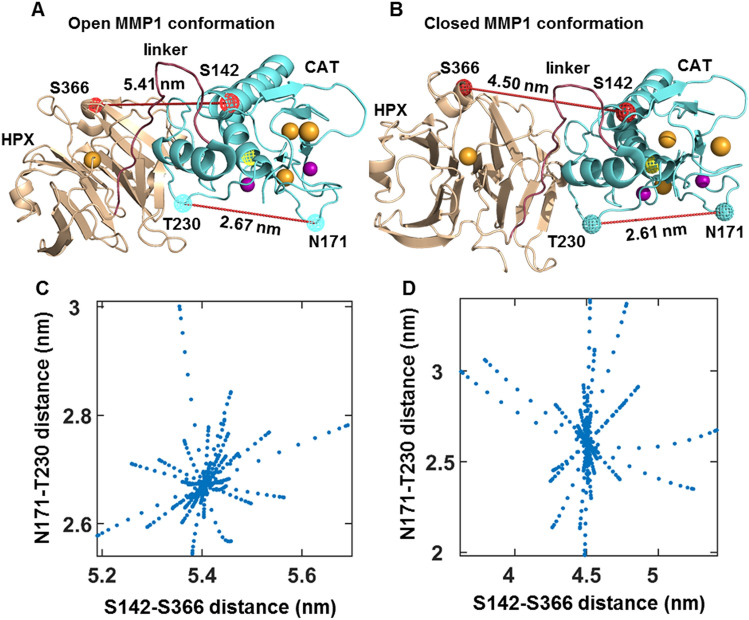
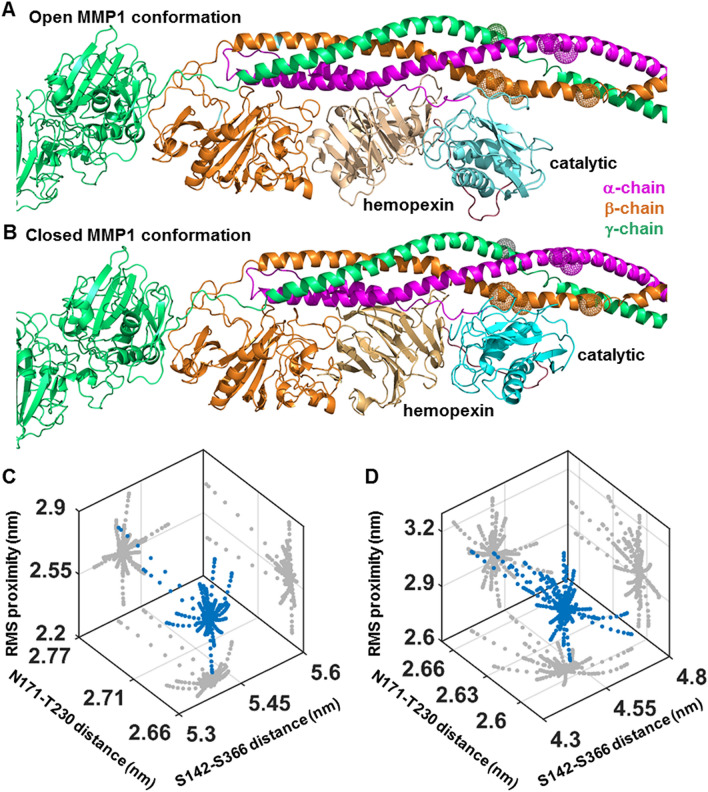
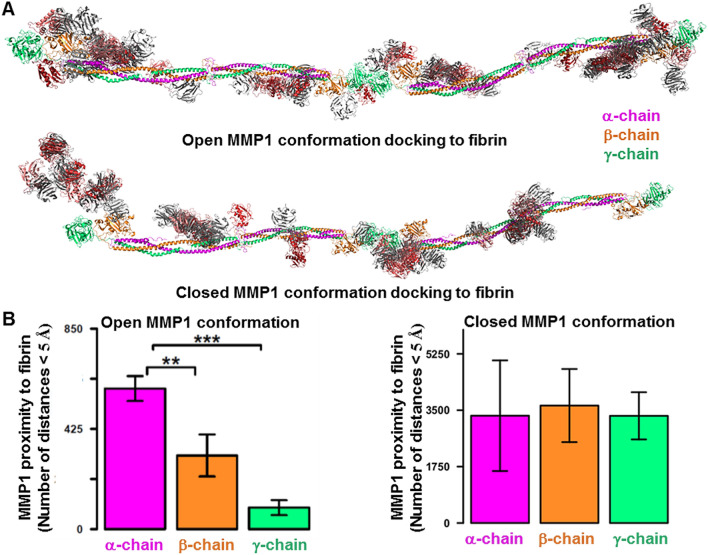
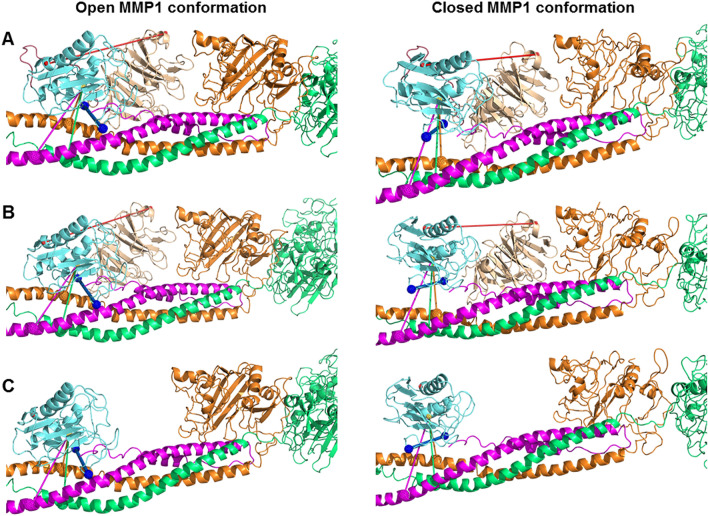
The roles of protein conformational dynamics and allostery in function are well-known. However, the roles that interdomain dynamics have in function are not entirely understood. We used matrix metalloprotease-1 (MMP1) as a model system to study the relationship between interdomain dynamics and activity because MMP1 has diverse substrates. Here we focus on fibrin, the primary component of a blood clot. Water-soluble fibrinogen, following cleavage by thrombin, self-polymerize to form water-insoluble fibrin. We studied the interdomain dynamics of MMP1 on fibrin without crosslinks using single-molecule Forster Resonance Energy Transfer (smFRET). We observed that the distance between the catalytic and hemopexin domains of MMP1 increases or decreases as the MMP1 activity increases or decreases, respectively. We modulated the activity using (1) an active site mutant (E219Q) of MMP1, (2) MMP9, another member of the MMP family that increases the activity of MMP1, and (3) tetracycline, an inhibitor of MMP1. We fitted the histograms of smFRET values to a sum of two Gaussians and the autocorrelations to an exponential and power law. We modeled the dynamics as a two-state Poisson process and calculated the kinetic rates from the histograms and autocorrelations. Activity-dependent interdomain dynamics may enable allosteric control of the MMP1 function.


Conflict of interest statement

The authors declare no competing interests.

Figures

Figure 1
Figure 1
MMP1 structure (PDB ID: ISU3). The hemopexin domain is connected to the catalytic domain by a flexible linker. The pro domain is cleaved off to activate MMPs for catalysis. Yellow and purple spheres represent the van der Waals radii of the calcium and zinc atoms, respectively. The pro domain, the catalytic domain, the linker, and the hemopexin domains are roughly defined by the ranges of residues D32-Q99, F100-Y260, G261-C278, and D279-C466, respectively.
Figure 2
Figure 2
Single-molecule measurement of MMP1 dynamics on fibrin without crosslinks. (A) Crystal structure of MMP1 (PDB ID: 1SU3). Mutations of S142 and S366 to cysteines enables attaching Alexa555 and Alexa647 dyes. (B) Scanning Electron Microscope (SEM) images of fibrin without crosslinks. (C) Schematics of the TIRF microscope used for measuring MMP1 interdomain dynamics on fibrin. (D) Emission intensities of the two dyes at 22 °C with a 100 ms time resolution. (top panel) Low FRET conformations lead to high Alexa555 emission, whereas High FRET conformations lead to Low Alexa555 emission. Anticorrelated Alexa647 and Alexa555 emissions, IA and ID, respectively; (bottom panel) Calculated smFRET trajectory to show MMP1 interdomain dynamics as a function of time.
Figure 3
Figure 3
Interdomain dynamics of MMP1 on fibrin correlates with activity. More than 300,000 smFRET values at 22 °C with a 100 ms time resolution for each condition are used to create area-normalized histograms of MMP1 interdomain distance (bin size = 0.005). (A) Histograms without ligand, (B) Histograms in the presence of MMP9 (an enhancer), and (C) Histograms in the presence of tetracycline (an inhibitor) for active (blue) and active site mutant (orange) MMP1. Histograms are fitted to a sum of two Gaussians (active: solid blue line; active site mutant: solid red line). Autocorrelations of MMP1 interdomain distance are calculated from the time series of smFRET values. (D) Autocorrelations without ligand, (E) Autocorrelations in the presence of MMP9, and (F) Autocorrelations in the presence of tetracycline for active MMP1 (blue) and active site mutant of MMP1 (orange). Autocorrelations are fitted to exponentials and power laws (exponential fit to active: dashed black line; power law fit to active: dashed red line; exponential fit to active site mutant: solid black line; power law fit to active site mutant: solid green line). The error bars in the histograms and autocorrelations represent the square roots of the bin counts and the standard errors of the mean (sem) and are too small to be seen. The supplementary information contains the fit equations and the best-fit parameters for histograms and autocorrelations (Table S1). We approximated smFRET efficiency by IA/( IA + ID) and has no unit.
Figure 4
Figure 4
MMP1 interdomain dynamics as a two-state system. (A) Examples of simulated smFRET trajectories with noise for active MMP1 (blue) and active site mutant of MMP1 (orange) using experimentally-determined parameters for MMP1 without tetracycline. (B) Area-normalized histograms of simulated smFRET values with best fits to a sum of two Gaussians (solid black line). (C) Autocorrelations of simulated smFRET trajectories with best fits to exponentials (active: dashed black line; active site mutant: solid black line). As expected, power law did not fit autocorrelations (active: dashed red line; active site mutant: solid green line). k1 + k2 was recovered from exponential fits with and without noise. The error bars are the standard errors of mean for histograms and autocorrelations and are too small to be seen.
Figure 5
Figure 5
Correlations of MMP1 interdomain distance with catalytic pocket opening when MMP1 is not bound to a substrate. Examples of (A) open and (B) closed conformations of MMP1. The interdomain distances between S142 and S366 and corresponding catalytic pocketing openings between N171 and T230 have been noted. Spheres and cages represent the van der Waals radii. Yellow cage: E219; Wheat sphere: calcium; Mauve sphere: zinc. (C,D) are scatter plots of interdomain distance and catalytic pocket opening for the open and closed conformations. Two distances are calculated using ANM simulations (see “Methods”).
Figure 6
Figure 6
Correlations of MMP1 interdomain distance with catalytic pocket opening when MMP1 is bound to the reconstructed fibrin model combining 3GHG and 1FZC. Examples of (A) open and (B) closed conformations of MMP1 bound to the reconstructed model of fibrin. Three dimensional scatter plots (blue circle) of interdomain distance (S142–S366), catalytic pocket opening (N171-T230), and rms proximity between the MMP1 catalytic site and the three fibrin chains for (C) open and (D) closed MMP1 conformations. Two-dimensional projections of the scatter plots are in gray. The open structure shows larger catalytic pocket openings.
Figure 7
Figure 7
Proximity of MMP1 to the chains of reconstructed fibrin model. (A) The clustered 30 docking poses obtained from ClusPro using fibrin as the ligand and MMP1 as the receptor. The catalytic domain of MMP1 is red, whereas the hemopexin domain is gray. (B) We measured the distance between all possible pairs of atoms between the fibrin chains and MMP1 for 30 docking poses obtained from ClusPro. We counted any distance less than 5 Å and plotted the total count distributions for each chain for the open and closed conformations. p-value < 0.05:*; p-value < 0.01:**; p-value < 0.001:***
Figure 8
Figure 8
Effects of the linker and reconstructed fibrin on the catalytic pocket opening. The catalytic pocket openings on fibrin represented by the blue line connecting N171 and T230 for (A) the full-length MMP1 (open conformation: 2.68 ± 0.01 nm; closed conformation: 2.61 ± 0.01 nm); (B) the two MMP1 domains without the linker (open conformation: 2.68 ± 0.01 nm; closed conformation: 2.61 ± 0.01 nm); and (C) the catalytic domain alone (open conformation: 2.68 ± 0.01 nm; closed conformation: 2.68 ± 0.01 nm). The error bars represent the standard deviation of 60 measurements of the catalytic pocket opening obtained from 20 frames each for the three slowest normal modes.

References

    1. Karplus M, Kuriyan J. Molecular dynamics and protein function. Proc. Natl. Acad. Sci. 2005;102:6679–6685. doi: 10.1073/pnas.0408930102. - DOI - PMC - PubMed
    1. Henzler-Wildman K, Kern D. Dynamic personalities of proteins. Nature. 2007;450:964–972. doi: 10.1038/nature06522. - DOI - PubMed
    1. Henzler-Wildman KA, et al. A hierarchy of timescales in protein dynamics is linked to enzyme catalysis. Nature. 2007;450:913–916. doi: 10.1038/nature06407. - DOI - PubMed
    1. Lewandowski JR, Halse ME, Blackledge M, Emsley L. Direct observation of hierarchical protein dynamics. Science. 2015;348:578–581. doi: 10.1126/science.aaa6111. - DOI - PubMed
    1. Bhaskara RM, de Brevern AG, Srinivasan N. Understanding the role of domain–domain linkers in the spatial orientation of domains in multi-domain proteins. J. Biomol. Struct. Dyn. 2013;31:1467–1480. doi: 10.1080/07391102.2012.743438. - DOI - PubMed

Publication types