Review
. 2021 Jul;129(7):352-371.
doi: 10.1111/apm.13098. Epub 2021 Mar 1.

Pandemics: past, present, future: That is like choosing between cholera and plague

Affiliations
Review

Pandemics: past, present, future: That is like choosing between cholera and plague

Niels Høiby. APMIS. 2021 Jul.

Abstract

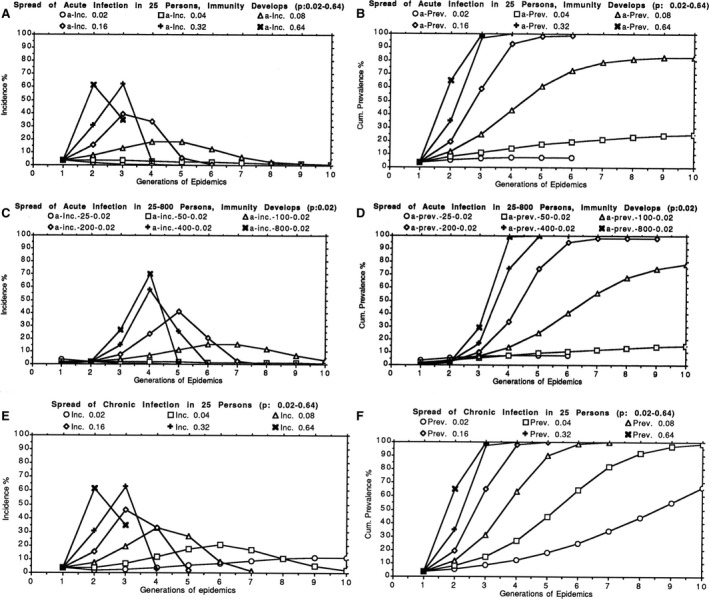
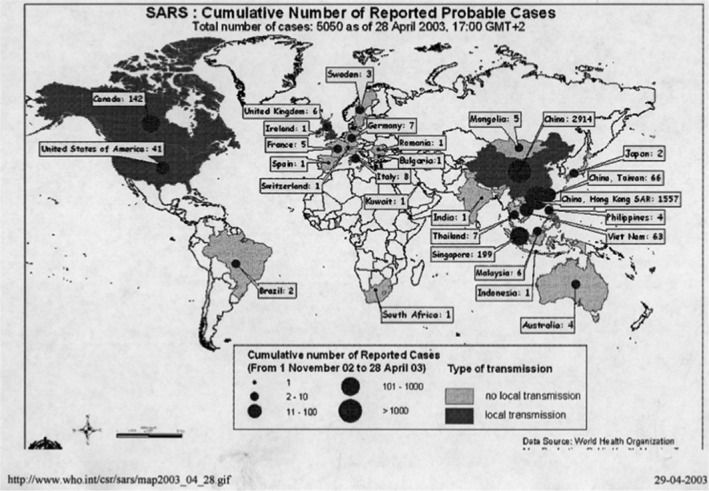
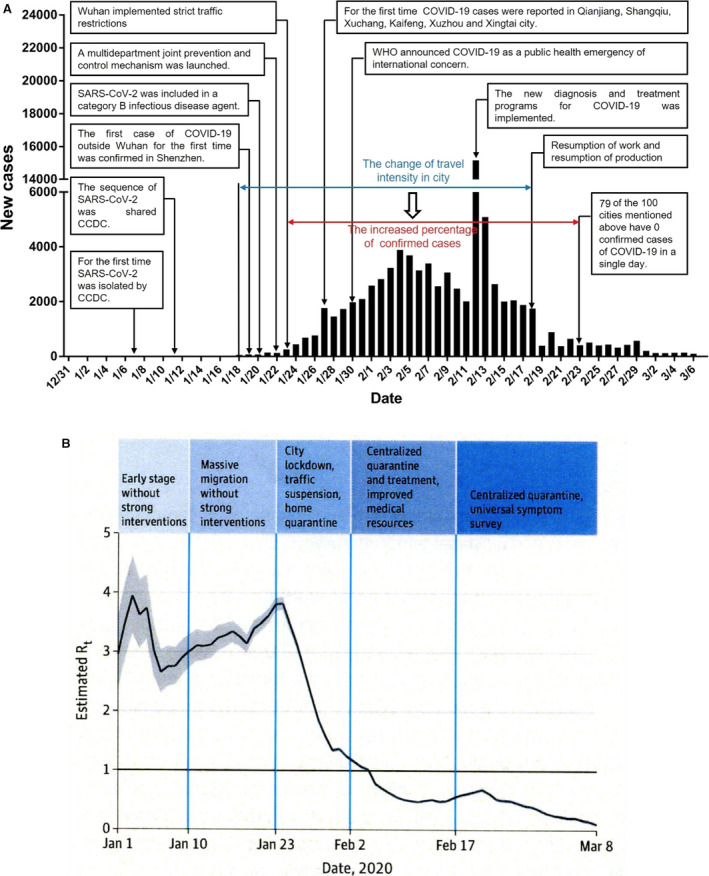
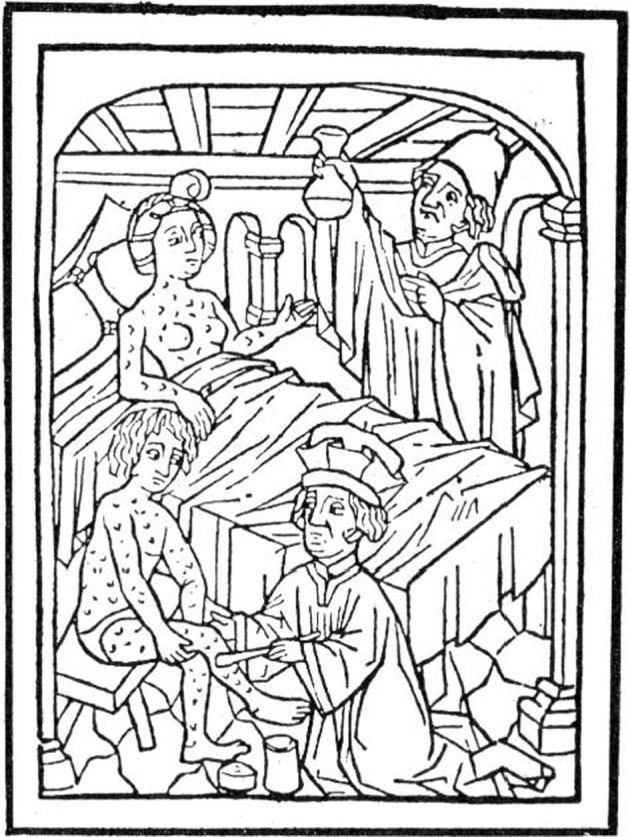
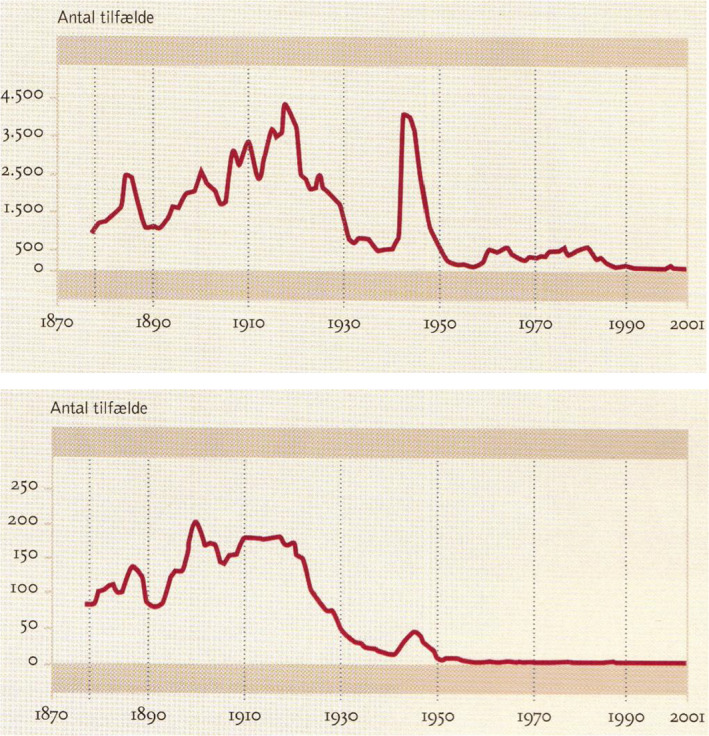
The major epidemic and pandemic diseases that have bothered humans since the Neolithic Age and Bronze Age are surveyed. Many of these pandemics are zoonotic infections, and the mathematical modeling of such infections is illustrated. Plague, cholera, syphilis, influenza, SARS, MERS, COVID-19, and new potential epidemic and pandemic infections and their consequences are described and the background for the spread of acute and chronic infections and the transition to endemic infections is discussed. The way we can prevent and fight pandemics is illustrated from the old and new well-known pandemics. Surprisingly, the political reactions through different periods have not changed much during the centuries.

Keywords: COVID-19; MERS; Pandemics; SARS; cholera; epidemics; influenza; plague.


Figures

Fig. 1
Fig. 1
(A and B) Calculated epidemic curves starting with one person being infected in a population of 25 susceptible individuals, assuming effective contact rates (p) for transmission of the infection of 0.02, 0.04, 0.08, 0.16, 0.32, or 0.64 and development of immunity so that the infection is cleared. The abscissas show the generation of the epidemic, for example, 1st generation: one patient infected who subsequently infects 2 new individuals in the 2nd generation of the epidemic, etc. (reproduction number R0 = 2, the epidemic develops faster if R0 increases, but decreases if R0 is below 1). (A) ordinate: incidence (%) of new infected patients. (B) ordinate: accumulated prevalence (%) of infected and recovered (immunity develops) patients. The higher the contact rate, the faster the epidemic develops and terminates due to immunity. The lowest contact rate (0.02) leads to termination of the epidemic, when very few individuals have become infected. The incidence and accumulated prevalence are highest when 50% of the population is infected and 50% are susceptible. Eventually, the infection disappears due to immunity and cannot be introduced again unless the immunity decreases to non‐protective level or if new non‐immune members of the group appear, for example, new children are born. (C and D) Calculated epidemic curves starting with one person being infected in a population of 25, 50, 100, 200, 400, or 800 susceptible individuals, assuming an effective contact rate (p) for transmission of the infection of 0.02 and development of immunity so the infection is cleared (reproduction number R0 = 2). Abscissas and ordinates as in A, B. The incidence and accumulated prevalence increase rapidly with increasing size of the population. (E and F) Calculated epidemic curves starting with one person being infected in a population of 25 susceptible individuals, assuming effective contact rates (p) for transmission of the infection of 0.02, 0.04, 0.08, 0.16, 0.32, or 0.64 and no development of immunity so the infection becomes chronic and continues to be infectious. (reproduction number R0 = 2). Abscissas as in A, B. E: ordinate: incidence (%) of new chronically infected patients. F: ordinate: accumulated prevalence (%) of chronically infected and therefore still infectious patients. The higher the contact rate the faster the epidemic develops and terminates due to immunity. Even the lowest contact rate (0.02) leads to slow spread of the epidemic to the whole population if no precautions (e.g., isolation) are taken and the infection therefore becomes endemic and can continue to infect new members of the group, for example, when new children are born. Calculations are done according to the Reed‐Frost stochastic compartment model, formula: It+1 = (1 − (1−p)I t)St where It is the number of infectious persons in the preceding generation, St is the number of susceptible individuals and p is the effective contact rate between infectious and susceptible individuals (44, 45).
Fig. 2
Fig. 2
Pertussis cases by year in the United States 1922–2012. A whole‐cell pertussis vaccine trial documented its effectiveness in 1940 and shortly after it became available and recommended by the American Academy of Pediatrics. The whole‐cell vaccines were gradually replaced by acellular vaccines 1992–97 and thereafter small epidemic started to occur among vaccinated adolescents and school‐aged children (4).
Fig. 3
Fig. 3
Number of epidemic outbreaks by century reported between 300 B.C. and 1911 A.C. in China (solid line) and population size (millions, gray dotted line)(1).
Fig. 4
Fig. 4
Spread of the plague in Europe. Top: Neolithic time (8). Middle: The first pandemic: The Justinianic Plague in the Roman Empire (9). Below and bottom: The second pandemic: The Black Death in the Middle Ages in Europe (www.britanica.com/event/Black‐Death). Bottom: The third pandemic (46).
Fig. 5
Fig. 5
Perception of the pandemic plague ravage before its etiology was known (top: flagellants in the Netherlands scourging themselves in atonement, believing that the Black Death is a punishment from God for their sins, 1349 (www.britanica.com/event/Black‐Death). Middle left: painting by Arnold Böcklin, 1827–1901) and protective clothing against plague (middle right) (6). Bottom: Doctors wearing gauze masks designed by Dr. Wu Lien‐teh during the Manchurian Plague 1910–11 (University of Hong Kong Libraries).
Fig. 6
Fig. 6
Spread of classical, El Tor, and O139 cholera epidemics (17).
Fig. 7
Fig. 7
The change in the age distribution of deaths from influenza in the 1918–19 pandemic. The percentages of deaths falling in the successive age groups are shown for the 1892 and 1918 epidemics of influenza. In both pandemics, there were no drugs effective against virus or bacteria. In the 1892 pandemic, the chief incidence of death was on old people. In the 1918–19 pandemic, it was on young adults in each of its three waves and in all the countries struck of the pandemic. This was not the case in the more recent pandemics in 1957 and 1968 and 1977 and 2009, where most of the deaths occurred in old people like in the 1892 pandemic (24).
Fig. 8
Fig. 8
In the spring 2005, an outbreak of HPAI influenza A H5N1 was detected in bar‐headed geese at Qinghai Lake in western China and spreads to many countries with migrating birds. Top: The major flyways of migratory birds. The H5N1 influenza spreads to many different birds in many different countries (FAO). Bottom: Outbreaks in poultries and humans (CDC).
Fig. 9
Fig. 9
The SARS pandemic in 2003. It started in China 2002 and was recognized by WHO March 2003 but was initially denied by China but it spread worldwide (WHO).
Fig. 10
Fig. 10
The effect of the Chinese public health interventions to stop the spread of the COVID‐19 epidemic in Wuhan (36). (A) Timeline of key SARS‐CoV‐2 events and new cases by day in China. (B) The effective reproduction number Rt is defined as the mean number of secondary cases generated by a typical primary case at time t in a population calculated for the whole period over a 5‐day moving average given the limited number of diagnosed cases and limited diagnostic capacity in December 2019. The darkened horizontal line indicates Rt  = 1, below which sustained transmission is unlikely so long as anti‐transmission measures are sustained, indicating that the outbreak is under control. The 95% credible interval (Cris) is presented as gray shading.
Fig. 11
Fig. 11
Treatment of syphilis with mercury ointment which was recommended by the Arabs who occupied the Iberian peninsula 711‐1492 (woodcut from 1493(47)).
Fig. 12
Fig. 12
Occurrence of acquired (upper figure) and congenital syphilis (lower figure) in Denmark 1877–200 (43)1. Since 1946, blood from all pregnant women was examined for syphilis by means of the Wassermann antiphospholipid antibody test. Ordinates: Number of cases with syphilis, abscissas: Year. The statistics originate from the medical officers 1877–1918 and from the State Serum Institute since 1919. No other country has such a long period of syphilis statistic which has been crucial for defeating syphilis.

Similar articles

Cited by

References

    1. Morabia A. Epidemic and population pattern in the Chinese Empire (243 B.C.E. to 1911 C.E.): quantitative analysis of a unique but neglected epidemic catalogue. Epidemiol Infect 2009;137:1361–8. - PubMed
    1. Gjedde A. Peter Ludvig Panums videnskabelige indsats. Copenhagen, Denmark: Costers Bogtrykkeri, 1971: 256.
    1. Muscat M, Bang H, Wohlfahrt J, Gliesmann S, Mølbak K. Measles in Europe: an epidemiological assessment. Lancet 2009;373:383–9. - PubMed
    1. Clark T. Changing pertussis epidemiology: everything old is new again. J Infect Dis 2014;209:978–81. - PubMed
    1. Nørskov‐Lauritsen N. Et paradigmeskifte. Bibl Læg 2016;208:304–23.