

Navigating the COVID-19 pandemic: Initial impacts and responses of the Organ Procurement and Transplantation Network in the United States
- PMID: 33244847
- PMCID: PMC7754561
- DOI: 10.1111/ajt.16411
Navigating the COVID-19 pandemic: Initial impacts and responses of the Organ Procurement and Transplantation Network in the United States
Abstract
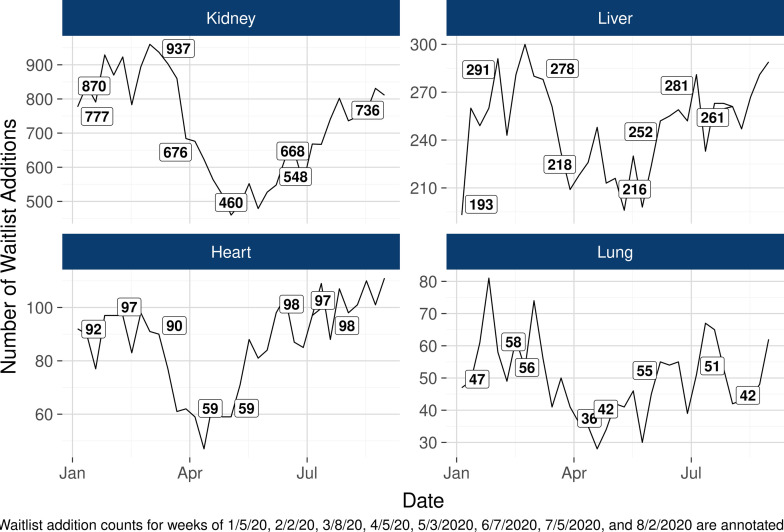
COVID-19 has been sweeping the globe, hitting the United States particularly hard with a state of emergency declared on March 13, 2020. Transplant hospitals have taken various precautions to protect patients from potential exposure. OPTN donor, candidate, and transplant data were analyzed from January 5, 2020 to September 5, 2020. The number of new waiting list registrations decreased, with the Northeast seeing over a 50% decrease from the week of 3/8 versus the week of 4/5. The national transplant system saw near cessation of living donor transplantation (-90%) from the week of 3/8 to the week of 4/5. Similarly, deceased donor kidney transplant volume dropped from 367 to 202 (-45%), and other organs saw similar decreases: lung (-70%), heart (-43%), and liver (-37%). Deceased donors recovered dropped from 260 to 163 (-45%) from 3/8 compared to 4/5, including a 67% decrease for lungs recovered. The magnitude of this decrease varied by geographic area, with the largest percent change (-67%) in the Northeast. Despite the pandemic, discard rates across organ has remained stable. Although the COVID-19 pandemic continues to evolve, OPTN data show recent evidence of stabilization, an indication that an early recovery of the number of living and deceased donors and transplants has ensued.
Keywords: Organ Procurement and Transplantation Network (OPTN); donors and donation: deceased; donors and donation: living; ethics and public policy; infection and infectious agents - viral; infectious disease; organ procurement; organ procurement and allocation; organ transplantation in general.
© 2020 The American Society of Transplantation and the American Society of Transplant Surgeons.
Figures


References
-
- Rolling updates on coronavirus disease (COVID-19). https://www.who.int/emergencies/diseases/novel-coronavirus-2019/events-a.... Accessed April 9, 2020
-
- Proclamation on Declaring a National Emergency Concerning the Novel Coronavirus Disease (COVID-19) Outbreak. https://www.whitehouse.gov/presidential-actions/proclamation-declaring-n.... Accessed April 9, 2020
-
- Coronavirus COVID-19 Global Cases by the Center for Systems Science and Engineering (CSSE) at Johns Hopkins University (JHU). https://gisanddata.maps.arcgis.com/apps/opsdashboard/index.html#/bda7594.... Accessed April 8, 2020
-
- Coronavirus Disease, 2019. Cases in the US. Centers for Disease Control and Prevention. 2019. https://covid.cdc.gov/covid-data-tracker/#cases_totalcases. Accessed September 18, 2020
Publication types
MeSH terms
Grants and funding
LinkOut - more resources
Full Text Sources
Medical
