. 2021 Feb;12(1):109-129.
doi: 10.1002/jcsm.12643. Epub 2020 Nov 27.

Single-cell RNA sequencing and lipidomics reveal cell and lipid dynamics of fat infiltration in skeletal muscle

Affiliations

Single-cell RNA sequencing and lipidomics reveal cell and lipid dynamics of fat infiltration in skeletal muscle

Ziye Xu et al. J Cachexia Sarcopenia Muscle. 2021 Feb.

Abstract

Background: Ageing is accompanied by sarcopenia and intramuscular fat (IMAT) infiltration. In skeletal muscle, fat infiltration is a common feature in several myopathies and is associated with muscular dysfunction and insulin resistance. However, the cellular origin and lipidomic and transcriptomic changes during fat infiltration in skeletal muscle remain unclear.

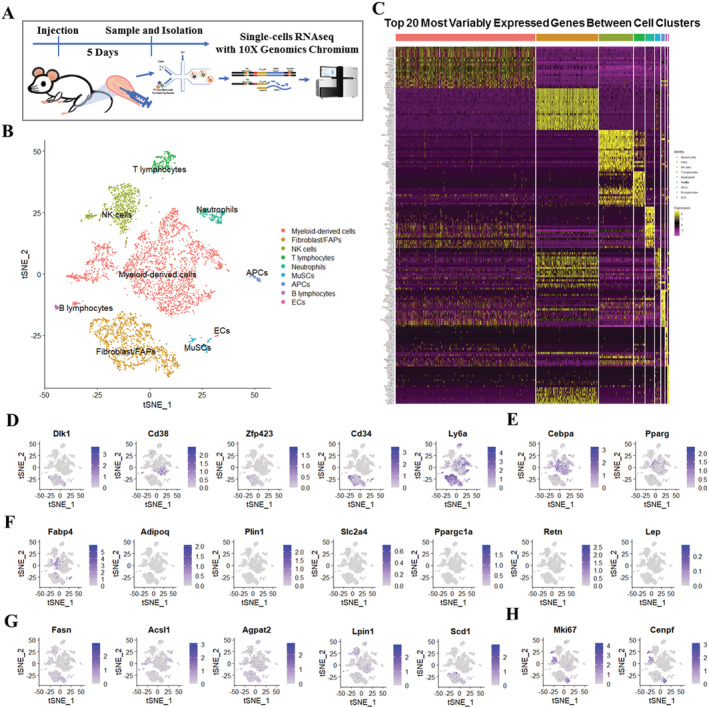
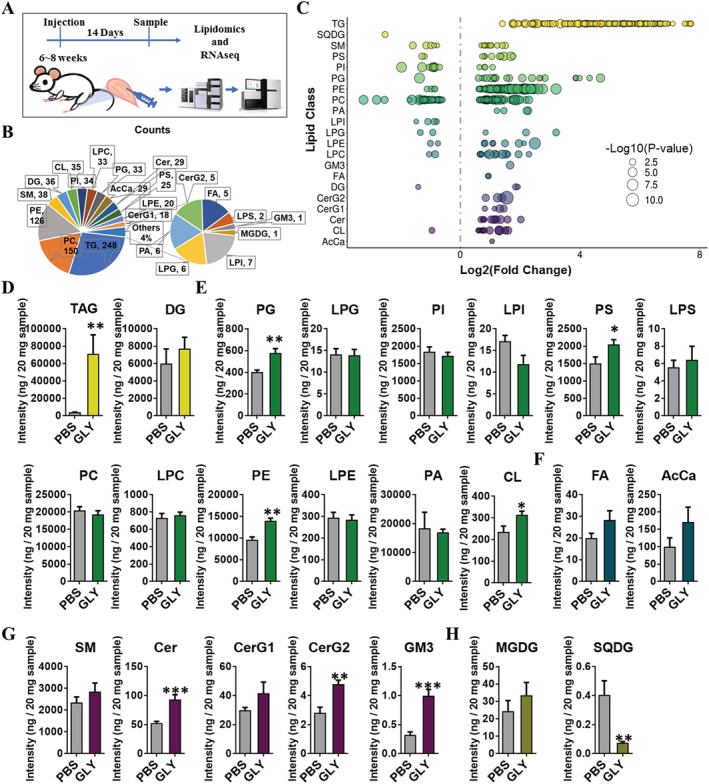
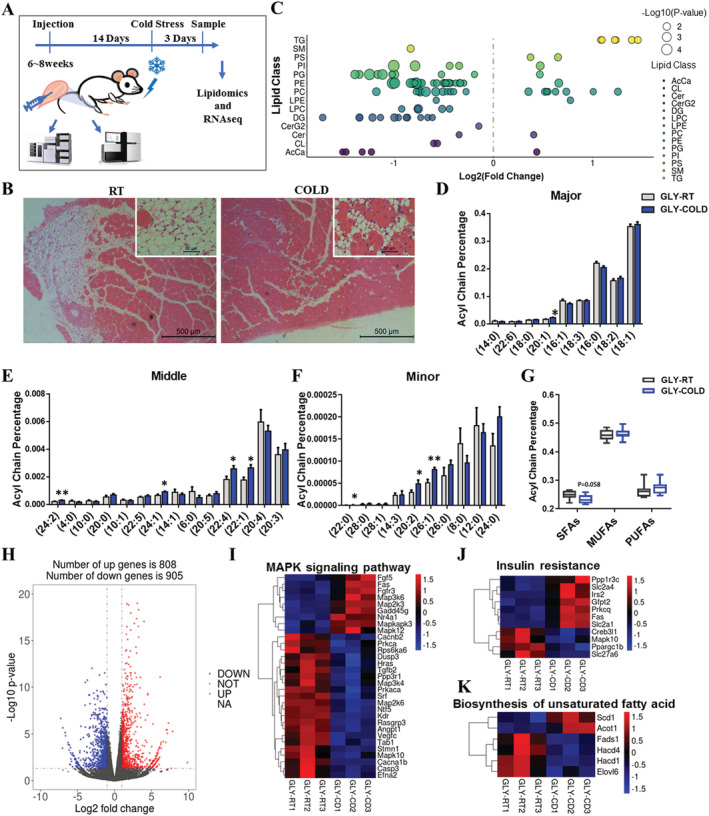
Methods: In the current study, we generated a high IMAT-infiltrated skeletal muscle model by glycerol (GLY) injection. Single-cell RNA sequencing and lineage tracing were performed on GLY-injured skeletal muscle at 5 days post-injection (DPI) to identify the cell origins and dynamics. Lipidomics and RNA sequencing were performed on IMAT-infiltrated skeletal muscle at 14 DPI (or 17 DPI for the cold treatment) to analyse alterations of lipid compositions and gene expression levels.

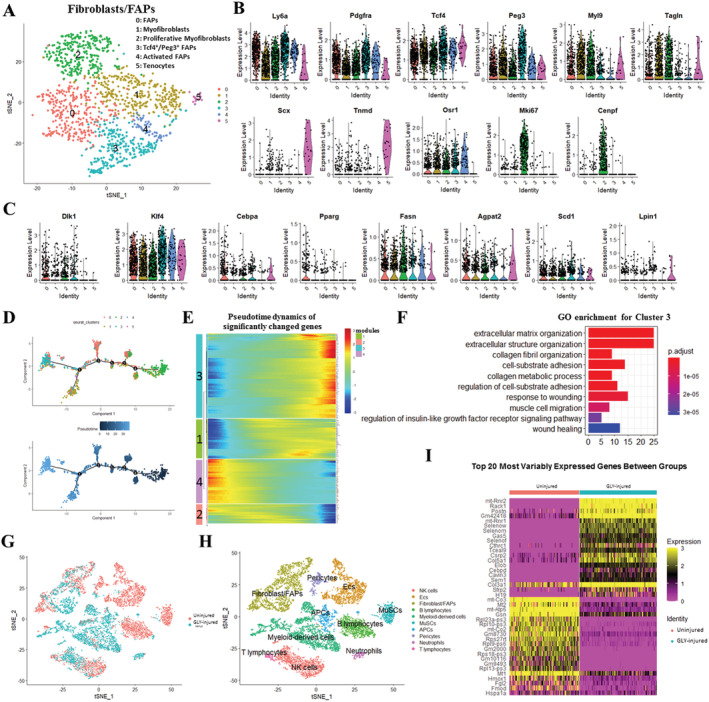
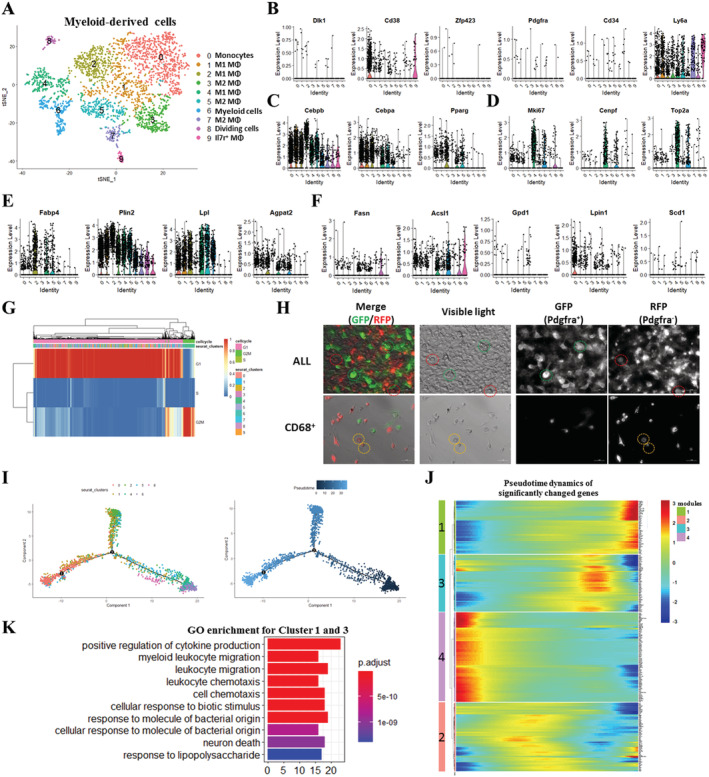
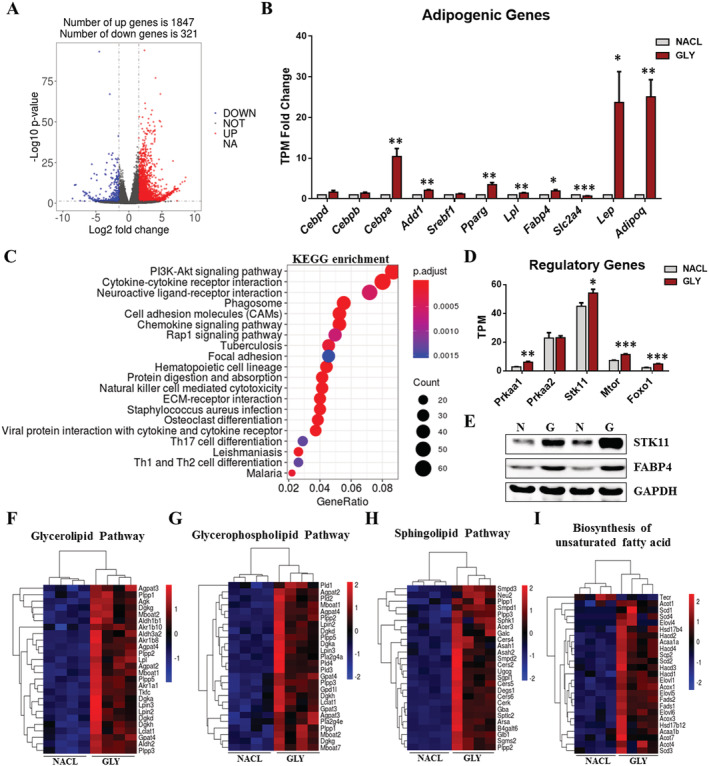
Results: We identified nine distinct major clusters including myeloid-derived cells (52.13%), fibroblast/fibro/adipogenic progenitors (FAPs) (23.24%), and skeletal muscle stem cells (2.02%) in GLY-injured skeletal muscle. Clustering and pseudotemporal trajectories revealed six subpopulations in fibroblast/FAPs and 10 subclusters in myeloid-derived cells. A subpopulation of myeloid-derived cells expressing adipocyte-enriched genes and Pdgfra- /Cd68+ cells displayed lipid droplets upon adipogenic induction, indicating their adipogenic potential. Lipidomic analysis revealed the changes of overall lipid classes composition (e.g. triglycerides (TAGs) increased by 19.3 times, P = 0.0098; sulfoquinovosyl diacylglycerol decreased by 83%, P = 0.0056) and in the distribution of lipids [e.g. TAGs (18:2/18:2/22:6) increased by 181.6 times, P = 0.021] between GLY-group and saline control. RNA-seq revealed 1847 up-regulated genes and 321 down-regulated genes and significant changes in lipid metabolism-related pathways (e.g. glycerolipid pathway and glycerophospholipid pathway) in our model of GLY-injured skeletal muscle. Notably, short-term cold exposure altered fatty acid composition (e.g. saturated fatty acid decreased by 6.4%, P = 0.058) in fat-infiltrated muscles through directly affecting lipid metabolism pathways including PI3K-AKT and MAPK signalling pathway.

Conclusions: Our results showed that a subpopulation of myeloid-derived cells may contribute to IMAT infiltration. GLY-induced IMAT infiltration changed the lipid composition and gene expression profiles. Short-term cold exposure might regulate lipid metabolism and its related signalling pathways in fat-infiltrated muscle. Our study provides a comprehensive resource describing the molecular signature of fat infiltration in skeletal muscle.

Keywords: Fat infiltration; Intramuscular fat; Lipidomics; Muscle wasting; Sarcopenia; Single-cell RNA sequencing; Skeletal muscle.


Conflict of interest statement

None declared.

Figures

Figure 1
Figure 1
scRNA‐seq identifies distinct cell populations in GLY‐injured skeletal muscle. (A) Scheme of muscle preparation, single‐cell isolation, and scRNA‐seq at 5 DPI. (B) Graph‐based clustering of isolated single cells identifies distinct clusters corresponding to different cell populations. (C) Heat map representing the top 20 most differently expressed genes between cell clusters identified. Colours and numbers correspond to the cell clusters shown in (B). Expression of (D) preadipocyte‐enriched genes (Dlk1, Cd38, Zfp423, Cd34, and Ly6a), (E) adipogenic master regulators (Cebpa and Pparg), (F) late adipogenic genes (Fabp4, Adipoq, Plin1, Slc2a4, Ppargc1a, Retn, and Lep), (G) lipogenic genes (Fasn, Acsl1, Agpat2, Lpin1, and Scd1), and (H) proliferation genes (Mki67 and Cenpf) in these populations.
Figure 2
Figure 2
Clustering and pseudotemporal trajectories identify transcriptional dynamics of fibroblast/FAPs. (A) Graph‐based clustering of fibroblast/FAPs showing six subclusters. (B) Expression of marker genes (Ly6a, Pdgfra, Tcf4, Peg3, Myl9, Tagin, Scx, Tnmd, Osr1, Mki67, and Cenpf). (C) Expression of adipogenesis‐related markers (Dlk1, Klf4, Cebpa, Pparg, Fasn, Agpat2, Scd1, and Lpin1). (D) Pseudotime single‐cell trajectory reconstructed by Monocle2 for fibroblast/FAPs. Pseudotime is shown coloured in a gradient from dark to light blue, and start of pseudotime is indicated. (E) Pseudotemporal heat map showing gene expression dynamics for significant marker genes. Genes (rows) were clustered into four modules, and cells (columns) were ordered according to pseudotime. (F) GO enrichment analysis of genes in Module 4. (G) The t‐SNE plot of merged isolated single cells forms normal and GLY‐injured skeletal muscle. (H) Graph‐based clustering of merged isolated single cells forms normal and GLY‐injured skeletal muscle. (I) Heat map of top 20 significant genes between normal and GLY‐injured fibroblast/FAPs.
Figure 3
Figure 3
Clustering and pseudotemporal trajectories identified transcriptional dynamics of myeloid‐derived cells. (A) Graph‐based clustering of myeloid‐derived cells showing 10 subclusters. (B) Expression of adipocyte‐enriched genes (Dlk1, Cd38, Zfp423, Pdgfra, Cd34, and Ly6a). (C) Expression of adipogenic master regulators (Cebpb, Cebpa, and Pparg). (D) Expression of proliferation genes (Mki67 and Cenpf). (E) Expression of lipid synthesis genes (Fabp4, Plin2, Lpl, and Agpat2). (F) Expression of lipid metabolism genes (Fasn, Acsl1, Gpd1, Lpin1, and Scd1). (G) Cell cycle analysis of myeloid‐derived cells. (H) Fluorescence and visible light micrographs of all single cells and Cd68+ cells isolated from GLY‐injected TA of Pdgfracre/ROSAmT/mG mice after adipogenic differentiation. Red circles: Pdgfra cells with lipid droplets; green circles: Pdgfra+ cells with lipid droplets; and yellow circles: Pdgfra/Cd68+cells with lipid droplets. (I) Pseudotime single‐cell trajectory reconstructed by Monocle2 for seven subclusters of myeloid‐derived cells, including Mye0, Mye1, Mye2, Mye4, Mye5, Mye6, and Mye8. Pseudotime is shown coloured in a gradient from dark to light blue, and start of pseudotime is indicated. (J) Pseudotemporal heat map showing gene expression dynamics for significant marker genes. Genes (rows) were clustered into four modules, and cells (columns) were ordered according to pseudotime. (K) GO enrichment analysis of genes in Modules 1 and 3.
Figure 4
Figure 4
GLY‐induced IMAT infiltration changes in the overall composition of lipids in skeletal muscle. (A) Scheme of muscle preparation and lipidomic analysis of NACL‐injected or GLY‐injected TA at 14 DPI. (B) Composition of lipid classes that were considered for subsequent analysis in all of the samples detected by liquid chromatography–mass spectrometry/mass spectrometry. (C) Log2 fold changes in lipid species in NACL‐injected vs. GLY‐injected TA and the corresponding significance values displayed as −log10 (P‐value). Each dot represents a lipid species, and the dot size indicates significance. Only lipids with P < 0.05 are displayed (n = 8). The intensity fold change of (D) glycerolipids, (E) glycerophospholipids, (F) fatty acyls, (G) sphingolipids, and (H) saccharolipids in NACL‐injected vs. GLY‐injected TA. Data are presented as means ± standard error of the mean (n = 8). *P < 0.05; ***P < 0.001.
Figure 5
Figure 5
GLY‐induced IMAT infiltration affects gene expression involved in lipid metabolism. (A) Log2 fold changes in exons of RNA‐Seq gene bodies in NACL‐injected and GLY‐injected TA (n = 4) and the corresponding significance values displayed as log10 (P‐value). The transverse and vertical dotted lines indicate the cut‐off value for differential expression (P < 0.05 and abs (log2 fold changes) > 1). In total, 1847 and 321 genes were identified that had induced (red) or repressed (blue) expression levels by GLY injection. (B) TPM fold change of adipogenic genes (Cebpd, Cebpb, Cebpa, Add1, Srebf1, Pparg, Lpl, Fabp4, Scl2a4, Lep, and Adipoq) (n = 4). (C) Functional enrichment analyses using Kyoto Encyclopedia of Genes and Genomes (KEGG) pathways. The triangle size indicates significance and corresponding significance values displayed as log10 (P‐value). (D) TPM levels of lipid metabolism regulatory genes (Prkaa1, Prkaa1, Stk11, Mtor, and Foxo1) (n = 4). (E) The protein levels of STK11, FABP4, and GAPDH in NACL‐injected and GLY‐injected TA (n = 2). Heat map showing relative expression of (F) the glycerolipid pathway, (G) the glycerophospholipid pathway, (H) biosynthesis of unsaturated fatty acids, and (I) the sphingolipid pathway‐related genes derived from the RNA‐seq dataset.
Figure 6
Figure 6
Cold exposure alters the fatty acid composition in IMAT‐infiltrated TA. (A) Scheme of muscle preparation and lipidomic analysis of GLY‐induced IMAT‐infiltrated (after 14 days) TA from cold‐exposed (3 days) and RT mice. (B) H&E staining of IMAT‐infiltrated TA from cold‐exposed and RT mice (n = 3). Scale bars, 100 mm. (C) Log2 fold changes in lipid species in IMAT‐infiltrated TA from cold‐exposed and RT mice and the corresponding P‐values displayed as −log10 (P‐value). Each dot represents a lipid species, and dot size indicates significance. Only lipids with P < 0.05 are displayed (n = 8). (D–F) The total intensity of individual fatty acyl chains associated with TAG (n = 8). (G) Percentages of SFA, MUFA, and PUFA in TAG acyl chain in IMAT‐infiltrated TA from cold‐exposed and RT mice (n = 8). (H) Log2 fold changes in exons of RNA‐seq gene bodies in IMAT‐infiltrated TA from cold‐treated and RT mice (n = 4) and the corresponding P‐values displayed as log10 (P‐value). The transverse and vertical dotted lines indicate the cut‐off values for differential expression (P < 0.05 and abs (log2 fold changes) > 1). In total, 808 and 905 genes were identified that had increased (red) or lowered (blue) expression levels due to cold exposure. (I–K) Heat map of relative expression of the MAPK signalling, insulin resistance, and unsaturated fatty acid biosynthesis pathway‐related genes from the RNA‐seq dataset of RT vs. COLD groups.

References

    1. Brioche T, Pagano AF, Py G, Chopard A. Muscle wasting and aging: experimental models, fatty infiltrations, and prevention. Mol Aspects Med 2016;50:56–87. - PubMed
    1. Wang J, Cui C, Chim YN, Yao H, Shi L, Xu J, et al. Vibration and β‐hydroxy‐β‐methylbutyrate treatment suppresses intramuscular fat infiltration and adipogenic differentiation in sarcopenic mice. J Cachexia Sarcopenia Muscle 2020;11:564–577. - PMC - PubMed
    1. Pagano AF, Brioche T, Arc‐Chagnaud C, Demangel R, Chopard A, Py G. Short‐term disuse promotes fatty acid infiltration into skeletal muscle. J Cachexia Sarcopeni 2018;9:335–347. - PMC - PubMed
    1. Hilton TN, Tuttle LJ, Bohnert KL, Mueller MJ, Sinacore DR. Excessive adipose tissue infiltration in skeletal muscle in individuals with obesity, diabetes mellitus, and peripheral neuropathy: association with performance and function. Phys Ther 2008;88:1336–1344. - PMC - PubMed
    1. Greco AV, Mingrone G, Giancaterini A, Manco M, Morroni M, Cinti S, et al. Insulin resistance in morbid obesity: reversal with intramyocellular fat depletion. Diabetes 2002;51:144–151. - PubMed

Publication types