. 2021 Jan 15;478(1):21-39.
doi: 10.1042/BCJ20200710.

Patient-derived glioblastoma stem cells transfer mitochondria through tunneling nanotubes in tumor organoids

Affiliations

Patient-derived glioblastoma stem cells transfer mitochondria through tunneling nanotubes in tumor organoids

Giulia Pinto et al. Biochem J. .

Abstract

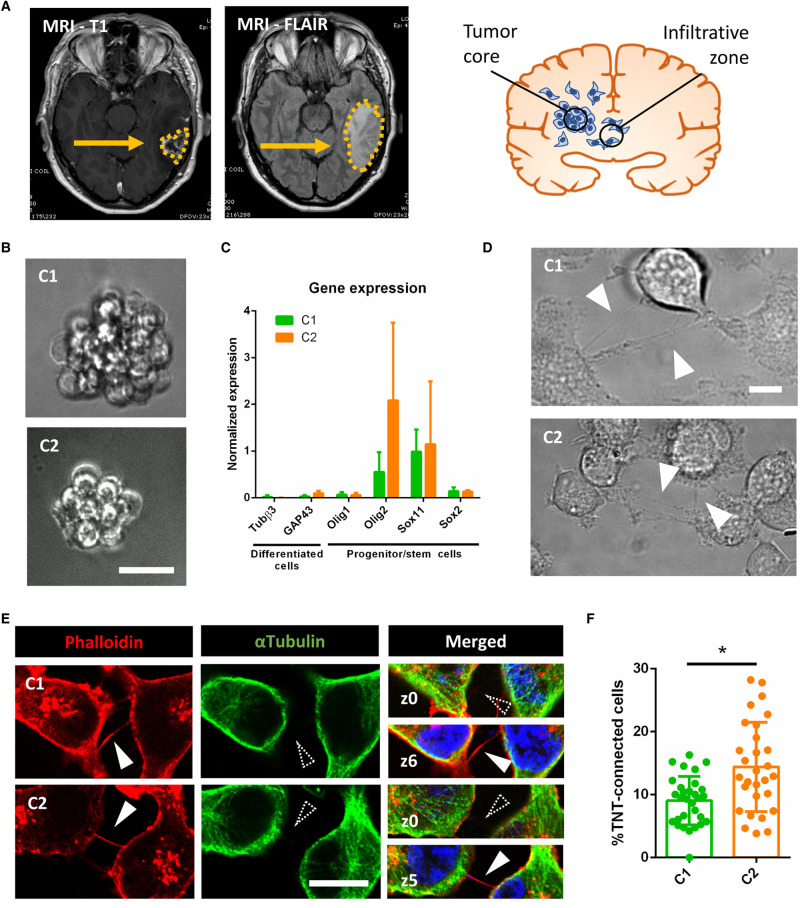
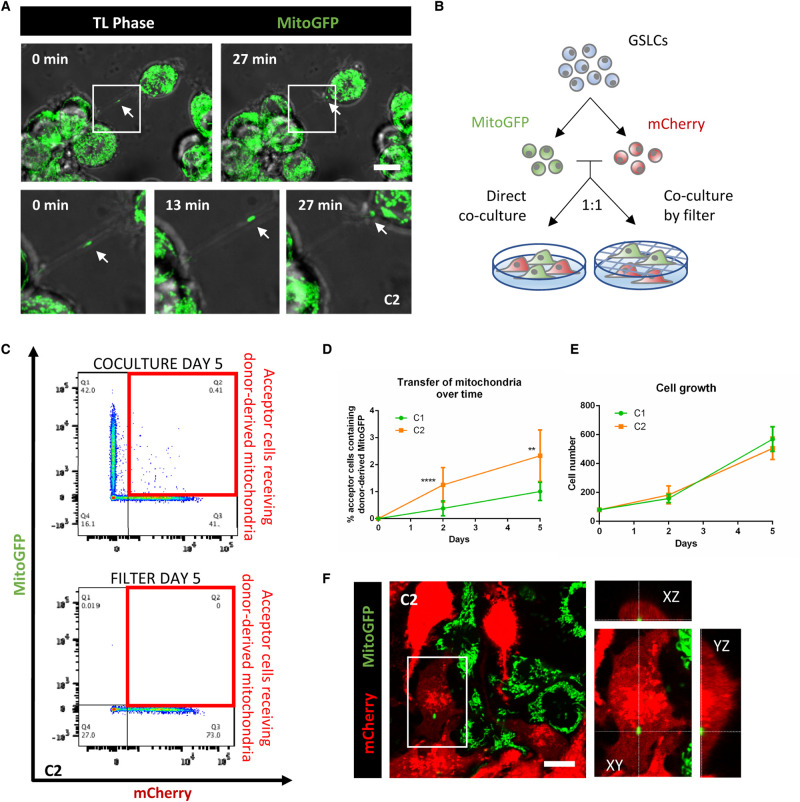
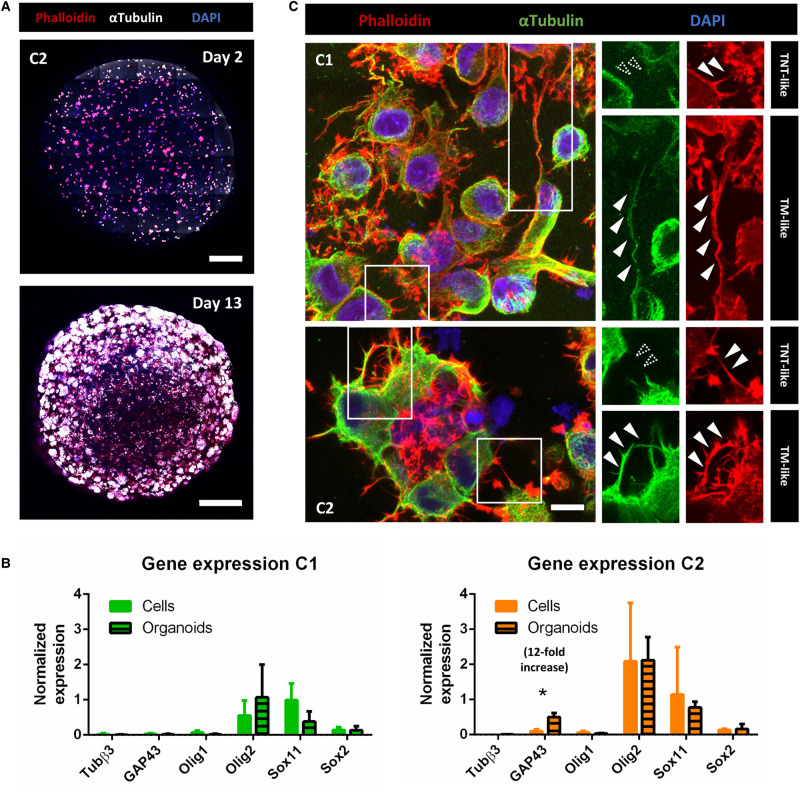
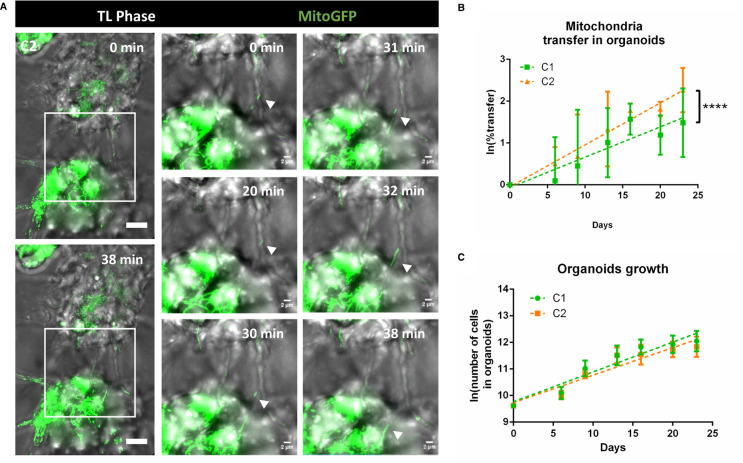
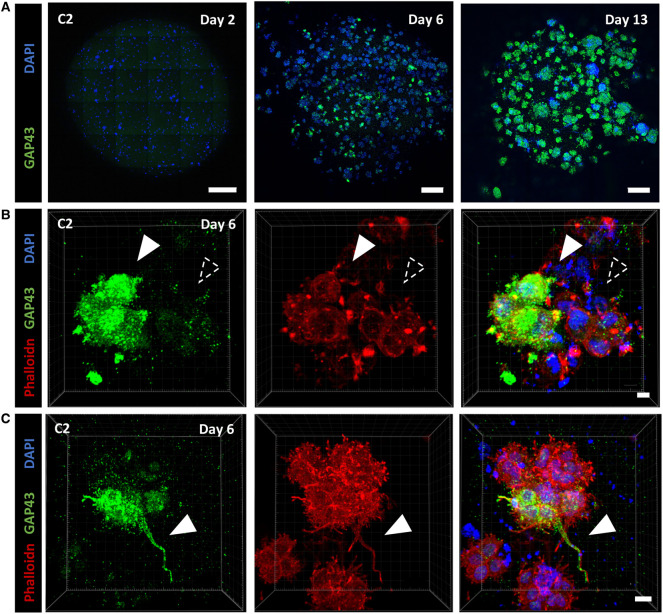
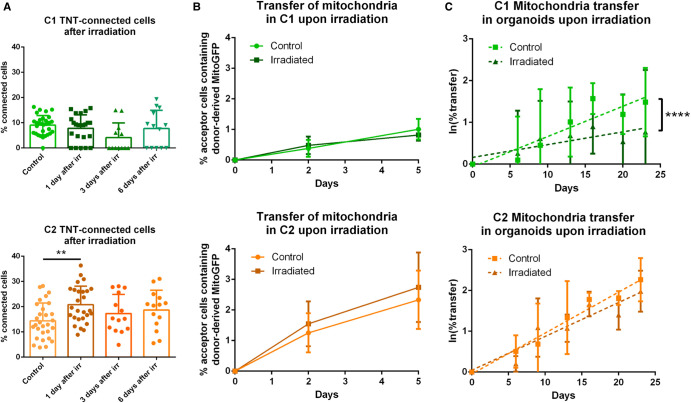
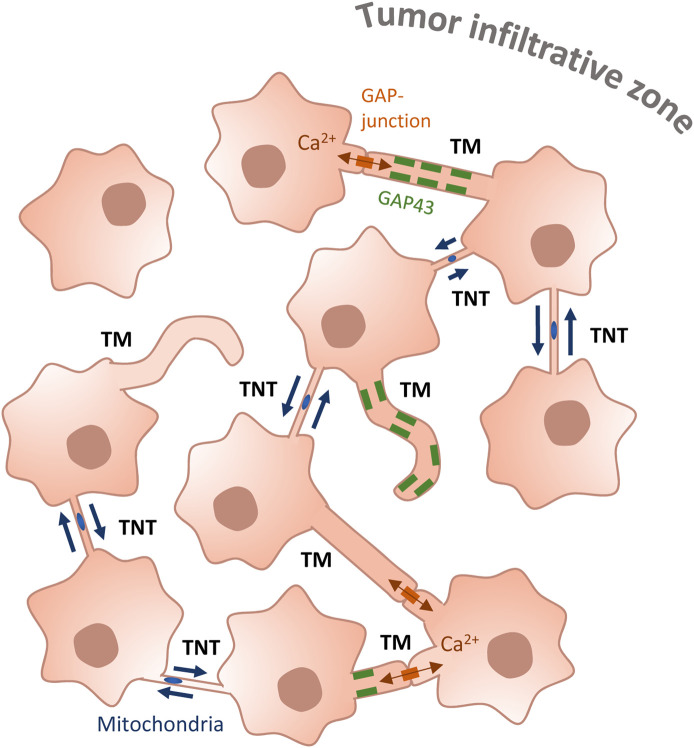
Glioblastoma (GBM) is the most aggressive brain cancer and its relapse after surgery, chemo and radiotherapy appears to be led by GBM stem cells (GSCs). Also, tumor networking and intercellular communication play a major role in driving GBM therapy-resistance. Tunneling Nanotubes (TNTs), thin membranous open-ended channels connecting distant cells, have been observed in several types of cancer, where they emerge to drive a more malignant phenotype. Here, we investigated whether GBM cells are capable to intercommunicate by TNTs. Two GBM stem-like cells (GSLCs) were obtained from the external and infiltrative zone of one GBM from one patient. We show, for the first time, that both GSLCs, grown in classical 2D culture and in 3D-tumor organoids, formed functional TNTs which allowed mitochondria transfer. In the organoid model, recapitulative of several tumor's features, we observed the formation of a network between cells constituted of both Tumor Microtubes (TMs), previously observed in vivo, and TNTs. In addition, the two GSLCs exhibited different responses to irradiation in terms of TNT induction and mitochondria transfer, although the correlation with the disease progression and therapy-resistance needs to be further addressed. Thus, TNT-based communication is active in different GSLCs derived from the external tumoral areas associated to GBM relapse, and we propose that they participate together with TMs in tumor networking.

Trial registration: ClinicalTrials.gov NCT01872221.

Keywords: cancer; cell communication; glioblastoma; stem cells; tunneling nanotubes.


Conflict of interest statement

The authors declare that there are no competing interests associated with the manuscript.

Figures

Figure 1.
Figure 1.. GSLCs form TNT-like structures.
(A) MRI analysis of C patient glioblastoma. The tumor is composed by a compact cellular part defined ‘Tumor core’, identified by MRI T1-Gadolinium (on the left). Some tumoral cells infiltrate the normal tissue, forming the ‘Infiltrative zone’ which is identified by MRI-FLAIR (right picture and schematics). C1 and C2 cells were obtained from different parts of the infiltrative zone (see Supplementary Figure S1). (B) C1 and C2 cell growth, forming neurosphere-like clusters in suspension. The resulting image represents a Z-projection of 30 and 50 slides (step size: 0.5 µm), respectively, acquired in Bright field using 40× magnification. Scale bar = 10 µm. (C) Expression of differentiation and progenitor/stem cells markers in C1 and C2, respectively in green and orange. The relative gene expressions were quantified by RT-qPCR after RNA extraction. Data were normalized over the expression of HPRT, housekeeping gene. GFAP and CHI3L1 showed no expression in both C1 and C2 and are not represented on the graph. The graph represents the means with SD of five independent experiments, each point performed in triplicate. P values >0.05 are not significant and not indicated on the figure. (D) GSLCs connected by TNT in live imaging in 2D culture. Cells were seeded on laminin-coated plates and pictures were taken after 6 h of seeding using 60× 1.4NA CSU oil immersion objective lens using Bright field. Arrowheads point to TNT-like connections. Scale bar = 20 µm. (E) GSLC TNTs containing actin but not microtubules. Cells were plated on laminin-coated surface for 6 h, fixed and stained with phalloidin (actin filaments, red), anti-αTubulin (microtubules, green) and DAPI (nuclei, blue). Representative images were acquired showing TNTs, actin-positive and αTubulin-devoid, floating above the dish surface. White-filled arrowhead indicates presence of TNT labeling, dashed arrowhead indicates absence of TNT staining. Scale bar = 10 µm. (F) Quantification of TNT-connected cells in C1 and C2, respectively in green and orange. GSLC were plated on laminin-coated surface, fixed after 6 h and stained with WGA. 2 × 2 tiles images were acquired with 60× objective and analyzed by Icy software. C1 were forming 9.0 ± 4% of connecting cells (five independent experiments each performed in duplicates, total n cells counted = 1239), while C2 were forming 14.4 ± 7% (four independent experiments, each performed in duplicates, total n cells counted = 1367), significantly more connected cells than C1 (P = 0.0370). Each dot represents an image containing an average of 40 cells each. P-values were deduced from contrast comparing the two cell populations in a logistic regression model. Error bar = standard deviation. P value <0.05 (*).
Figure 2.
Figure 2.. GSLCs transfer mitochondria through TNTs.
(A) C2 expressing MitoGFP are connected by TNTs containing mitochondria. Cells were seeded on laminin-coated dish and after 6 h video were acquired using Bright field and laser 488 in a Spinning Disk microscope. Timeframes show the mitochondria moving along the connection and entering in one of the two connected cells. Each timeframe of the video is the result of the Z-projection of 18 slides (step size: 0.5 µm) (B) Schematic representation of the co-culture experiment. Donor MitoGFP cells were co-cultured with acceptor mCherry cells at 1 : 1 ratio either by direct contact or through a 1 µm filter. (C) Representative flow cytometry plot of C2 after 5 days of co-culture. Acceptor and donor cells, respectively lie on the X and Y axis. Acceptor cells positive for MitoGFP signal are framed in the red boxes. (D) Quantification by flow cytometry of the mitochondria transfer over time in C1 and C2, respectively in green and orange. A minimum of 10 000 events were analyzed after 2 or 5 days of co-culture. C1 shows 0.38 ± 0.27% and 1.01 ± 0.33% of acceptor cells receiving mitochondria after 2 and 5 days, respectively (four independent experiments, each performed in duplicate). C2 shows 1.25 ± 0.63% and 2.33 ± 0.95% of acceptor cells receiving mitochondria after 2 and 5 days, respectively (five independent experiments, each performed in duplicate), significantly more than C1 (P < 0.0001 (****) at day 2, P = 0.0085 (**) at day 5). P-values were deduced from contrast comparing the two cell populations in a logistic regression model. Error bar = SD (E) Cell growth in co-culture experiment. 80 000 GSLCs per well were plated at time 0 and counted after co-culture. For C1, 158 000 ± 28 751 and 568 866 ± 85 332 cells were counted after 2 and 5 days, respectively (three independent experiments). For C2, 182 900 ± 61 890 and 505 260 ± 77 515 cells were counted after 2 and 5 days, respectively (five independent experiments). Error bar = SD. ANOVA two-way test was performed and showed no significant difference between C1 and C2 at the two timepoint in analyze. (F) Representative image of co-culture assay in C2. Donor MitoGFP (in green) and acceptor mCherry cells (in red) were fixed after 5 days of co-culture, confocal images were acquired with 63× objective. In the magnification, the orthogonal view of an acceptor cell containing donor-derived mitochondria. Scale bar = 10 µm.
Figure 3.
Figure 3.. GSLCs in tumor organoids.
(A) Images of C2 tumor organoids at 2 and 13 days of growth using Pln-Apo 10×/0.45 objective of inverted confocal LSM700. The resulting images represent a max intensity projection of 5 and 31 sections (step size: 7 and 3.12 µm), respectively, stained for anti-αTubulin (microtubules, white), Phalloidin (actin in red) and nuclei (blue). Scale bars are 200 (top) and 500 µm (bottom). (B) Expression of differentiation and progenitor/stem cells markers in C1 and C2 organoids, respectively in green and orange. The relative gene expressions were quantified by RT-qPCR after RNA extraction from 23-days-old organoids, normalized over the expression of HPRT. Note the 12-fold increased expression of GAP43 in C2 tumor organoids, and GFAP and CHI3L1 show no expression in both conditions and are not represented on the graph. The graphs represent means with SD of three and four independent experiments for C1 and C2 respectively, each point performed in triplicate. Holm–Sidak method was applied to determine statistical significance between cells and organoids for each gene. P value <0.05 (*), P values >0.05 are not significant and not indicated on the figure. (C) C1 and C2 tumor organoids at 9 and 6 days, respectively, stained for anti-αTubulin (microtubules, green), Phalloidin (actin filaments, red), and nuclei (blue). Confocal images were acquired with 40× objective. Regions of interest show either αTubulin-devoid connections, defined as TNT-like (<1 µm), or thick αTubulin-positive connections (>1 µm), named TM-like. Dashed arrowheads indicate absence of fluorescent signal at the connection level, white-filled arrowhead show positiveness to the signal. Both images are max intensity projections of 12 slices (step size: 0.38 µm). Scale bar = 10 µm.
Figure 4.
Figure 4.. Mitochondria transfer in tumor organoids.
(A) TNT-like connection between C2 cells containing mitochondria in 6-days old tumor organoids. Timeframes result of the max projection of 62 slides (step size: 0.5 µm) with a total physical thickness of 31 µm, with 1 minute of interval time. White arrows point to the mitochondria movement inside the TNT at the different time points. Video were acquired using Bright field and laser 488 in a Spinning Disk microscope. (B) Quantification of the mitochondria transfer in tumor organoids over time in C1 and C2, respectively in green and orange. Organoids were prepared mixing donor and acceptor cells for each GSLC. For each timepoint and condition, duplicates of a pool of three organoids were dissociated in a single cell suspension and fixed for flow cytometry analysis after 6, 9, 13, 16, 20 and 23 days of culture. All the cells in the suspension were analyzed to obtain the percentage of acceptor cells receiving mitochondria. C1: day 6 1.54 ± 1.4%; day 9 2.80 ± 2.9%; day 13 2.20 ± 1.1%; day 16 5.07 ± 2.06%; day 20 3.55 ± 1.5%; day 23 3.05 ± 0.84% (four independent experiments). C2: day 6 1.72 ± 0.7%; day 9 2.64 ± 2.2%; day 13 4.96 ± 4.35%; day 16 5.98 ± 1.02%; day 20 5.57 ± 0.03%; day 23 8.37 ± 2.7% (three independent experiments). Percentage of transfer was transformed into a logarithmic scale. Error bar = SD. P-values are deduced by comparing the slopes of the two cellular population in a logistic regression model as described in material and methods. P value <0.0001 (****) (C) Cell number in tumor organoids. For each timepoint and condition, duplicates of a pool of three organoids were dissociated in a single cell suspension C1: day 6 24 800 ± 5768; day 9 63 150 ± 18 350; day 13 105 850 ± 43 970; day 16 140 450 ± 33 929; day 20 158 600 ± 60 394 day 23 181 800 ± 78 820 (four independent experiments). C2: day 6 22 600 ± 3704; day 9 49 700 ± 8116; day 13 104 200 ± 33 870; day 16 108 580 ± 42 218; day 20 128 800 ± 34 478; day 23 145 080 ± 47 726 (four independent experiments). The cell number was transformed into a logarithmic scale and slopes were compared by linear regression (dashed lines). No significant difference was observed between C1 and C2.
Figure 5.
Figure 5.. GAP43 expression and TM characterization in tumor organoids of GSLC cells.
(A) GAP43 protein expression increases over time. 2, 6 and 13 days-old organoids were fixed and stained with anti-GAP43 (in green) and DAPI (in blue). Confocal images with 10× objective were acquired. Images result from the max intensity projection of 5, 20, 11 sections (step size: 7, 3.13, 3.13 µm), respectively. Scale bars: 500 µm, 200 µm, 200 µm (from left to right). (B) Heterogeneous expression of GAP43 in C2 tumor organoids. 6 days-old C2 organoids were fixed and stained with anti-GAP43 (in green), phalloidin (actin filaments, in red) and DAPI (in blue). Confocal images with 63× objective were acquired. 3D reconstruction of a 50-sections image (step size: 0.33 µm) was performed using Imaris Viewer software. White-filled arrowhead point to a cluster of cells expressing GAP43, alternatively a group of cells negative for its expression are indicated with a dashed arrowhead. Scale bar: 5 µm. (C) TM-like protrusion can express GAP43 in C2 organoids. Six days-old C2 organoids were fixed and stained with anti-GAP43 (in green), phalloidin (actin filaments, in red) and DAPI (in blue). Confocal images with 63× objective were acquired. 3D reconstruction of a 77-sections image (step size: 0.77 µm) was perfomed using Imaris Viewer software. White-filled arrowheads point toward a TM-like extension expressing GAP43. Scale bar: 15 µm. 3D reconstructions were performed with Imaris Software.
Figure 6.
Figure 6.. Effect of GSLC irradiation on TNT-based communication.
(A) Quantification of TNT- connected cells in C1 and C2 after irradiation, respectively in green and orange, in adherent cell culture. GSLCs were irradiated 1 day before cell plating on laminin-coated surface, then fixed after 6 h and stained with WGA. 2 × 2 tiles images were acquired with 60× objective and analyzed by Icy software, experimental duplicates were performed for each condition. The graphs represent means with SD. C1 were forming 7.8 ± 5% (four independent experiments, tot n cells counted = 891), 4.1 ± 6% (three independent experiments, total n cells counted = 300) and 7.7 ± 7% (three independent experiments, total n cells counted = 313) of connecting cells after 1, 3 and 6 days from the irradiation, respectively. No statistically significant difference was observed compared with control (9.0 ± 4%, five independent experiments, total n cells counted = 1239). C2 were forming 20.8 ± 7% (four independent experiments, total n cells counted = 1368), 17.3 ± 7% (three independent experiments, total n cell counted = 552) and 18.7 ± 8% (three independent experiments, total n cells counted = 462) of connecting cells after 1, 3 and 6 days from the irradiation, respectively. A statistically significant increase was observed 1 day after irradiation compared with control (14.4 ± 7%, four independent experiments, total n cells counted = 1367, P = 0.0073 (**)). Each dot represents an image containing an average of 40 cells each. P-values were deduced from contrast comparing the two cell populations in a logistic regression model. (B) Quantification of the mitochondria transfer by flow cytometry in both GSLCs over time in C1 and C2 upon irradiation, respectively in green and orange. Donor GSLC were irradiated 1 day before the co-culture, analysis was performed after 2 or 5 days (corresponding at 3 and 6 days from the irradiation). A minimum of 10 000 events were analyzed per condition, each performed in duplicate. In irradiated condition, C1 show 0.48 ± 0.28% and 0.81 ± 0.18% of acceptor cells receiving mitochondria after 2 and 5 days, respectively (four independent experiments). No statistically significant difference was observed compared with control (day 2: 0.38 ± 0.27%; day 5 1.01 ± 0.33%; four independent experiments). In irradiated condition, C2 show 1.54 ± 0.73% and 2.74 ± 1.13% of acceptor cells receiving mitochondria after 2 and 5 days, respectively (five independent experiments). No statistically significant difference was observed compared with control (day 2: 1.25 ± 0.63%; day 5: 2.33 ± 0.95%. Five independent experiments). P-values were deduced from contrast comparing the two cell populations in a logistic regression model. Graphs are means with SD. (C) Quantification of the mitochondria transfer in tumor organoids upon irradiation in C1 and C2, respectively in green and orange. Organoids were prepared mixing donor and acceptor cells for each GSLC and irradiated at 5 days from their preparation. Experiment was performed as in Figure 4D. Control C1: day 6 1.54 ± 1.4%; day 9 2.80 ± 2.9%; day 13 2.20 ± 1.1%; day 16 5.07 ± 2.06%; day 20 3.55 ± 1.5%; day 23 3.05 ± 0.84%. Irradiated C1: day 6 1.90 ± 1.6%; day 9 4.45 ± 1.9%; day 13 2.50 ± 1.7%; day 16 2.82 ± 1.5%; day 20 2.39 ± 1.61%; day 23 1.76 ± 1.2% (four independent experiments, P < 0.0001, ****). Control C2: day 6 1.72 ± 0.7%; day 9 2.64 ± 2.2%; day 13 4.96 ± 4.35%; day 16 5.98 ± 1.02%; day 20 5.57 ± 0.03%; day 23 8.37 ± 2.7%. Irradiated C2: day 6 1.23 ± 0.2%; day 9 3.50 ± 2.3%; day 13 3.03 ± 0.9%; day 16 5.46 ± 1.5%; day 20 4.23 ± 1.3%; day 23 7.21 ± 1.7% (three independent experiments, P = 0.0665). Percentage of transfer was transformed into a logarithmic scale. P-values are deduced by comparing the slopes of the two cellular population in a logistic regression model as described in material and methods. Error bar = SD.
Figure 7.
Figure 7.. GSLC network.
GSLCs interconnect through different types of cellular extensions. TMs are thick (>1 µm) protrusions that can either contact other cells through GAP-junctions, allowing the propagation of calcium flux, or be individual finger-like extensions not connecting remote cells. They can be positive for GAP43 (rectangles along the membranes of TM), neuronal Growth-Associated Protein. GSLCs also interconnect through TNTs, thinner (<1 µm), open-ended connections which allow transfer of cellular cargos, such as mitochondria (ovals in TNTs).

Comment in

References

    1. Stupp R., Mason W.P., van den Bent M.J., Weller M., Fisher B., Taphoorn M.J.B., et al. (2005) Radiotherapy plus concomitant and adjuvant temozolomide for glioblastoma. N. Engl. J. Med. 352, 987–996 10.1056/NEJMoa043330 - DOI - PubMed
    1. Batash R., Asna N., Schaffer P., Francis N. and Schaffer M. (2017) Glioblastoma multiforme, diagnosis and treatment; recent literature review. Curr. Med. Chem. 24, 3002–3009 10.2174/0929867324666170516123206 - DOI - PubMed
    1. Lathia J.D., Mack S.C., Mulkearns-Hubert E.E., Valentim C.L.L. and Rich J.N. (2015) Cancer stem cells in glioblastoma. Genes Dev. 29, 1203–1217 10.1101/gad.261982.115 - DOI - PMC - PubMed
    1. Prager B.C., Bhargava S., Mahadev V., Hubert C.G. and Rich J.N. (2020) Glioblastoma stem cells: driving resilience through Chaos. Trends Cancer 6, 223–235 10.1016/j.trecan.2020.01.009 - DOI - PMC - PubMed
    1. Bao S., Wu Q., McLendon R.E., Hao Y., Shi Q., Hjelmeland A.B. et al. (2006) Glioma stem cells promote radioresistance by preferential activation of the DNA damage response. Nature 444, 756–760 10.1038/nature05236 - DOI - PubMed

Publication types

MeSH terms

Associated data