. 2021 Mar;44(3):729-746.
doi: 10.1111/pce.13962. Epub 2021 Jan 21.

Bioenergy sorghum maintains photosynthetic capacity in elevated ozone concentrations

Affiliations

Bioenergy sorghum maintains photosynthetic capacity in elevated ozone concentrations

Shuai Li et al. Plant Cell Environ. 2021 Mar.

Abstract

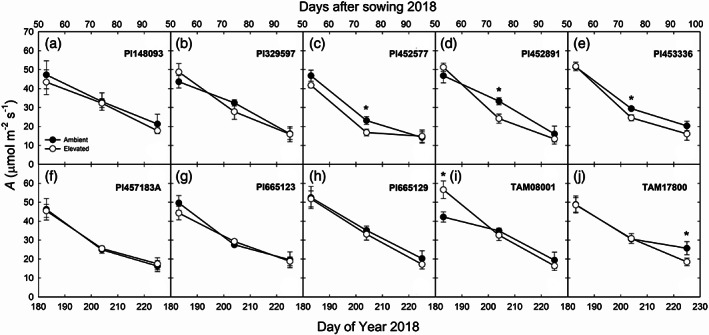
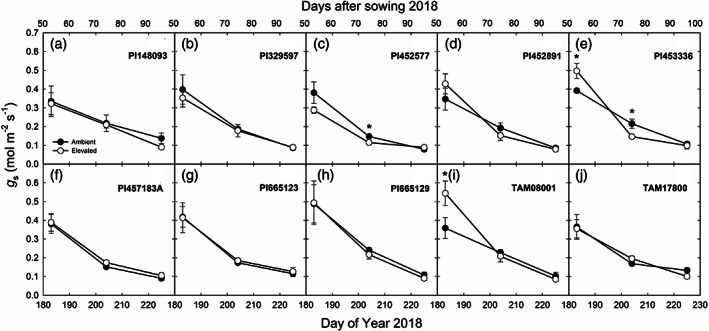
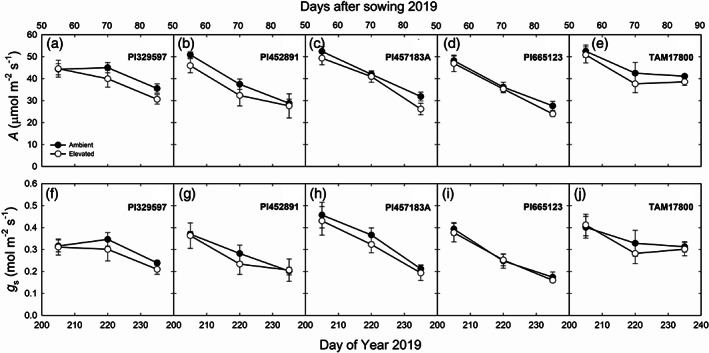
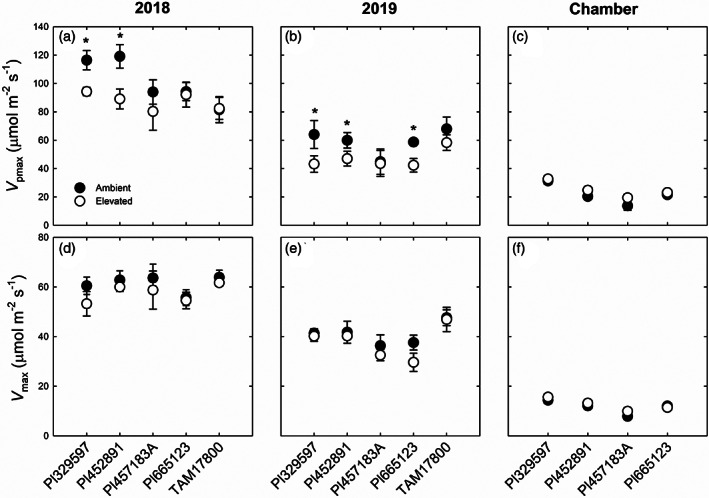
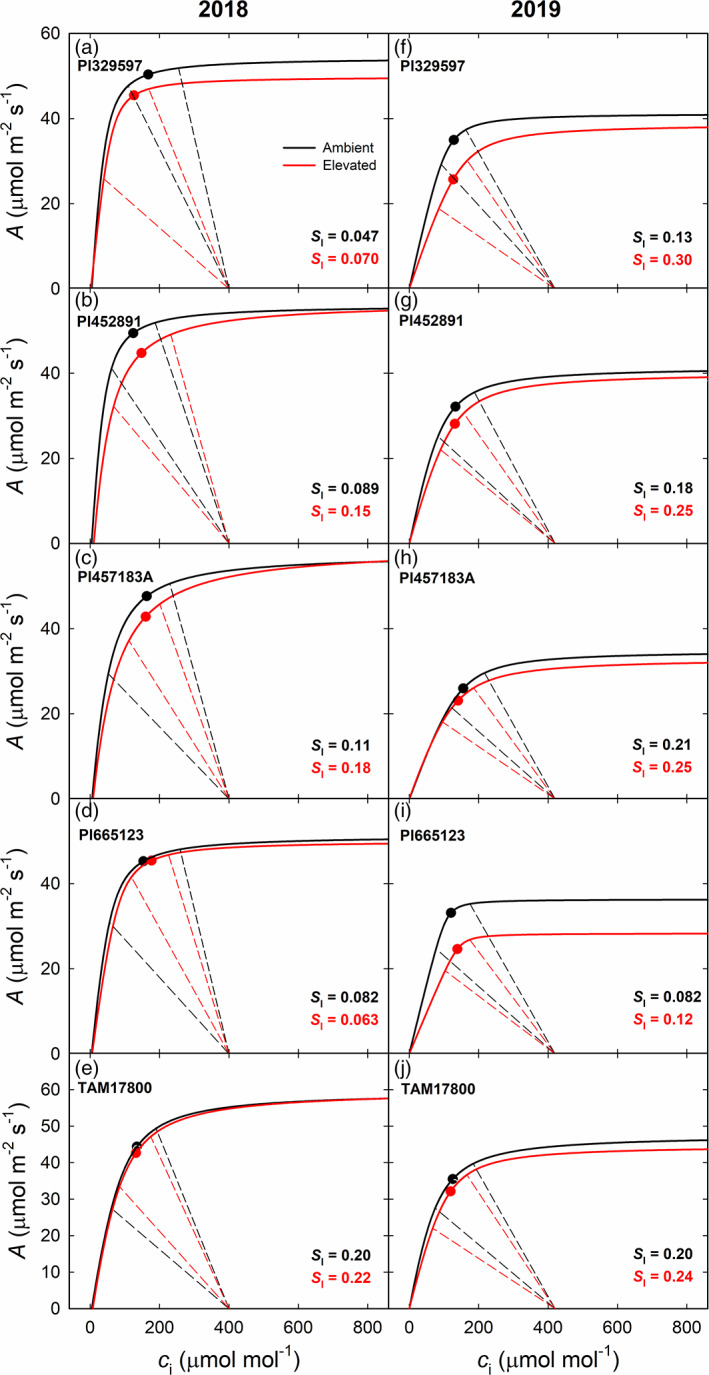
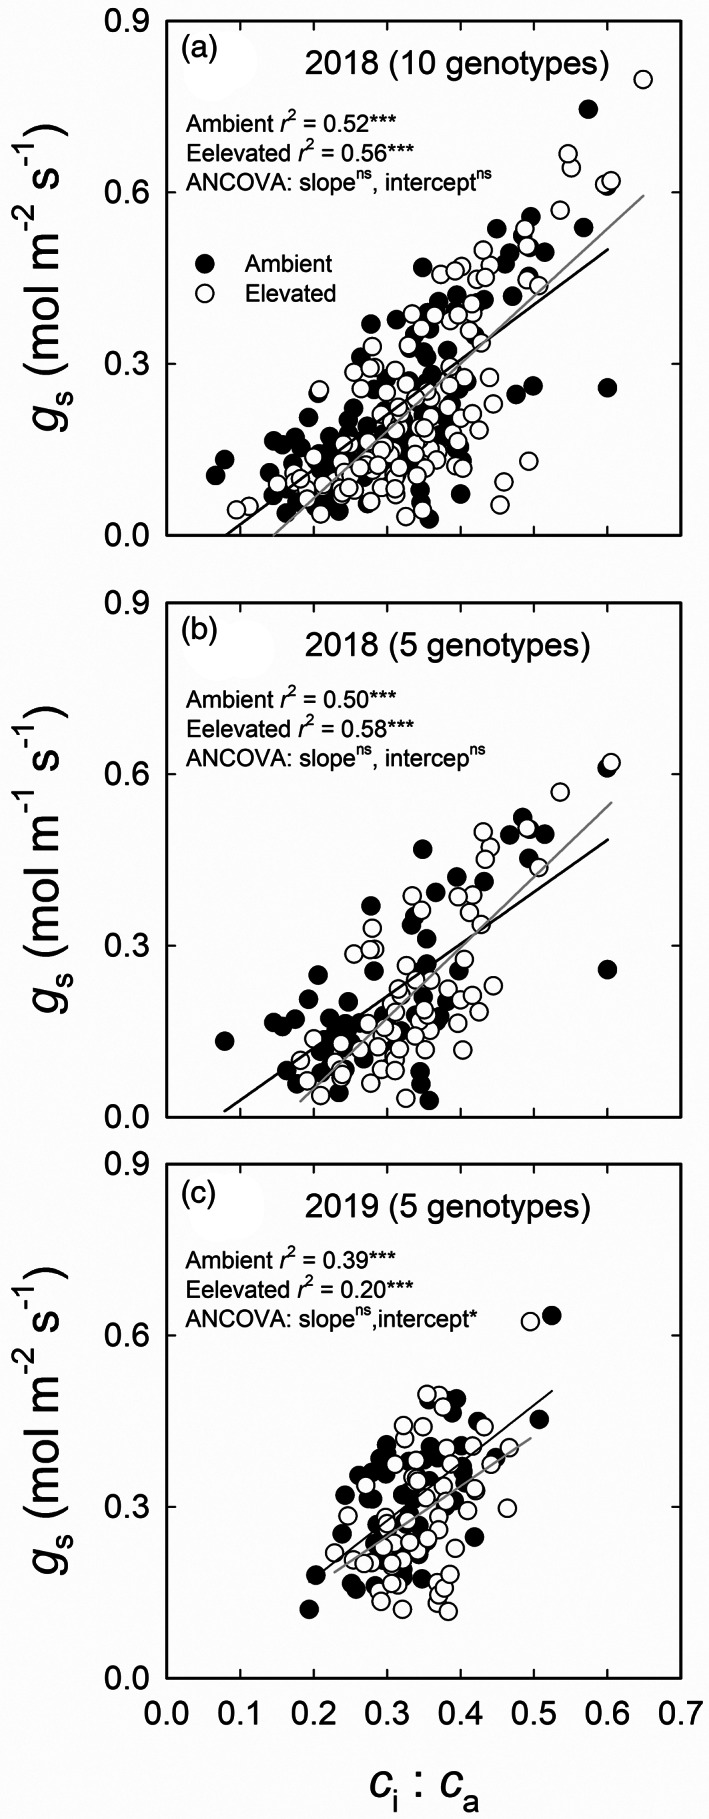
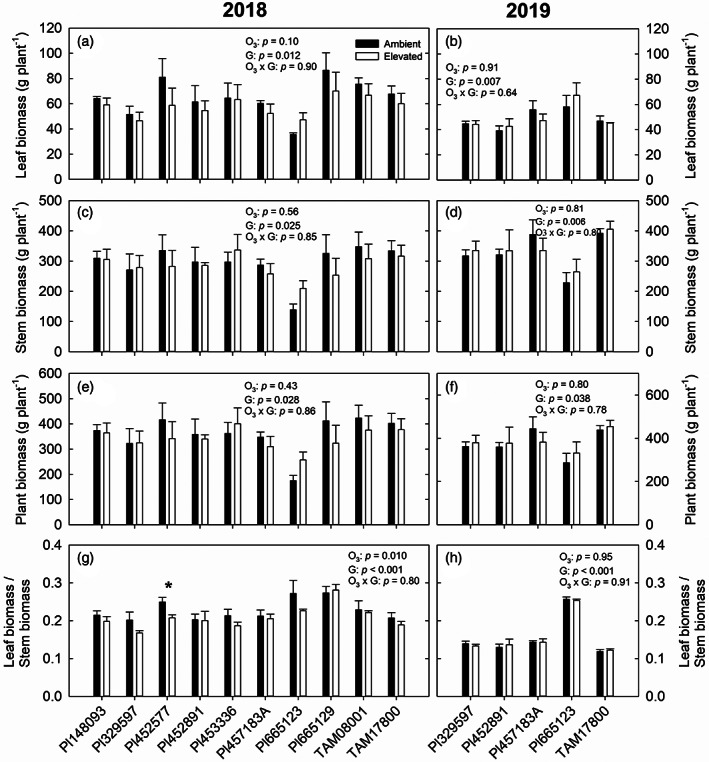
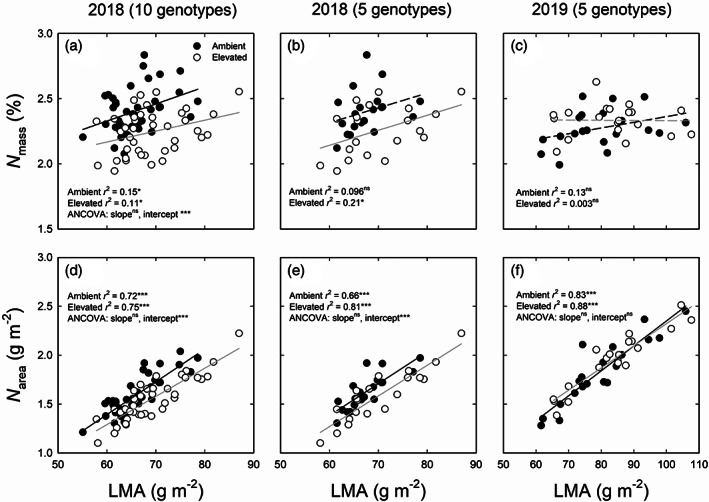
Elevated tropospheric ozone concentration (O3 ) significantly reduces photosynthesis and productivity in several C4 crops including maize, switchgrass and sugarcane. However, it is unknown how O3 affects plant growth, development and productivity in sorghum (Sorghum bicolor L.), an emerging C4 bioenergy crop. Here, we investigated the effects of elevated O3 on photosynthesis, biomass and nutrient composition of a number of sorghum genotypes over two seasons in the field using free-air concentration enrichment (FACE), and in growth chambers. We also tested if elevated O3 altered the relationship between stomatal conductance and environmental conditions using two common stomatal conductance models. Sorghum genotypes showed significant variability in plant functional traits, including photosynthetic capacity, leaf N content and specific leaf area, but responded similarly to O3 . At the FACE experiment, elevated O3 did not alter net CO2 assimilation (A), stomatal conductance (gs ), stomatal sensitivity to the environment, chlorophyll fluorescence and plant biomass, but led to reductions in the maximum carboxylation capacity of phosphoenolpyruvate and increased stomatal limitation to A in both years. These findings suggest that bioenergy sorghum is tolerant to O3 and could be used to enhance biomass productivity in O3 polluted regions.

Keywords: BWB model; MED model; biomass; chlorophyll fluorescence; photosynthesis; stomatal conductance.


Conflict of interest statement

The authors declare no conflicts of interest.

Figures

FIGURE 1
FIGURE 1
In situ midday net CO2 assimilation rate (A) measured in 10 genotypes of sorghum grown at ambient and elevated O3 on DOY 183, 204 and 225 in 2018. Error bars show SEs (n = 4). Significant differences (p < .05) between ambient and elevated O3 are indicated by asterisk
FIGURE 2
FIGURE 2
In situ midday stomatal conductance (g s) measured in 10 genotypes of sorghum grown at ambient and elevated O3 on DOY 183, 204 and 225 in 2018. Error bars show SEs (n = 4). Significant differences (p < .05) between ambient and elevated O3 are indicated by asterisk
FIGURE 3
FIGURE 3
In situ midday net CO2 assimilation rate (A; a–e) and stomatal conductance (g s; f–j) measured in five genotypes of sorghum grown at ambient and elevated O3 on DOY 205, 220 and 235 in 2019. Error bars show SEs (n = 4)
FIGURE 4
FIGURE 4
Maximum carboxylation capacity of PEPC (V pmax, a–c) and CO2‐saturated photosynthetic rate (V max, d–f) measured in five genotypes of sorghum grown at ambient and elevated O3 in 2018 (a,d) and 2019 (b,e), and in four genotypes of sorghum grown at ambient and elevated O3 in growth chamber (c,f). Error bars show SEs (n = 4). Significant differences (p < .05) between ambient and elevated O3 are indicated by asterisk
FIGURE 5
FIGURE 5
Summary of A/c i response curves (solid lines) and CO2 supply functions (dashed lines) for five genotypes of sorghum grown at ambient O3 (black lines) and elevated O3 (red lines) in 2018 (a‐e) and 2019 (f‐j). The dashed lines represent the observed maximum and minimum midday c i, and the points indicate the mean values (n = 4) of midday c i which was measured under CO2 concentration of 400 μmol mol−1 at time point A in 2018 and 420 μmol mol−1 at time point B in 2019. Stomatal limitation (S l) for each genotype under ambient and elevated O3 is reported in each panel. For all A/c i regressions, r 2 > 0.98 and p < .0001 [Colour figure can be viewed at wileyonlinelibrary.com]
FIGURE 6
FIGURE 6
The relationship between stomatal conductance (g s) and the ratio of leaf intercellular CO2 concentration to atmospheric CO2 concentration (c i:c a) in 10 genotypes (a) and 5 genotypes (b) of sorghum grown under ambient and elevated O3 measured on DOY 183, 204 and 225 in 2018 and in 5 genotypes (c) of sorghum grown under ambient and elevated O3 measured on DOY 205, 220 and 235 in 2019. The data were fitted by linear regressions. ns, no significant difference (p > .05); *p < .05; ***p < .001
FIGURE 7
FIGURE 7
Leaf biomass (a,b), stem biomass (c,d), plant biomass (e,f) and the ratio of leaf biomass to stem biomass (g,h) measured in sorghum genotypes grown at ambient and elevated O3 in 2018 (a,c,e,g) and 2019 (b,d,f,h). Error bars show SEs (n = 4). Significant differences (p < .05) between ambient and elevated O3 are indicated by asterisk
FIGURE 8
FIGURE 8
The relationship between leaf dry mass per area (LMA) and leaf nitrogen content expressed on a mass basis (LMA and N mass, a–c), and on an area basis (LMA and N area, d–f) in 10 genotypes (a,d) and 5 genotypes (b,e) of sorghum grown under ambient and elevated O3 measured in 2018 and in 5 genotypes (c,f) of sorghum grown under ambient and elevated O3 measured in 2019. The data were fitted by linear regressions. Significant correlations are indicated by solid lines. ns, no significant difference (p > .05); *p < .05; ***p < .001

References

    1. Ainsworth, E. A. (2017). Understanding and improving global crop response to ozone pollution. Plant Journal, 90, 886–897. - PubMed
    1. Ainsworth, E. A. , & Long, S. P. (2005). What have we learned from 15 years of free‐air CO2 enrichment (FACE)? A meta‐analytic review of the responses of photosynthesis, canopy properties and plant production to rising CO2 . New Phytologist, 165, 351–372. - PubMed
    1. Ainsworth, E. A. , Rogers, A. , & Leakey, A. D. B. (2008). Targets for crop biotechnology in a future high‐CO2 and high‐O3 world. Plant Physiology, 147, 13–19. - PMC - PubMed
    1. Ainsworth, E. A. , Rogers, A. , Nelson, R. , & Long, S. P. (2004). Testing the “source‐sink” hypothesis of down‐regulation of photosynthesis in elevated [CO2] in the field with single gene substitutions in Glycine max . Agricultural and Forest Meteorology, 122, 85–94.
    1. Ainsworth, E. A. , Yendrek, C. R. , Sitch, S. , Collins, W. J. , & Emberson, L. D. (2012). The effects of tropospheric ozone on net primary productivity and implications for climate change. Annual Review of Plant Biology, 63, 637–661. - PubMed

Publication types

LinkOut - more resources