

Redox activation of ATM enhances GSNOR translation to sustain mitophagy and tolerance to oxidative stress
- PMID: 33245190
- PMCID: PMC7788447
- DOI: 10.15252/embr.202050500
Redox activation of ATM enhances GSNOR translation to sustain mitophagy and tolerance to oxidative stress
Abstract
The denitrosylase S-nitrosoglutathione reductase (GSNOR) has been suggested to sustain mitochondrial removal by autophagy (mitophagy), functionally linking S-nitrosylation to cell senescence and aging. In this study, we provide evidence that GSNOR is induced at the translational level in response to hydrogen peroxide and mitochondrial ROS. The use of selective pharmacological inhibitors and siRNA demonstrates that GSNOR induction is an event downstream of the redox-mediated activation of ATM, which in turn phosphorylates and activates CHK2 and p53 as intermediate players of this signaling cascade. The modulation of ATM/GSNOR axis, or the expression of a redox-insensitive ATM mutant influences cell sensitivity to nitrosative and oxidative stress, impairs mitophagy and affects cell survival. Remarkably, this interplay modulates T-cell activation, supporting the conclusion that GSNOR is a key molecular effector of the antioxidant function of ATM and providing new clues to comprehend the pleiotropic effects of ATM in the context of immune function.
Keywords: ATM; GSNOR; ROS; T cell; mitophagy.
© 2020 The Authors. Published under the terms of the CC BY 4.0 license.
Conflict of interest statement
The authors declare that they have no conflict of interest.
Figures
- A
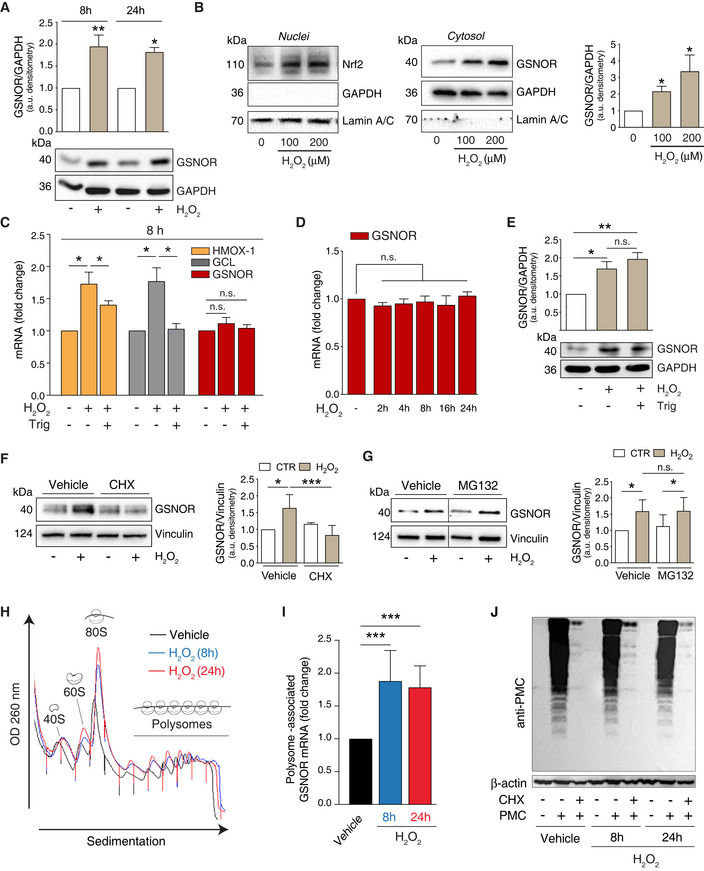
HEK293 cells were treated for 8 and 24 h with 100 μM H2O2. GSNOR was evaluated by Western blot. Densitometry of each lane is normalized to GADPH, selected as loading control, and expressed as arbitrary units. Values shown represent the means ± SD of n ≥ 3 independent experiments. *P < 0.05; **P < 0.01 calculated with regard to H2O2‐untreated cells.
- B
HEK293 cells were treated for 8 h with 100 or 200 μM H2O2. Nrf2 (left panel) and GSNOR (right panel) were evaluated by Western blot performed in nuclear and cytosol‐enriched fractions. GAPDH and Lamin A/C were used as loading and purity controls of cytosol and nuclei, respectively. Densitometry of GSNOR immunoreactive bands is normalized to GADPH and expressed as arbitrary units. Values shown represent the means ± SD of n = 3 independent experiments. *P < 0.05.
- C
HEK293 cells were treated for 8 h with 100 μM H2O2 in the presence or absence of the Nrf2 inhibitor trigonelline (Trig). Heme oxygenase 1 (HMOX‐1), glutamate:cysteine ligase (GCL), and GSNOR expressions were evaluated RT–qPCR analyses Results shown are the means ± SEM of n = 3 experiments run in triplicate. *P < 0.05; n.s., not significant.
- D
RT–qPCR analyses of GSNOR mRNA after 2‐ to 24‐h incubation with 100 μM H2O2. Results shown are the means ± SEM of n = 3 experiments run in triplicate, analyzed using ANOVA with Dunnett multiple comparisons test. n.s., not significant.
- E
Western blot analysis of GSNOR in HEK293 cells treated for 8 h with 100 μM H2O2 in the presence or absence of trigonelline (Trig). Densitometry of GSNOR immunoreactive bands is normalized to GADPH, selected as loading control, and expressed as arbitrary units. Values shown represent the means ± SD of n = 3 independent experiments. *P < 0.05; **P < 0.01.
- F, G
HEK293 cells were treated for 8 h with 100 μM H2O2 in the presence or absence of in the presence or absence of cycloheximide (CHX, F), or the proteasome inhibitor MG132 (G). GSNOR was evaluated by Western blot. Vertical dotted lines represent a virtual division of the nitrocellulose filter, as immunoreactive bands reported in figure – although part of the same experiment/gel – were not contiguous. Vehicle: PBS. Densitometry of GSNOR immunoreactive bands is normalized to Vinculin, selected as loading control, and expressed as arbitrary units. Values shown represent the means ± SD of n = 4 independent experiments. *P < 0.05; ***P < 0.001; n.s., not significant.
- H
HEK293 cells were treated for 8 h (blue) or 24 h (red) with 100 μM H2O2. Polysome profile showing monosomes and polysomes was obtained from control (Vehicle) and H2O2 treated lysates (for either 8 or 24 h) by separation on 5–50% sucrose linear density gradient and collection using a gradient fractionation system.
- I
RT–qPCR analyses of GSNOR mRNA in input and heavy polysome fraction pooled together in H2O2‐treated samples (for either 8 or 24 h). H3A mRNA expression level was used as housekeeping gene control. Results represent the means ± SD of n ≥ 6 independent experiments shown as % normalized by H3A. ***P < 0.001 Vehicle: PBS.
- J
HEK293 cells treated for 8 h or 24 h with 100 μM H2O2 in the presence or absence of puromycin (tyrosyl‐tRNA mimic used to label nascent proteins), or cycloheximide (CHX, used to block protein translation). Nascent polypeptides were assessed by Western blot performed with an anti‐puromycin (anti‐PMC) antibody. Vehicle: PBS. β‐actin was used as loading control.
- A
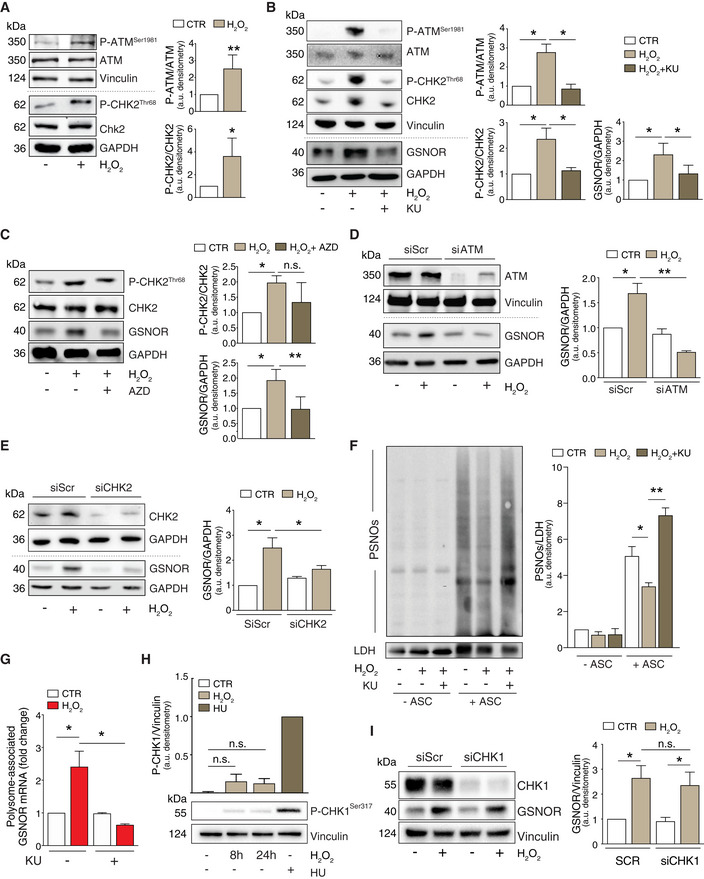
HEK293 cells treated for 24 h with 100 μM H2O2. Basal and phospho‐active forms of ATM and CHK2 were assessed by Western blot. Phospho:basal level ratios of ATM and CHK2 immunoreactive bands are normalized to Vinculin, selected as loading control, and expressed as arbitrary units. Values shown represent the means ± SD of n ≥ 4 independent experiments. *P < 0.05; **P < 0.01.
- B
HEK293 cells were treated for 24 h with 100 μM H2O2 in the presence or absence of the ATM inhibitor KU55933 (KU). Basal and phospho‐active forms of ATM, CHK2, and GSNOR were assessed by Western blot. Vinculin and GAPDH were used as loading controls. Phospho:basal level ratios of ATM and CHK2 (normalized to Vinculin) along with densitometry of GSNOR immunoreactive bands (normalized to GAPDH) are expressed as arbitrary units. Values shown represent the means ± SD of n = 3 independent experiments. *P < 0.05.
- C
HEK293 cells were treated for 24 h with 100 μM H2O2 in the presence or absence of the CHK2 inhibitor AZD7762 (AZD). Basal and phospho‐active forms of CHK2, together with GSNOR, were assesses by Western blot. Phospho:basal level ratios of CHK2 and densitometry of GSNOR immunoreactive bands are normalized to GAPDH, selected as loading control, and expressed as arbitrary units. Values shown represent the means ± SD of n = 3 independent experiments. *P < 0.05; **P < 0.01; n.s., not significant.
- D
HEK293 cells were transfected with a pool of siRNA against ATM (siATM) or with control siRNA (siScr) for 18 h and treated for additional 24 h with 100 μM H2O2. Basal and phospho‐active forms of ATM, together with GSNOR were assessed by Western blot. Vinculin and GAPDH were used as loading controls. Densitometry of GSNOR immunoreactive bands is normalized to GAPDH and expressed as arbitrary units. Values shown represent the means ± SD of n = 3 independent experiments. *P < 0.05; **P < 0.01.
- E
HEK293 cells were transfected with a pool of siRNA against CHK2 (siCHK2) or with control siRNA (siScr) for 18 h and treated for additional 24 h with 100 μM H2O2. Basal and phospho‐active forms of CHK2, together with GSNOR, were assessed by Western blot. GAPDH was used as loading control. Densitometry of GSNOR immunoreactive bands is normalized to GAPDH and expressed as arbitrary units. Values shown represent the means ± SD of n = 3 independent experiments. *P < 0.05.
- F
HEK293 cells were treated for 24 h with 100 μM H2O2 in the presence or absence of the ATM inhibitor KU55933 (KU). Lysates were subjected to biotin‐switch assay, and S‐nitrosylated proteins (PSNOs) revealed by incubation with horseradish peroxidase (HRP)‐conjugated streptavidin. Results obtained in the absence of ascorbate (‐ ASC) are shown as negative controls. Densitometry of each lane intensity is normalized to LDH, selected as loading control, and expressed as arbitrary units. Values shown represent the means ± SD of n = 3 independent experiments. *P < 0.05; **P < 0.01.
- G
RT–qPCR analyses of GSNOR mRNA in input and heavy polysome fraction pooled together in H2O2‐treated samples in the absence or in the presence of the ATM inhibitor KU55933 (KU). H3A mRNA expression level was used as housekeeping gene control. Results are the means ± SEM of n = 3 independent experiments run in duplicate and shown as %, normalized by H3A. *P < 0.05.
- H
HEK293 cells were treated for 8 or 24 h with 100 μM H2O2 or, alternatively, for 2 h with 2 mM hydroxyurea (HU), selected as positive control of CHK1 phosphorylation at Ser317. Phospho‐CHK1Ser317 was assessed by Western blot; densitometry normalized to Vinculin, selected as loading control, and expressed as arbitrary units (with HU arbitrarily set to 1). Values shown represent the means ± SD of n = 3 independent experiments. n.s., not significant.
- I
HEK293 cells were transfected with a pool of siRNA against CHK1 (siCHK1) or with control siRNA (siScr) for 18 h and treated for additional 24 h with 100 μM H2O2. CHK1 and GSNOR were assessed by Western blot analysis of. Densitometry of GSNOR immunoreactive bands is normalized to Vinculin, selected as loading control, and expressed as arbitrary units. Values shown represent the means ± SD of n = 3 independent experiments. *P < 0.05.
- A
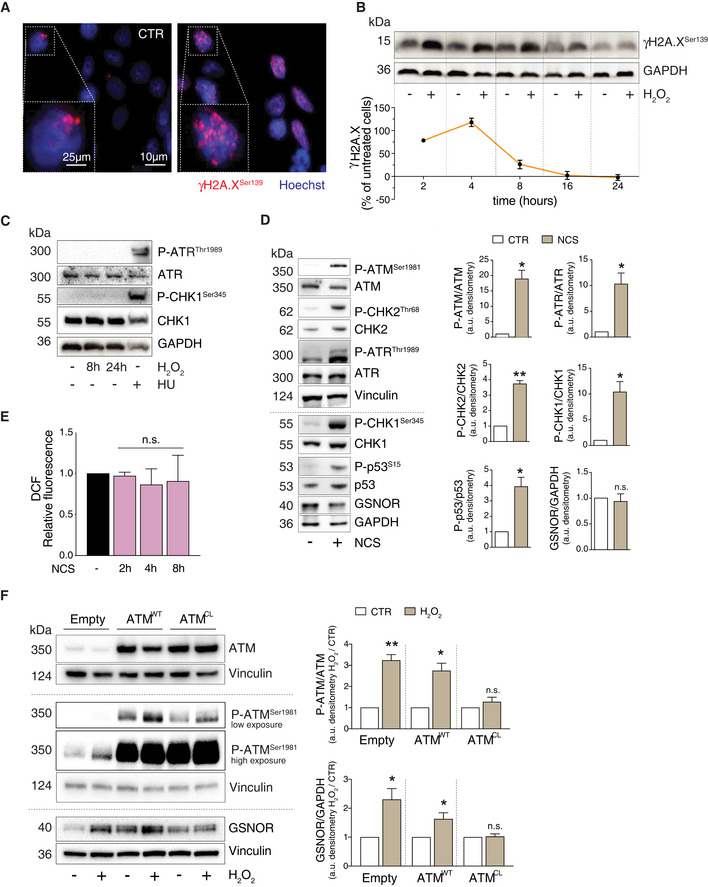
HEK293 cells treated for 4 h with 100 μM H2O2. Phospho‐histone H2A.X (γH2A.X) was assessed by immunofluorescence analysis. Nuclei (blue) were stained with Hoechst 33342. Scale bar: 10 μM. 4X digital magnification is shown at the bottom left of each image. CTR: H2O2‐untreated cells.
- B
Additionally, γH2A.X was also assessed by Western blot at the indicated time points. GAPDH was used as loading control (top panel). Densitometry of each lane intensity is normalized to GAPDH, selected as loading control, and expressed as % of γH2A.X in H2O2‐treated versus untreated cells. Values represent the means ± SD of two independent experiments (bottom panel).
- C
HEK293 cells were treated for 8 or 24 h with 100 μM H2O2 or, alternatively, for 2 h with 2 mM hydroxyurea (HU), selected as positive control of ATR/CHK1 axis activation. Basal and phospho‐active forms of ATR and CHK1 (at Ser345) were assessed by Western blot. GAPDH was used as loading control.
- D
HEK293 cells were treated for 8 h with 20 μM neocarzinostatin (NCS). (left) Western blot analysis of basal and phospho‐active forms of ATM, CHK2, ATR, CHK1, p53, and GSNOR in HEK293 cells treated for 8 h with 20 μM neocarzinostatin (NCS). Vinculin and GAPDH were used as loading controls. (right) Phospho:basal level ratios of ATM, CHK2, ATR, and CHK1, along with densitometry of GSNOR immunoreactive bands are expressed as arbitrary units. Values shown represent the means ± SD of n = 3 independent experiments. *P < 0.05; **P < 0.01; n.s., not significant.
- E
HEK293 cells were treated for 2, 4 and 8 h with 20 μM neocarzinostatin (NCS). After treatment, cells were incubated with 2’,7’‐H2DCF‐DA to cytofluorometrically assess the intracellular production of H2O2. Values are shown as units of DCF fluorescence relative to untreated cells. Values are shown as units of fluorescence relative to NCS‐untreated cells (arbitrarily set as 1) and represent the means ± SD of n = 3 independent experiments. n.s., not significant.
- F
HEK293 cells were transfected with plasmids coding for the wild‐type (WT), C2991L redox mutant (CL) of ATM, or with an empty vector (Empty; used as negative control) for 40 h and treated for additional 8 h with 100 μM H2O2. Basal and phospho‐active forms of ATM and GSNOR were assessed by Western blot analysis. Vinculin and GAPDH were used as loading controls. Two different exposures (low and high) were selected to highlight differences in P‐ATM levels in different experimental settings. Phospho:basal level ratios of ATM, along with densitometry of GSNOR immunoreactive bands are expressed as arbitrary units relative untreated cells. Values shown represent the means ± SD of n = 3 independent experiments. *P < 0.05; **P < 0.01; n.s., not significant.
- A
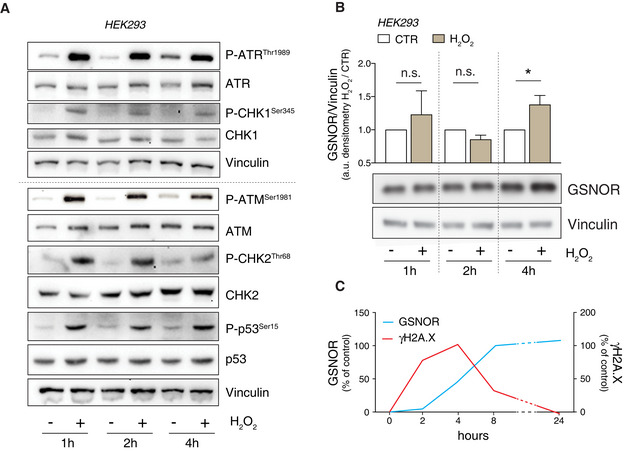
HEK293 cells were treated for 1, 2 and 4 h with 100 μM H2O2. Vinculin was used as loading control. Basal and phospho‐active forms of ATM, CHK2, ATR, CHK1, and p53 were assessed by Western blot.
- B
Western blot analysis performed in the same experimental setting described in panel A. Vinculin was used as loading control. Densitometry of GSNOR immunoreactive bands is normalized to Vinculin and expressed as arbitrary units. Values shown are the means ± SD of n = 3 different experiments. *P < 0.05; n.s., not significant.
- C
Integrated time‐dependent profiles of GSNOR (extracted from combining data of Figs EV1B and 1A) and phospho‐histone H2A.X (extracted from Fig 2B) were evaluated in HEK293 cells treated with 100 μM H2O2. Data are expressed as % of control (untreated cells).
- A
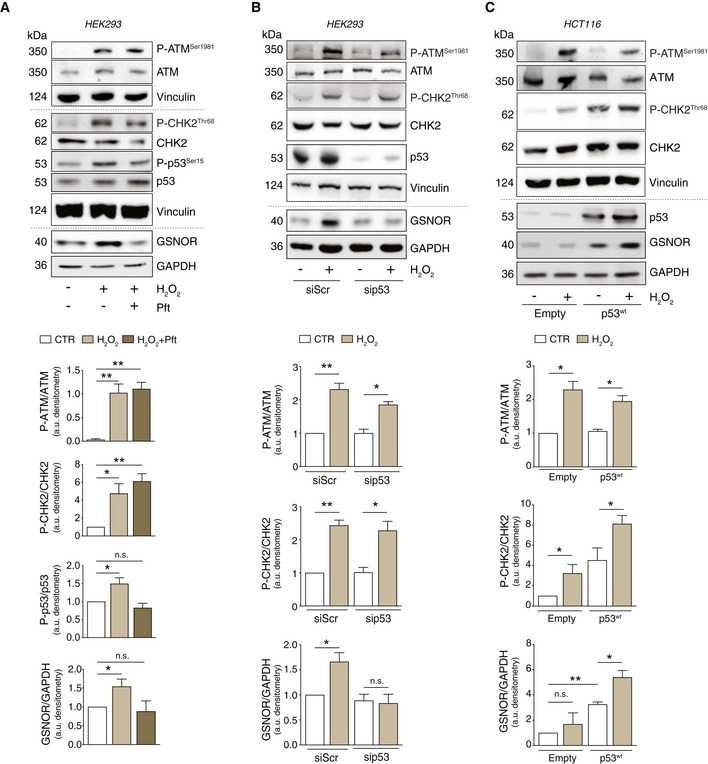
HEK293 cells were treated for 24 h with 100 μM H2O2 in the presence or absence of 20 μM pifithrin‐α (Pft). Basal and phospho‐active forms of ATM, CHK2, p53, and GSNOR were assessed by Western blot. Phospho:basal level ratios of ATM, CHK2, and p53 (normalized to Vinculin), along with densitometry of GSNOR immunoreactive bands (normalized to GAPDH) are expressed as arbitrary units. Values shown represent the means ± SD of n = 3 independent experiments. *P < 0.05; **P < 0.01; n.s., not significant.
- B
HEK293 cells were transfected with a pool of siRNA against p53 (sip53) or with control siRNA (siScr) for 24 h and treated for additional 24 h with 100 μM H2O2. Basal and phospho‐active forms of ATM and CHK2, as well as p53 and GSNOR, were assessed by Western blot. Phospho:basal level ratios of ATM and CHK2 (normalized to Vinculin), along with densitometry of GSNOR immunoreactive bands (normalized to GAPDH) are expressed as arbitrary units. Values shown represent the means ± SD of n = 3 independent experiments. *P < 0.05; **P < 0.01; n.s., not significant.
- C
HCT116 cells expressing the wild‐type form of p53 (p53wt), or an empty vector (Empty, selected as negative control), were treated for 24 h with 100 μM H2O2. Basal and phospho‐active forms of ATM and CHK2, p53, and GSNOR were assessed by Western blot. Vinculin and GAPDH were used as loading controls. Phospho:basal level ratios of ATM and CHK2, along with densitometry of p53 and GSNOR immunoreactive bands are expressed as arbitrary units. Values shown represent the means ± SD of n = 3 independent experiments. *P < 0.05; **P < 0.01; n.s., not significant.
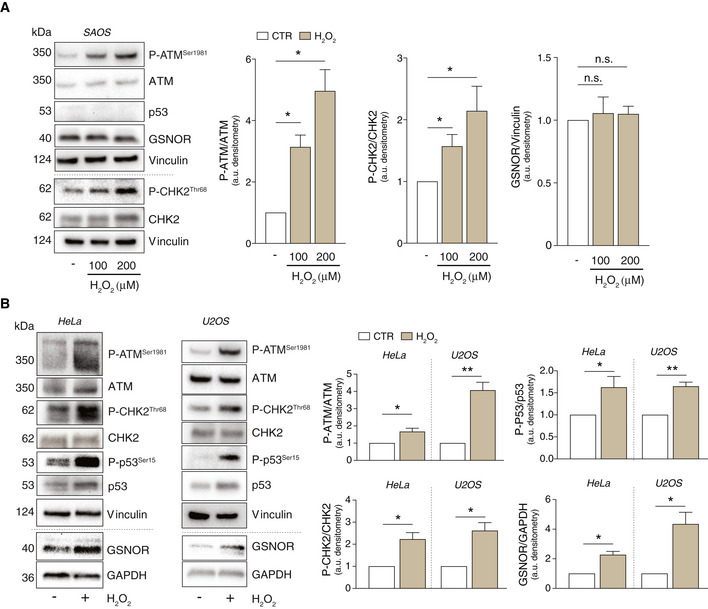
- A, B
SAOS (A), HeLa, and U2OS cells (B) were treated for 24 h with 100 or 200 μM H2O2. Basal and phospho‐active forms of ATM, CHK2, and p53 and GSNOR were assessed by Western blot. Phospho:basal level ratios of ATM, CHK2 and p53 (normalized to Vinculin), along with densitometry of GSNOR immunoreactive bands (normalized to GAPDH), are expressed as arbitrary units. Values shown represent the means ± SD of n = 3 different experiments. *P < 0.05; **P < 0.01; n.s., not significant.
- A, B
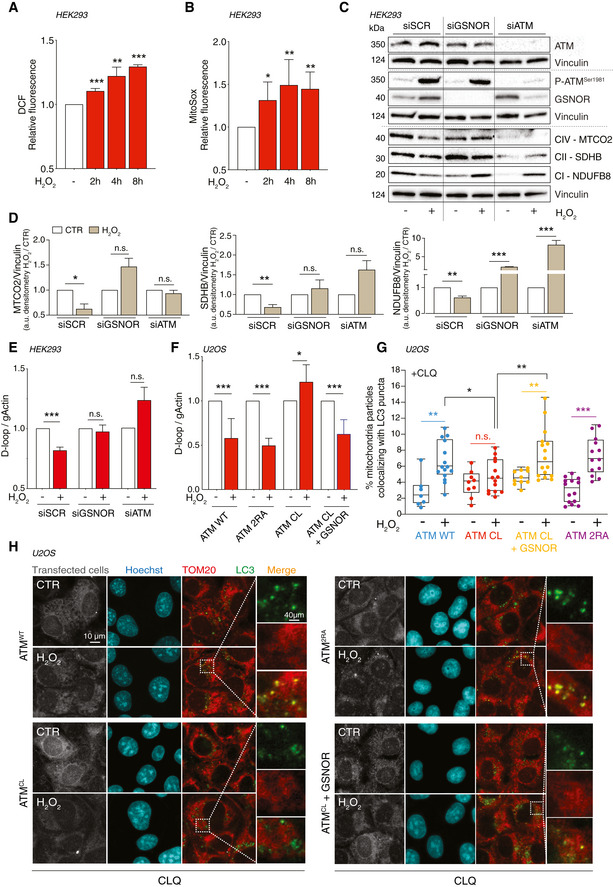
HEK293 cells treated for 2, 4, and 8 h with 100 μM H2O2. After treatment, cells were incubated with 5 μM 2’,7’‐H2DCF‐DA (A) or MitoSox (B) to evaluate the production of H2O2 or mitochondrial superoxide, respectively. Values are shown as units of DCF or MitoSox fluorescence relative to untreated cells (arbitrarily set as 1) and represent the means ± SD of n ≥ 3 independent experiments. *P < 0.05; **P < 0.01; ***P < 0.001.
- C
HEK293 was transfected for 48 h with siRNA against ATM (siATM), GSNOR (siGSNOR), or control siRNA (scramble, siScr). Afterward, they were treated for 8 h with 100 μM H2O2 and mitophagy was assessed by Western blot of different mitochondrial complex subunits [i.e., NDUFB8 (complex I), SDHB (complex II), and MTCO2 (complex IV)]. Basal and phospho‐ATM and GSNOR were used to check the efficiency of siRNA‐mediated knockdown. Vinculin was used as loading control.
- D
Densitometry of mitochondrial protein immunoreactive bands of panel C (normalized to Vinculin) is indicated as H2O2‐treated versus untreated cells (CTR) and expressed as arbitrary units. Values shown represent the means ± SD of n = 3 independent experiments. *P < 0.05; **P < 0.01; ***P < 0.001; n.s., not significant.
- E
In the same experimental settings, mitophagy was also assessed by RT–qPCR relative quantitation of D‐loop (selected as measure of mtDNA) normalized to genomic actin (gActin). Results shown are the means ± SD of n = 8 experiments ***P < 0.001; n.s., not significant.
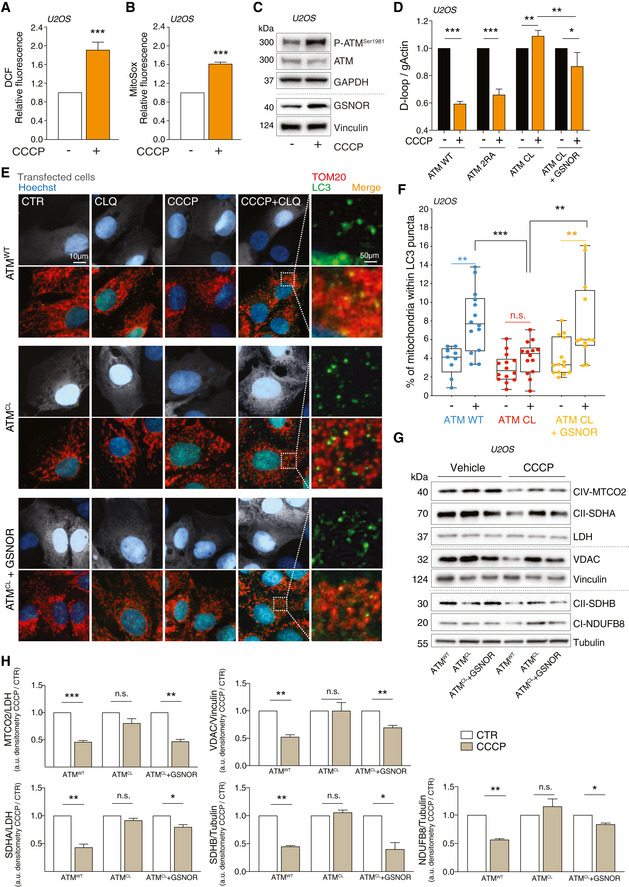
- F
U2OS cells were depleted of endogenous ATM by repeated transfections with shRNA and induced, by doxycycline incubation, to express ATMWT, ATM2RA, or ATMCL mutant. Where indicated, cells were further transfected with a GSNOR‐coding vector and then treated for 4 h with 100 μM H2O2. Mitophagy was assessed by RT–qPCR relative quantitation of D‐loop normalized to genomic actin (gActin). Results shown are the means ± SD of n = 6 experiments. *P < 0.05; ***P < 0.001.
- G, H
In the same experimental settings, mitophagy was also assessed at 8 h by fluorescence microscopy analyses upon incubation with chloroquine (CLQ) to enhance differences in mitophagy. Anti‐TOM20 (red) was used to visualize mitochondria; anti‐LC3 (green) was used to identify autophagosomes. Percentage of mitochondria merging with LC3‐positive puncta calculated by Fiji analysis software using the open‐source plugin ComDet v. 0.3.7. Values are expressed as % of mitochondria (TOM20+ particles) co‐localizing with LC3/cell and graphed as boxes (25th‐75th interquartile range) and whiskers (minimum to maximum showing all points), with central bands representing the median of n ≥ 7 different cells analyzed. *P < 0.05; **P < 0.01; ***P < 0.001.
- A–D
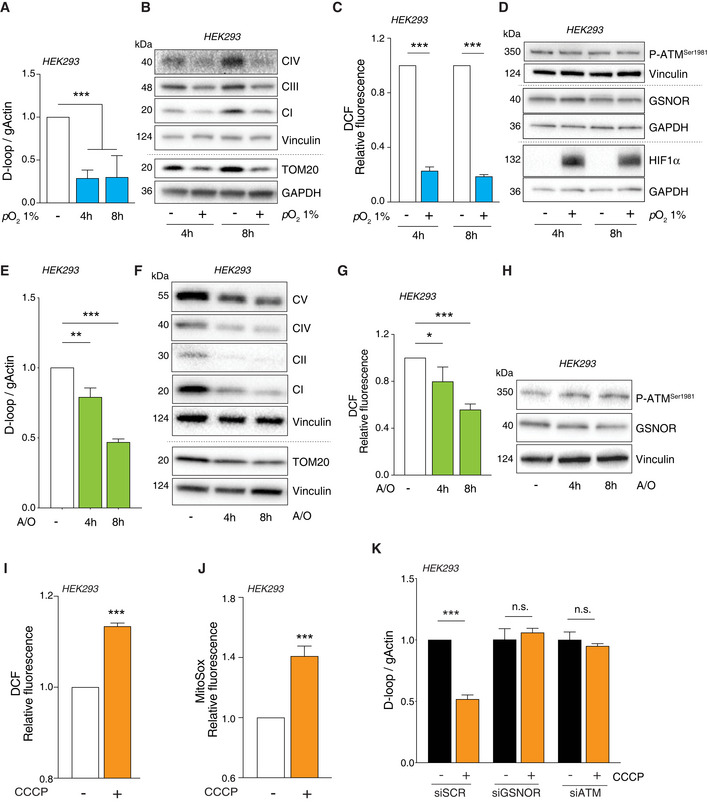
HEK293 cells were subjected to hypoxia (i.e., pO2 = 1%) for 4 and 8 h. (A) Mitophagy was assayed by RT–qPCR relative quantitation of D‐loop (selected as measure of mtDNA). Results shown are the means ± SD of n = 6 independent experiments. ***P < 0.001 calculated with respect to cells kept in normoxic conditions. (B) Mitophagy was also evaluated by Western blot of TOM20 and different mitochondrial complex subunits, i.e., NDUFB8 (CI), SDHB (CII), and MTCO2 (complex IV). Vinculin and GAPDH were used as loading controls. (C) After treatment, cells were incubated with 2’,7’‐H2DCF‐DA to cytofluorometrically assess the intracellular production of H2O2. Values are shown as units of DCF fluorescence relative to cells maintained in normoxic conditions (arbitrarily set as 1) and represent the means ± SD of n = 3 independent experiments. ***P < 0.001. (D) Western blot analysis of phospho‐ATM and GSNOR. HIF1α was selected as marker of hypoxia. Vinculin and GAPDH were used as loading controls.
- E–H
HEK293 cells were treated for 4 and 8 h with 1 μM of a combination of oligomycin and antimycin. Mitophagy was evaluated by (E) D‐loop quantitation as described in panel A. Results shown represent the means ± SD of n = 3 independent experiments. **P < 0.01 and ***P < 0.001 with respect to untreated cells. (F) Western blot of different mitochondrial proteins (as in panel B). Vinculin was used as loading control. (G) H2O2 production was evaluated cytofluorometrically as described in panel C. Results shown represent the means ± SD of n = 3 independent experiments. *P < 0.05; ***P < 0.01 with respect to untreated cells. (H) Western blot analysis of phospho‐ATM and GSNOR. Vinculin and GAPDH was used as loading control.
- I–K
HEK293 cells were treated for 8 h with 10 μM CCCP. After treatment, cells were incubated with 5 μM 2’,7’‐H2DCF‐DA (I) or MitoSox (J) to evaluate the production of H2O2 or mitochondrial superoxide, respectively. Values are shown as units of DCF or MitoSox fluorescence relative to untreated cells (arbitrarily set as 1) and represent the means ± SEM (I) or SD (J) of n = 3 independent experiments. ***P < 0.001 with respect to untreated cells. (K) Before CCCP treatment, cells were transfected for 48 h with siRNA against ATM (siATM), GSNOR (siGSNOR), or control siRNA (scramble, siScr). Mitophagy was assessed by RT–qPCR relative quantitation of D‐loop. Results shown are the means ± SD of n = 3 experiments run in triplicate. ***P < 0.001; n.s., not significant, calculated with regard to untreated cells.
- A, B
ATMWT U2OS cells were treated with 10 μM CCCP for 8 h. After treatment, cells were incubated with 5 μM 2’,7’‐H2DCF‐DA (A) or MitoSox (B) to evaluate the production of H2O2 or mitochondrial superoxide, respectively. Values are shown as units of DCF or MitoSox fluorescence relative to untreated cells (arbitrarily set as 1) and represent the means ± SD of n = 3 independent experiments. ***P < 0.001.
- C
In the same experimental settings, basal and phospho‐active forms of ATM and GSNOR were assessed by Western blot. Vinculin and GAPDH were used as loading controls.
- D–H
U2OS cells were depleted of endogenous ATM by repeated transfections with shRNA and induced, by doxycycline incubation, to express ATMWT, ATM2RA, or ATMCL mutant. Where indicated, cells were further transfected with a GSNOR‐coding vector and then treated for 2 h with 10 μM CCCP. Mitophagy was evaluated by: (D) RT–qPCR relative quantitation of D‐loop normalized to genomic actin (gActin). Results shown are the means ± SD of n = 4 experiments. *P < 0.05; **P < 0.01; ***P < 0.001. (E, F) fluorescence microscopy analyses upon incubation with chloroquine (CLQ) to enhance differences in mitophagy. Anti‐TOM20 (red) was used to visualize mitochondria; anti‐LC3 (green) was used to identify autophagosomes. Percentage of mitochondria merging with LC3‐positive puncta calculated by Fiji analysis software using the open‐source plugin ComDet v. 0.3.7. Values are expressed as % of mitochondria (TOM20+ particles) co‐localizing with LC3/cell and graphed as boxes (25th‐75th interquartile range) and whiskers (minimum to maximum showing all points), with central bands representing the median of n ≥ 9 different cells. **P < 0.01; ***P < 0.001; n.s., not significant. (G, H) Western blot of different subunits of mitochondrial proteins, i.e., NDUFB8 (complex I), SDHA and SDHB (complex II), MTCO2 (complex IV) and voltage‐dependent anion channel (VDAC). Tubulin, LDH and Vinculin were used as loading controls. Densitometry of mitochondrial protein immunoreactive bands and expressed as arbitrary units. Values shown represent the means ± SD of n = 3 independent experiments. *P < 0.05; **P < 0.01; ***P < 0.001; n.s., not significant.
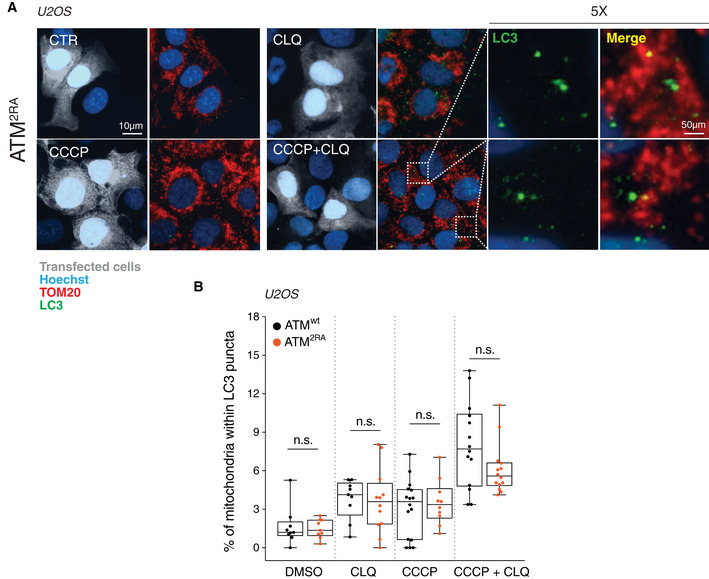
- A
ATM2RA U2OS cells were treated for 8 h with 1 μM CCCP and incubated with chloroquine (CLQ) to enhance differences in mitophagy. Anti‐TOM20 (red) was used to visualize mitochondria; anti‐LC3 (green) was used to identify autophagosomes.
- B
Percentage of mitochondria merging with LC3‐positive puncta calculated by Fiji analysis software using the open‐source plugin ComDet v. 0.3.7. Values are expressed as % of mitochondria (TOM20+ particles) co‐localizing with LC3/cell and graphed as boxes (25th–75th interquartile range) and whiskers (minimum to maximum showing all points), with central bands representing the median of n ≥ 9 different cells. n.s., not significant.
- A
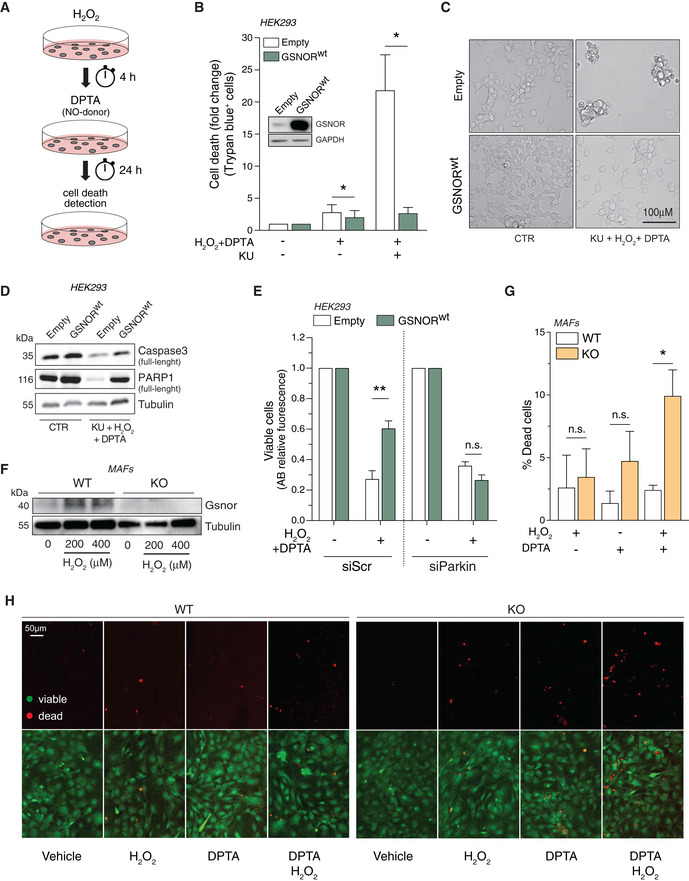
Scheme of the protocol designed for the combined treatment of HEK293 cells with H2O2 and DPTA.
- B
HEK293 cells overexpressing the wild‐type form of GSNOR (GSNORwt) or an empty vector (Empty) were subjected to combined treatment (200 μM H2O2 + 400 μM DPTA) in the presence or absence of the ATM inhibitor KU55933 (KU). Analysis of dead cells was performed with Trypan blue exclusion assay. Western blot analysis of GSNOR is shown as inset in the graph to substantiate transfection efficiency. Data, shown as fold change of dead cells relative to untreated cells (arbitrarily set to 1), represent the mean count ± SEM of n = 4 experiments done in duplicate *P < 0.05; with respect to Empty cells.
- C
Representative optic microscopy image of GSNORwt and empty cells upon 24‐h treatment with H2O2 + DPTA in the presence KU.
- D
Western blot analysis of caspase3 and PARP1 in GSNORwt and empty cells treated as in panel C. Tubulin was used as loading control.
- E
HEK293 cells overexpressing the wild‐type form of GSNOR (GSNORwt) or an empty vector (Empty) were transfected with siRNA against Pakin (siParkin) or control siRNA (scramble, siScr). Afterward, they were subjected to combined treatment (200 μM H2O2 + 400 μM DPTA) and viability assessed by Alamar blue (AB) fluorescent assay. Data, shown as fold change of viable cells, refer to AB fluorescence (relative to untreated cells, arbitrarily set to 1) and represent the means ± SD of n = 6 independent experiments. **P < 0.01; n.s., not significant.
- F
Western blot of Gsnor was assessed in mouse adult fibroblasts (MAFs), obtained from wild‐type (WT) and Gsnor‐null (KO) mice treated with 200 or 400 μM H2O2 for 24 h.
- G, H
WT and Gsnor‐null MAFs were subjected to treatment with 200 μM H2O2, or 400 μM DPTA, or a combination of both. Cell viability was evaluated by LIVE/DEAD assay. Scale bar = 50 µm. Data, shown as % of dead (red) cells, represent the mean count ± SD of n = 3 different fields of three independent experiments. *P < 0.05; n.s., not significant with respect to WT MAFs.
- A, B
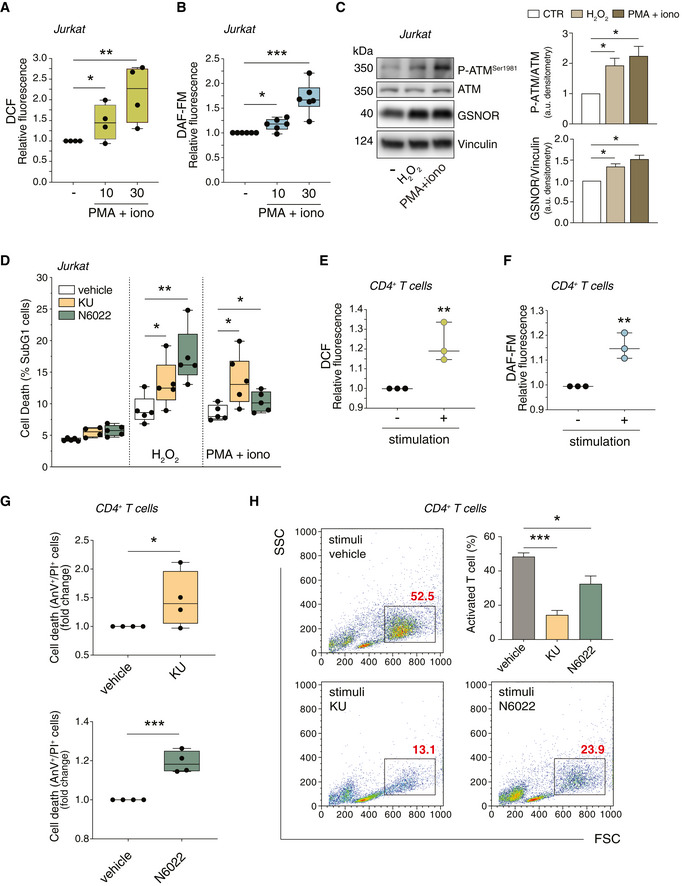
Jurkat cells were treated for 10 and 30 min with PMA (200 ng/ml) and ionomycin (iono; 300 ng/ml). After treatment, cells were incubated with 5 μM 2’,7’‐H2DCF‐DA (A) or DAF‐FM‐DA (B) to evaluate the production of H2O2 or NO, respectively. Values are expressed as units of DCF or DAF‐FM fluorescence relative to untreated cells (arbitrarily set as 1) and graphed as boxes (25th‐75th interquartile range) and whiskers (minimum to maximum showing all points), with central bands representing the median of n = 4 (A) and n = 6 (B) independent experiments. *P < 0.01; **P < 0.001; ***P < 0.001.
- C
(left) Jurkat cells were treated for 24 h with H2O2 (50 μM) or PMA/ionomycin (200 + 300 ng/ml). Basal and phospho‐active form of ATM, and GSNOR were assessed by Western blot. Vinculin was used as loading control. (right) Phospho:basal level ratios of ATM along with densitometry of GSNOR immunoreactive bands are expressed as arbitrary units. Values shown represent the means ± SD of n = 3 independent experiments. *P < 0.05.
- D
Jurkat cells were treated for 24 h with H2O2 (50 μM) or PMA/ionomycin (200 + 300 ng/ml), in the presence or absence of ATM inhibitor (KU55933; 5 μM) or GSNOR inhibitor (N6022; 25 μM). Cell death was assessed cytofluorimetrically upon staining with propidium iodide (PI). Values are expressed as % of sub‐G1 population of PI‐stained cells and graphed as boxes (25th‐75th interquartile range) and whiskers (minimum to maximum showing all points), with central bands representing the median of n = 5 independent experiments. *P < 0.05; **P < 0.01.
- E, F
CD4+ T cells were incubated for 30 min with anti‐CD3, anti‐CD28 and anti‐CD49d (stimulation). After stimulation, cells were incubated with 5 μM 2’,7’‐H2DCF‐DA (E) or DAF‐FM‐DA (F) to fluorometrically evaluate the production of H2O2 or NO, respectively. Values are shown as units of DCF or DAF‐FM fluorescence relative to non‐stimulated cells (arbitrarily set as 1). Values are shown as fold change and represent the median plus range with all the experimental points of n = 3 independent experiments. **P < 0.01.
- G
CD4+ T cells were stimulated for 96 h with anti‐CD3, anti‐CD28 and anti‐CD49d in the presence or absence of ATM inhibitor (KU, upper panel) or GSNOR inhibitor (N6022, bottom panel). Cell death was assessed cytofluorometrically upon staining with Annexin V (AnV) and PI. Values are expressed as fold change of AnV+/PI+ cells relative to control (CD4+ without inhibitor, vehicle, arbitrarily set to 1) and graphed as boxes (25th‐75th interquartile range) and whiskers (minimum to maximum showing all points), with central bands representing the median of n = 4 independent experiments. *P < 0.05; ***P < 0.001.
- H
In the same experimental settings, populations of stimulated (proliferating) CD4+ T cells were identified cytofluorometrically and included in rectangles. Values (as % of total population) are shown in red in each representative plot identify and summed up in a graph as the means ± SD of n = 3 independent experiments. *P < 0.05; ***P < 0.001.
References
-
- Balaban RS, Nemoto S, Finkel T (2005) Mitochondria, oxidants, and aging. Cell 120: 483–495 - PubMed
-
- Barzilai A, Rotman G, Shiloh Y (2002) ATM deficiency and oxidative stress: a new dimension of defective response to DNA damage. DNA Repair (Amst) 1: 3–25 - PubMed
-
- Bogdan C (2015) Nitric oxide synthase in innate and adaptive immunity: an update. Trends Immunol 36: 161–178 - PubMed
Publication types
MeSH terms
Substances
Grants and funding
LinkOut - more resources
Full Text Sources
Molecular Biology Databases
Research Materials
Miscellaneous
