

Immune-related gene data-based molecular subtyping related to the prognosis of breast cancer patients
- PMID: 33245478
- PMCID: PMC7925489
- DOI: 10.1007/s12282-020-01191-z
Immune-related gene data-based molecular subtyping related to the prognosis of breast cancer patients
Abstract
Background: Breast cancer (BC), which is the most common malignant tumor in females, is associated with increasing morbidity and mortality. Effective treatments include surgery, chemotherapy, radiotherapy, endocrinotherapy and molecular-targeted therapy. With the development of molecular biology, immunology and pharmacogenomics, an increasing amount of evidence has shown that the infiltration of immune cells into the tumor microenvironment, coupled with the immune phenotype of tumor cells, will significantly affect tumor development and malignancy. Consequently, immunotherapy has become a promising treatment for BC prevention and as a modality that can influence patient prognosis.
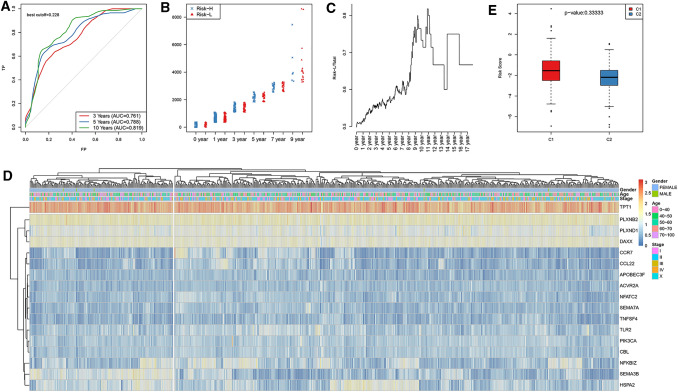
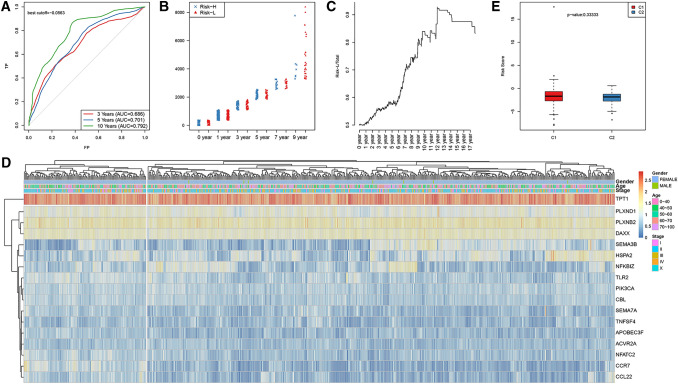
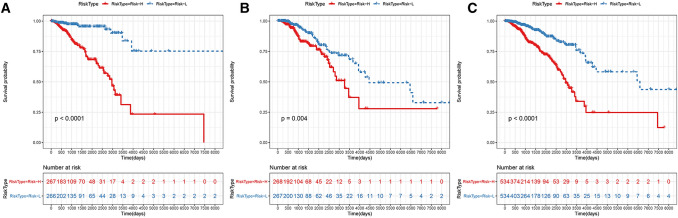
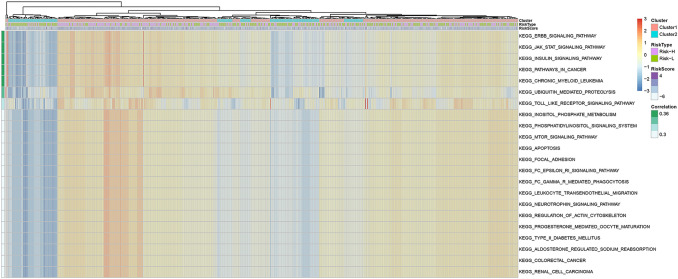
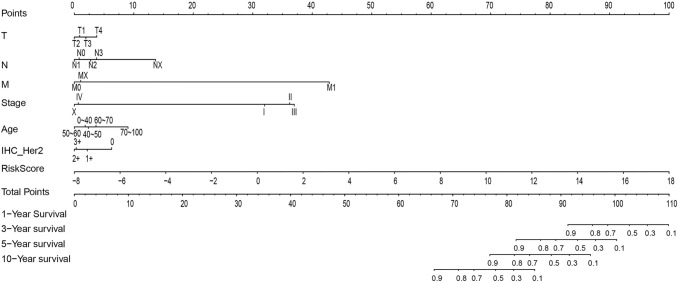
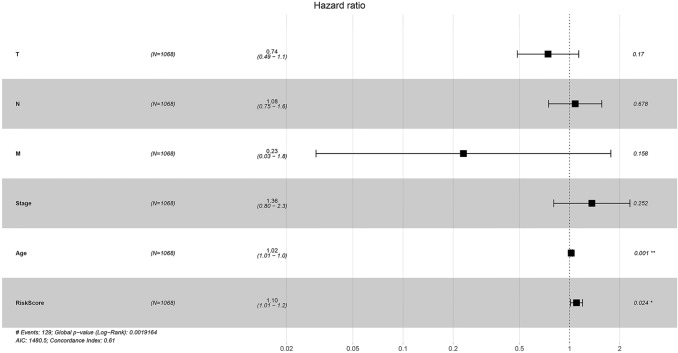
Methods: In this study, samples collected from The Cancer Genome Atlas (TCGA) and ImmPort databases were analyzed to investigate specific immune-related genes that affect the prognosis of BC patients. In all, 64 immune-related genes related to prognosis were screened, and the 17 most representative genes were finally selected to establish the prognostic prediction model of BC (the RiskScore model) using the Lasso and StepAIC methods. By establishing a training set and a test set, the efficiency, accuracy and stability of the model in predicting and classifying the prognosis of patients were evaluated. Finally, the 17 immune-related genes were functionally annotated, and GO and KEGG signal pathway enrichment analyses were performed.
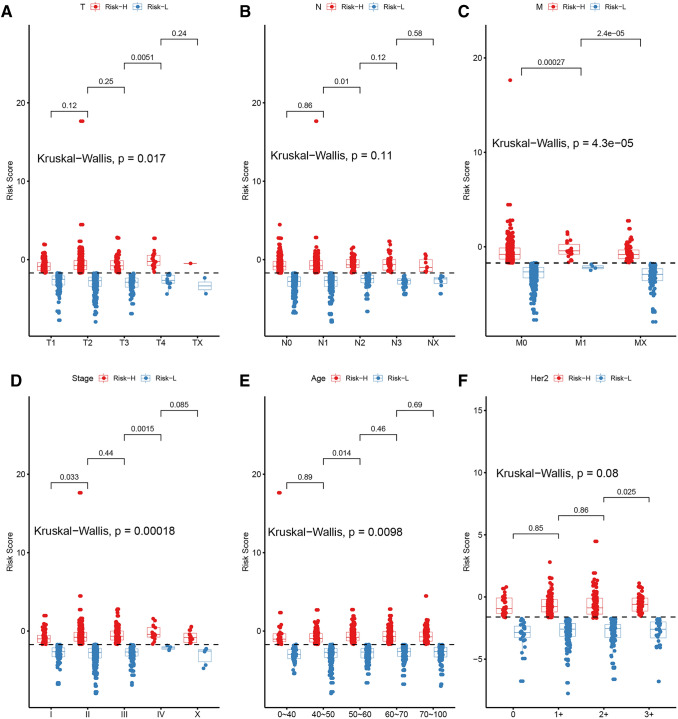
Results: We found that these 17 genes were enriched in numerous BC- and immune microenvironment-related pathways. The relationship between the RiskScore and the clinical characteristics of the sample and signaling pathways was also analyzed.
Conclusions: Our findings indicate that the prognostic prediction model based on the expression profiles of 17 immune-related genes has demonstrated high predictive accuracy and stability in identifying immune features, which can guide clinicians in the diagnosis and prognostic prediction of BC patients with different immunophenotypes.
Keywords: Breast cancer; Immunotherapy; TCGA database.
Conflict of interest statement
The authors declare that they have no competing interests.
Figures


Similar articles
-
A novel immune-related prognostic index for predicting breast cancer overall survival.Breast Cancer. 2021 Mar;28(2):434-447. doi: 10.1007/s12282-020-01175-z. Epub 2020 Nov 4. Breast Cancer. 2021. PMID: 33146847
-
Identification of Genes with Prognostic Value in the Breast Cancer Microenvironment Using Bioinformatics Analysis.Med Sci Monit. 2020 Apr 6;26:e920212. doi: 10.12659/MSM.920212. Med Sci Monit. 2020. PMID: 32251269 Free PMC article.
-
Machine learning-based diagnostic and prognostic models for breast cancer: a new frontier on the clinical application of natural killer cell-related gene signatures in precision medicine.Front Immunol. 2025 May 27;16:1581982. doi: 10.3389/fimmu.2025.1581982. eCollection 2025. Front Immunol. 2025. PMID: 40496857 Free PMC article.
-
Emerging immune gene signatures as prognostic or predictive biomarkers in breast cancer.Arch Pharm Res. 2019 Nov;42(11):947-961. doi: 10.1007/s12272-019-01189-y. Epub 2019 Nov 9. Arch Pharm Res. 2019. PMID: 31707598 Review.
-
Aberrant DNA methylation impacts gene expression and prognosis in breast cancer subtypes.Int J Cancer. 2016 Jan 1;138(1):87-97. doi: 10.1002/ijc.29684. Epub 2015 Jul 30. Int J Cancer. 2016. PMID: 26174627 Review.
Cited by
-
Construction of a prognostic assessment model for colon cancer patients based on immune-related genes and exploration of related immune characteristics.Front Cell Dev Biol. 2022 Dec 16;10:993580. doi: 10.3389/fcell.2022.993580. eCollection 2022. Front Cell Dev Biol. 2022. PMID: 36589748 Free PMC article.
References
-
- Waks AG, Winer EP. Breast cancer treatment. JAMA. 2019;321(3):316. - PubMed
-
- Bernstein L. Epidemiology of endocrine-related risk factors for breast cancer. J Mammary Gland Biol Neoplas. 2002;7(1):3–15. - PubMed
-
- Laas E, Hamy AS, Michel AS, Panchbhaya N, Faron M, Lam T, Carrez S, Pierga JY, Rouzier R, Lerebours F, et al. Impact of time to local recurrence on the occurrence of metastasis in breast cancer patients treated with neoadjuvant chemotherapy: a random forest survival approach. PLoS ONE. 2019;14(1):e0208807. - PMC - PubMed
-
- Chaudhary LN, Wilkinson KH, Kong A. Triple-negative breast cancer: who should receive neoadjuvant chemotherapy? Surg Oncol Clin N Am. 2018;27(1):141–153. - PubMed
MeSH terms
Substances
LinkOut - more resources
Full Text Sources
Medical
