

Auto-antibodies against apolipoprotein A-1 block cancer cells proliferation and induce apoptosis
- PMID: 33245719
- PMCID: PMC7679029
- DOI: 10.18632/oncotarget.27814
Auto-antibodies against apolipoprotein A-1 block cancer cells proliferation and induce apoptosis
Abstract
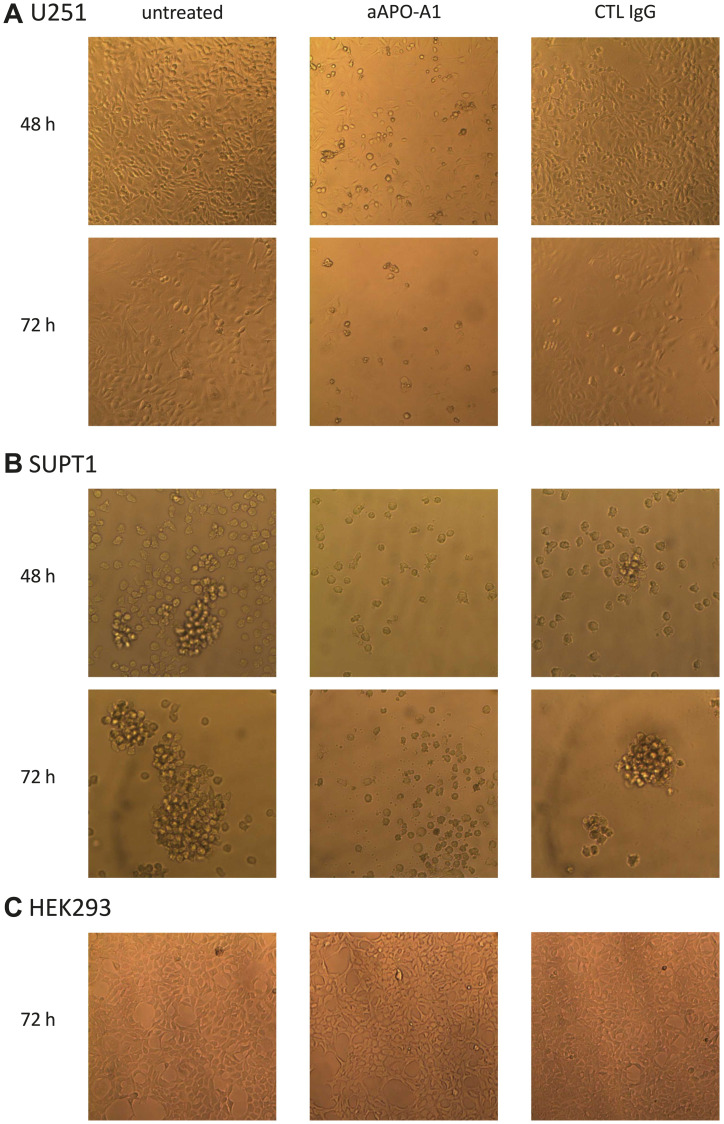
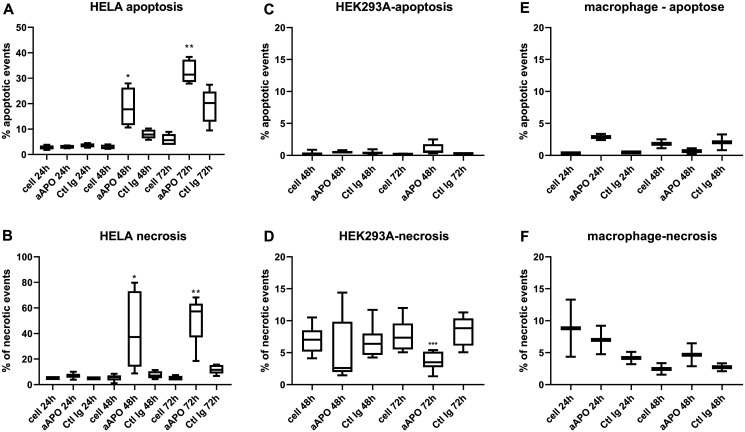
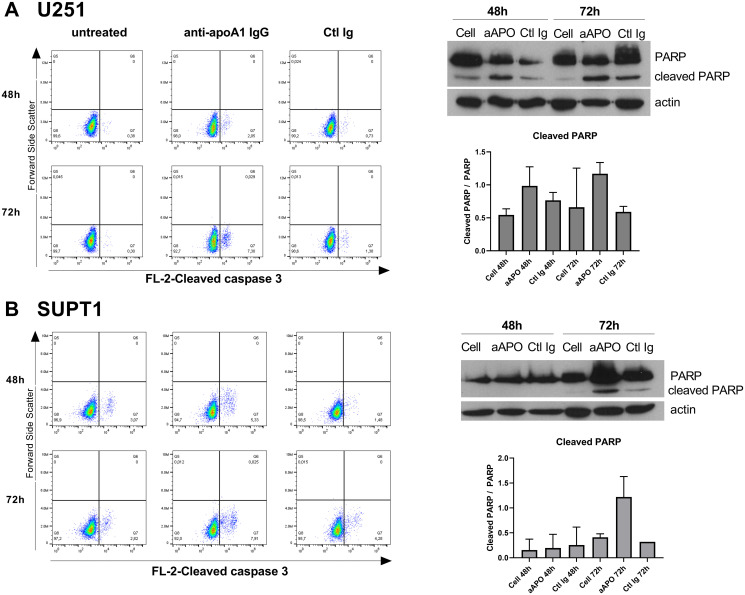
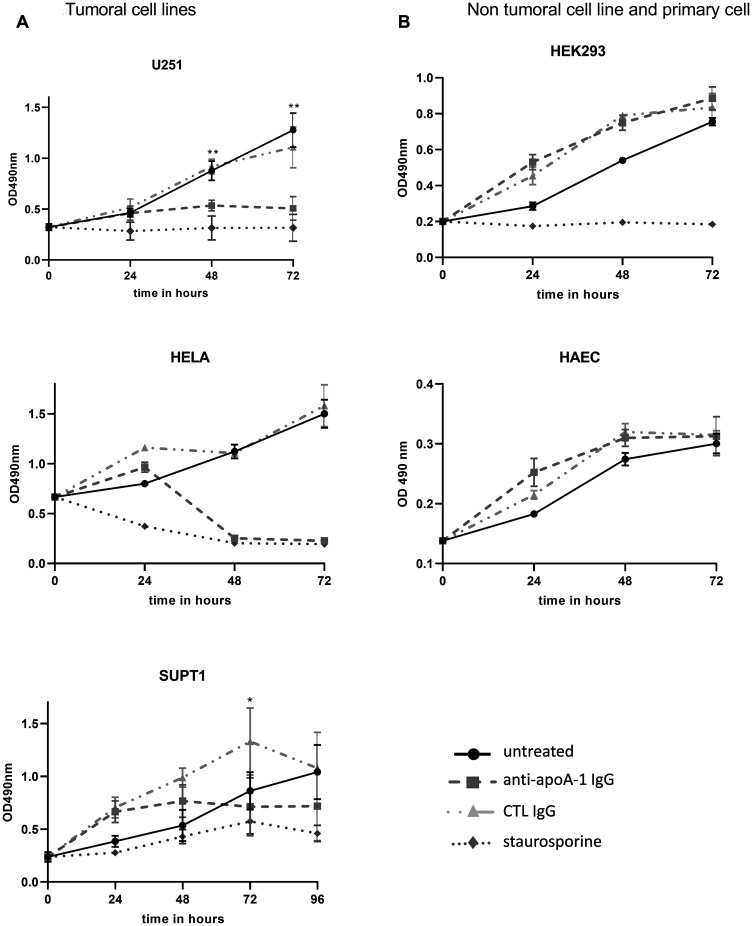
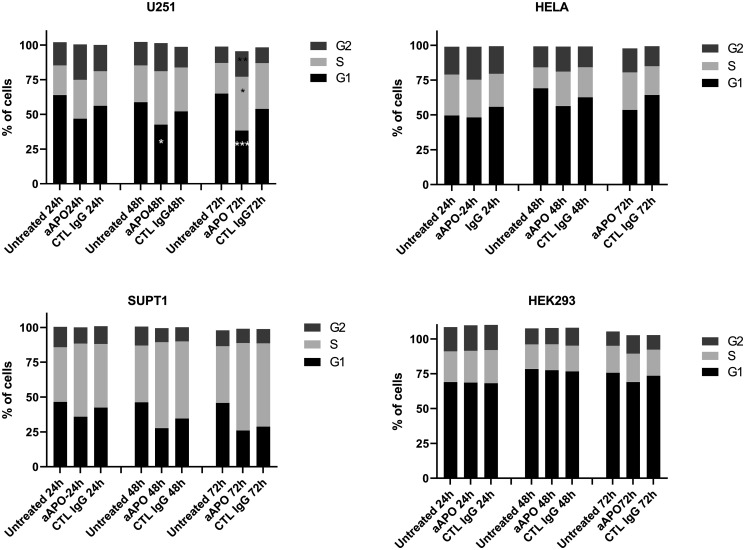
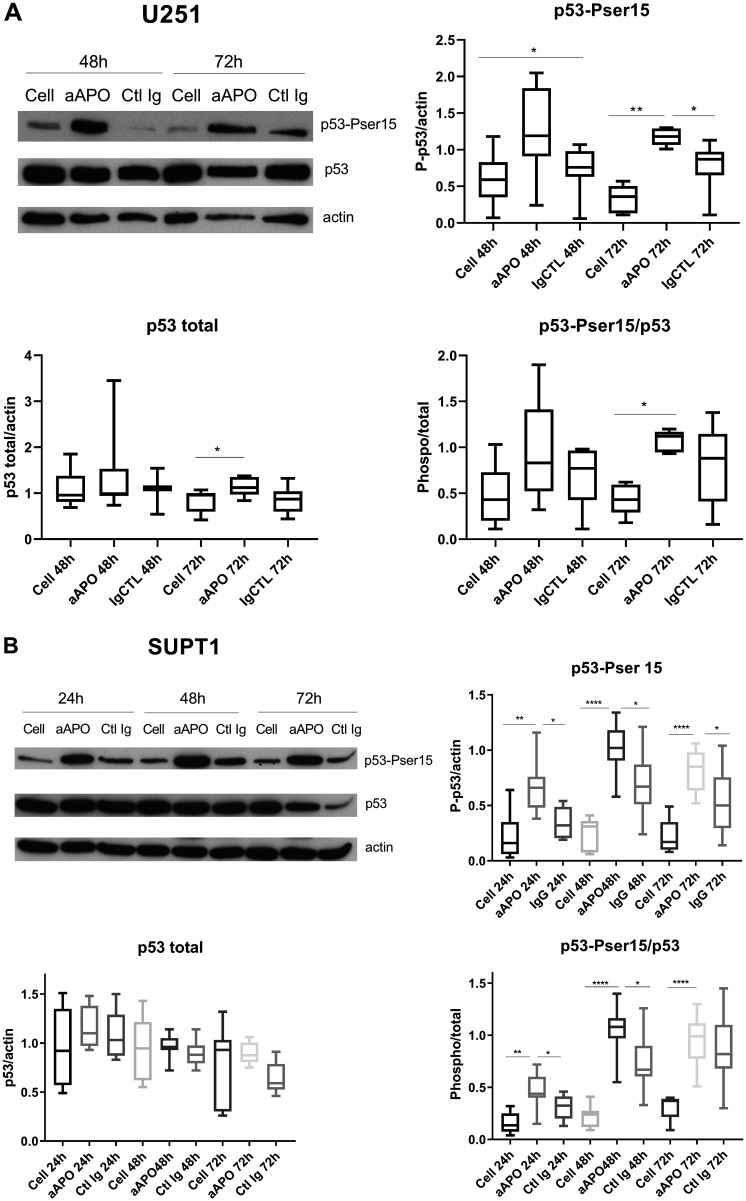
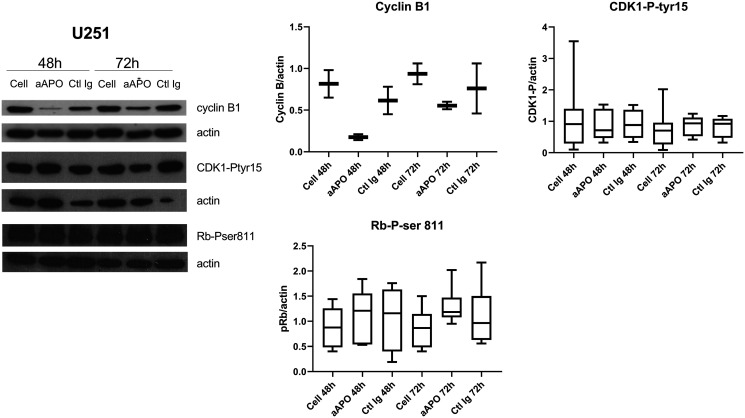
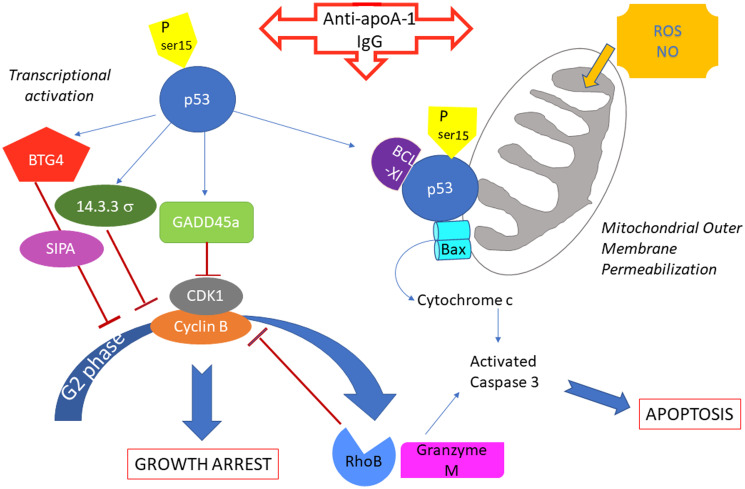
Auto-antibodies against apoA-1 (anti-apoA-1 IgGs) have been identified as important actors of atherosclerosis development through pro-inflammatory and pro-atherogenic properties and to also induce apoptosis in tumoral neuronal and lymphocyte derived cell lines through unknown mechanisms. The purpose of this study was to explore the cellular pathways involved in tumoral cell survival modulated by anti-apoA-1 antibodies. We observed that anti-apoA-1 antibodies induce growth arrest (in G2/M phase) and cell apoptosis through caspase 3 activation, accompanied by a selective p53 phosphorylation on serine 15. RNA sequencing indicated that anti-apoA-1 IgGs affect the expression of more than 950 genes belonging to five major groups of genes and respectively involved in i) cell proliferation inhibition, ii) p53 stabilisation and regulation, iii) apoptosis regulation, iv) inflammation regulation, and v) oxidative stress. In conclusion, anti-apoA-1 antibodies seem to have a role in blocking tumoral cell proliferation and survival, by activating a major tumor suppressor protein and by modulating the inflammatory and oxidative stress response. Further investigations are needed to explore a possible anti-cancer therapeutic approach of these antibodies in very specific and circumscribed conditions.
Keywords: anti-apoA-1 antibodies; apoptose; cell proliferation; oxidative stress.
Copyright: © 2020 Satta et al.
Conflict of interest statement
CONFLICTS OF INTEREST Authors have no conflicts of interest to declare.
Figures
Similar articles
-
Anti-apolipoprotein A-1 IgG in patients with myocardial infarction promotes inflammation through TLR2/CD14 complex.J Intern Med. 2012 Oct;272(4):344-57. doi: 10.1111/j.1365-2796.2012.02530.x. Epub 2012 Mar 26. J Intern Med. 2012. PMID: 22329401
-
C/EBP-β Is Differentially Affected by PPARα Agonists Fenofibric Acid and GW7647, But Does Not Change Apolipoprotein A-I Production During ER-Stress and Inflammation.J Cell Biochem. 2017 Apr;118(4):754-763. doi: 10.1002/jcb.25731. Epub 2016 Dec 29. J Cell Biochem. 2017. PMID: 27618583
-
Anti-apolipoprotein A-1 autoantibodies are associated with immunodeficiency and systemic inflammation in HIV patients.J Infect. 2018 Feb;76(2):186-195. doi: 10.1016/j.jinf.2017.11.008. Epub 2017 Dec 14. J Infect. 2018. PMID: 29198606
-
Transcriptional regulation of the human apolipoprotein genes.Front Biosci. 2001 Mar 1;6:D456-504. doi: 10.2741/zannis. Front Biosci. 2001. PMID: 11229886 Review.
-
Apolipoprotein A-I (ApoA-I), Immunity, Inflammation and Cancer.Cancers (Basel). 2019 Aug 1;11(8):1097. doi: 10.3390/cancers11081097. Cancers (Basel). 2019. PMID: 31374929 Free PMC article. Review.
Cited by
-
The Effect of Metabolic Bariatric Surgery on Cardiovascular Risks: A Prospective Study Measuring Antibodies to Apolipoprotein A-1.Obes Surg. 2025 Feb;35(2):514-524. doi: 10.1007/s11695-024-07621-7. Epub 2025 Jan 3. Obes Surg. 2025. PMID: 39752005 Free PMC article.
-
Fabrication and characterization of photosensitive non-isocyanate polyurethane acrylate resin for 3D printing of customized biocompatible orthopedic surgical guides.Int J Bioprint. 2023 Feb 14;9(3):684. doi: 10.18063/ijb.684. eCollection 2023. Int J Bioprint. 2023. PMID: 37274003 Free PMC article.
References
-
- Christen U. Molecular Mimicry. In: Shoenfeld Y, Meroni PL, and Gershwin ME, eds. Antibodies. Elsevier. 2013; 35–42.
LinkOut - more resources
Full Text Sources
Molecular Biology Databases
Research Materials
Miscellaneous
