. 2021 Feb 12;144(1):288-309.
doi: 10.1093/brain/awaa376.

Alzheimer's disease brain-derived extracellular vesicles spread tau pathology in interneurons

Affiliations

Alzheimer's disease brain-derived extracellular vesicles spread tau pathology in interneurons

Zhi Ruan et al. Brain. .

Erratum in

Abstract

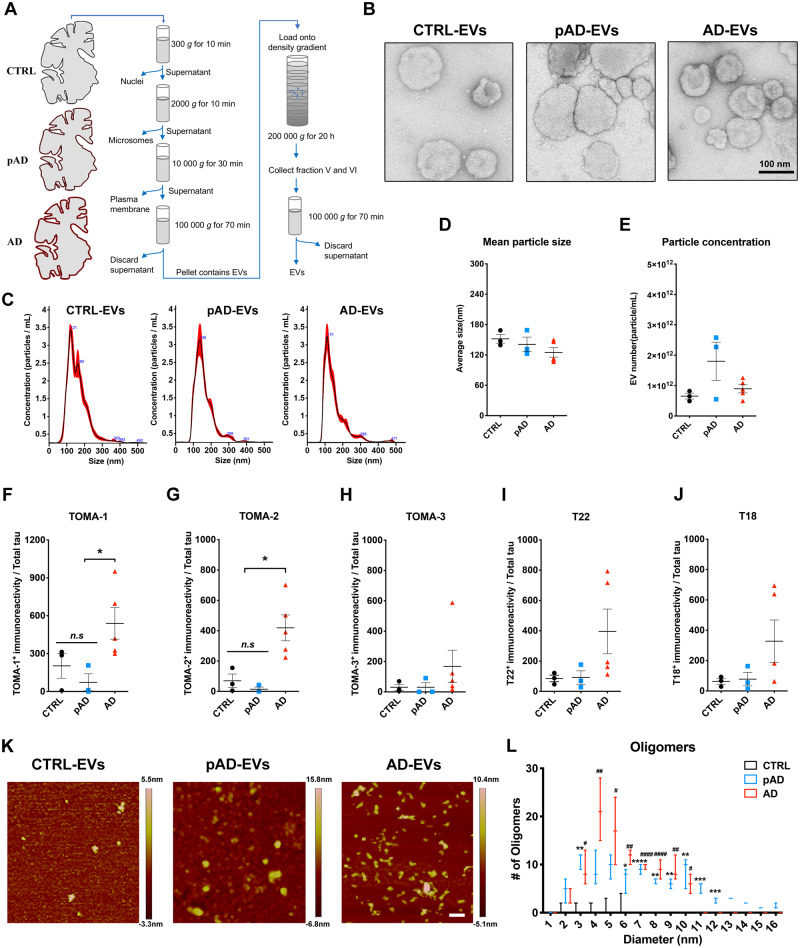
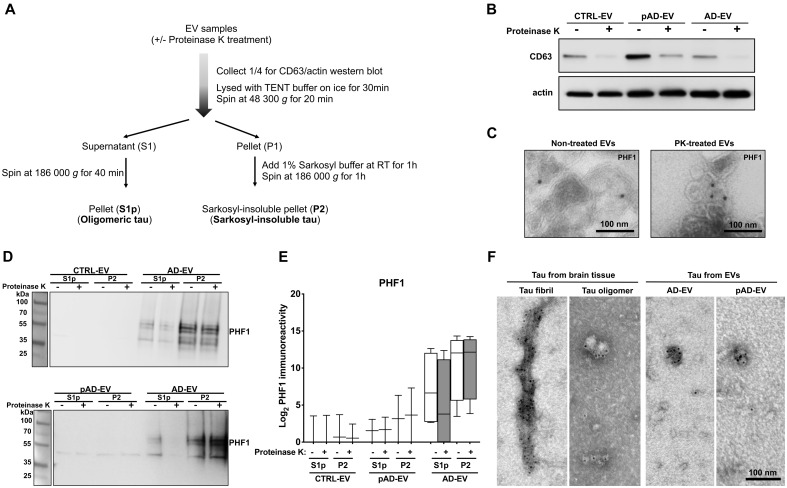
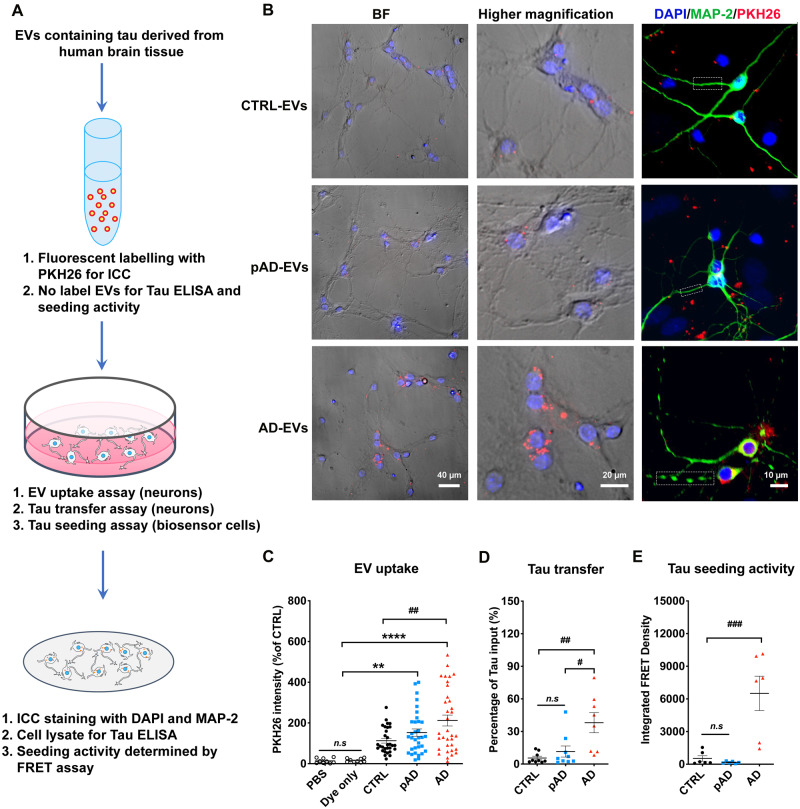
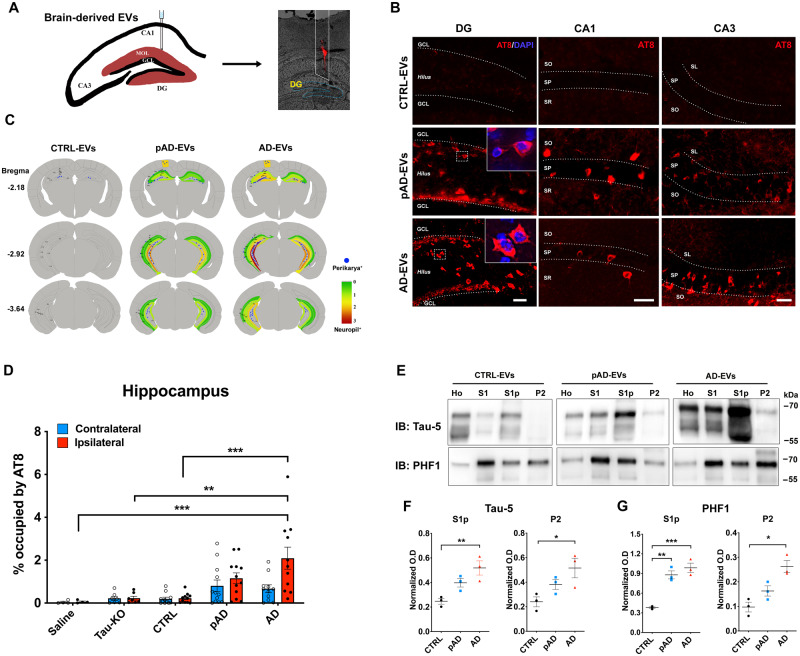
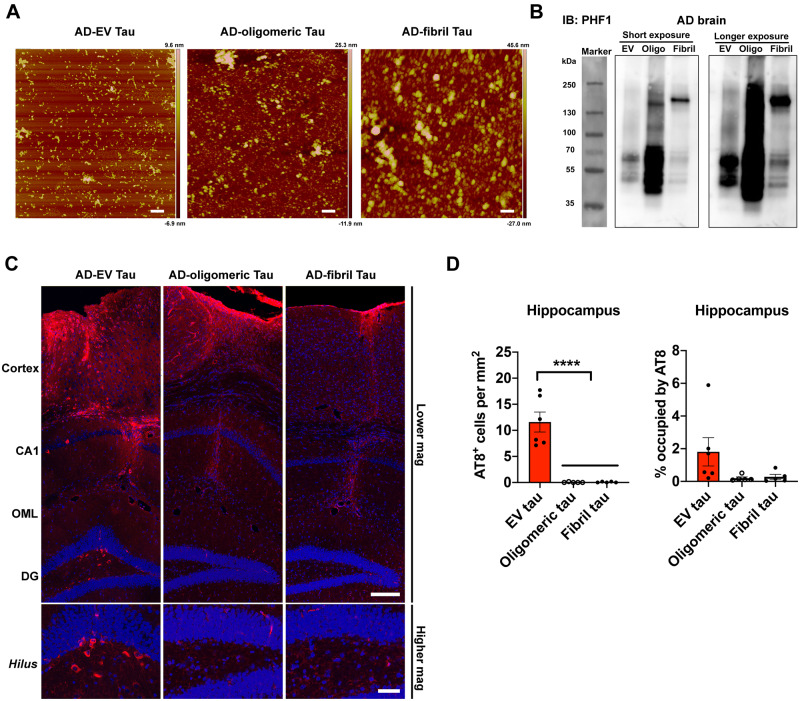
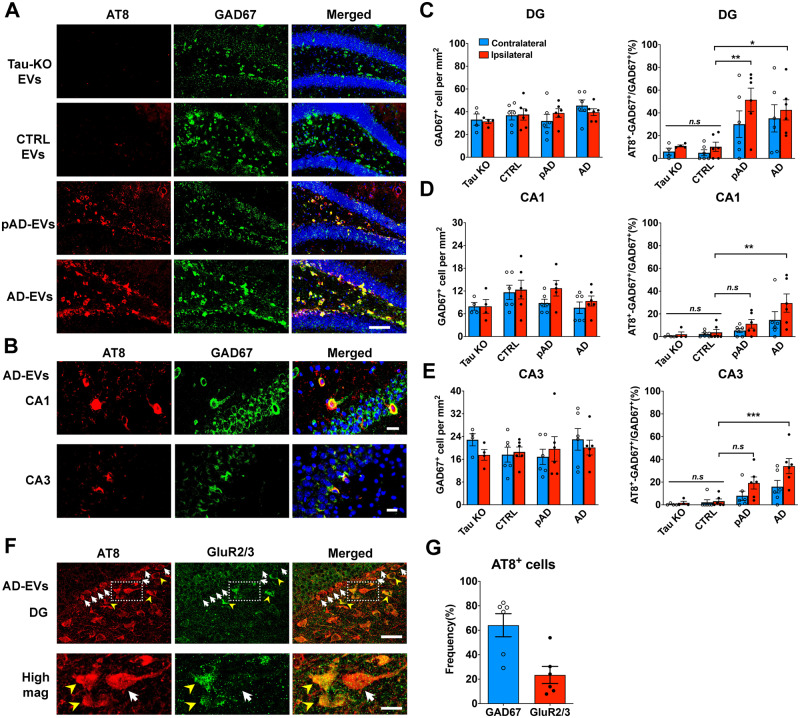
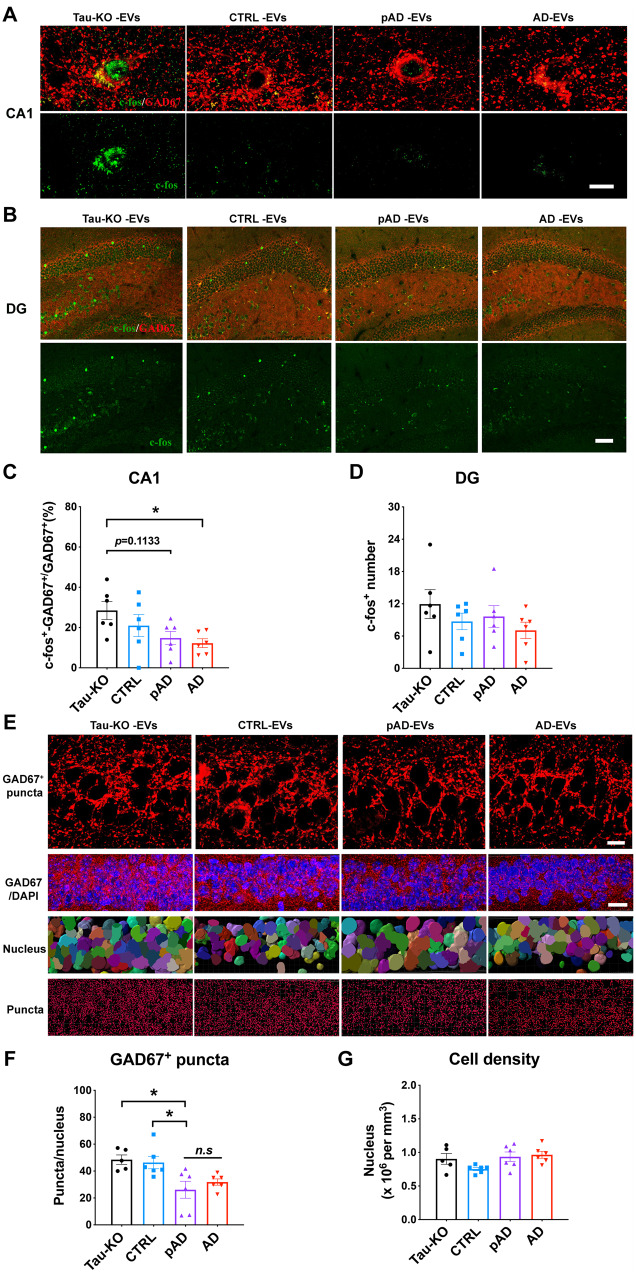
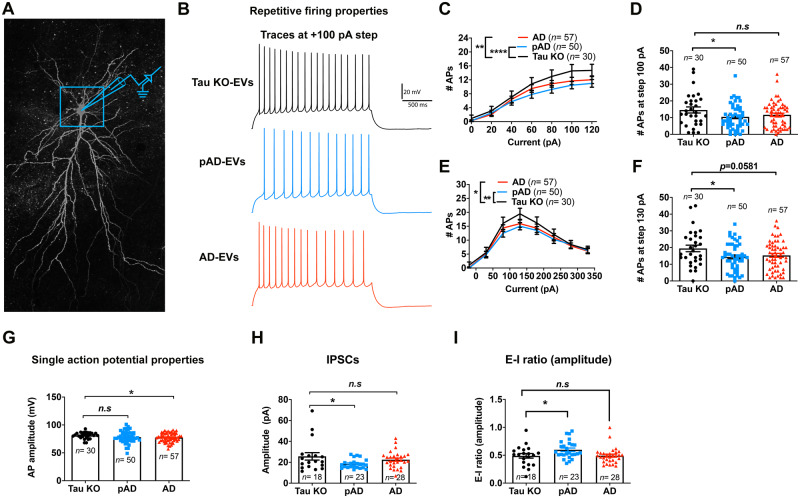
Extracellular vesicles are highly transmissible and play critical roles in the propagation of tau pathology, although the underlying mechanism remains elusive. Here, for the first time, we comprehensively characterized the physicochemical structure and pathogenic function of human brain-derived extracellular vesicles isolated from Alzheimer's disease, prodromal Alzheimer's disease, and non-demented control cases. Alzheimer's disease extracellular vesicles were significantly enriched in epitope-specific tau oligomers in comparison to prodromal Alzheimer's disease or control extracellular vesicles as determined by dot blot and atomic force microscopy. Alzheimer's disease extracellular vesicles were more efficiently internalized by murine cortical neurons, as well as more efficient in transferring and misfolding tau, than prodromal Alzheimer's disease and control extracellular vesicles in vitro. Strikingly, the inoculation of Alzheimer's disease or prodromal Alzheimer's disease extracellular vesicles containing only 300 pg of tau into the outer molecular layer of the dentate gyrus of 18-month-old C57BL/6 mice resulted in the accumulation of abnormally phosphorylated tau throughout the hippocampus by 4.5 months, whereas inoculation of an equal amount of tau from control extracellular vesicles, isolated tau oligomers, or fibrils from the same Alzheimer's disease donor showed little tau pathology. Furthermore, Alzheimer's disease extracellular vesicles induced misfolding of endogenous tau in both oligomeric and sarkosyl-insoluble forms in the hippocampal region. Unexpectedly, phosphorylated tau was primarily accumulated in glutamic acid decarboxylase 67 (GAD67) GABAergic interneurons and, to a lesser extent, glutamate receptor 2/3-positive excitatory mossy cells, showing preferential extracellular vesicle-mediated GABAergic interneuronal tau propagation. Whole-cell patch clamp recordings of CA1 pyramidal cells showed significant reduction in the amplitude of spontaneous inhibitory post-synaptic currents. This was accompanied by reductions in c-fos+ GAD67+ neurons and GAD67+ neuronal puncta surrounding pyramidal neurons in the CA1 region, confirming reduced GABAergic transmission in this region. Our study posits a novel mechanism for the spread of tau in hippocampal GABAergic interneurons via brain-derived extracellular vesicles and their subsequent neuronal dysfunction.

Keywords: Alzheimer’s disease; GABAergic interneuron; extracellular vesicle; microtubule-associated protein tau; mouse model.


Figures

Figure 1
Figure 1
Characterization of EVs by TEM, nanoparticle tracking analysis, tau oligomer dot-blotting and atomic force microscopy. (A) A schema of EV separation from human frozen brain tissue. (B) TEM image of human brain-derived EVs. (CE) Nanoparticle tracking analysis of isolated EVs (C), quantification of EV size (D) and EV density (E). (FJ) Semi-quantification of tau oligomers in EVs by multiple tau oligomer antibodies. Dot blot images are provided in Supplementary Fig. 1A. *P <0.05, as determined by one-way ANOVA (alpha = 0.05) and Tukey’s post hoc. Graphs indicate mean ± SEM. Each dot represents an individual donor, three replicates per subject, three donors per group for control (CTRL) and pAD, five donors for the Alzheimer’s disease (AD) group (Supplementary Table 2). (K and L) Atomic force microscopy images showing brain-derived EV-tau oligomers isolated from CTRL, pAD, and Alzheimer’s disease brains (K). Scale bars = 200 nm. Size distribution histogram of EV-tau oligomers (L). *P <0.05, **P <0.01, ***P <0.005 and ****P <0.0001 for pAD EVs versus CTRL EVs; #P <0.05, ##P <0.01, and ####P <0.0001 for Alzheimer’s disease EVs versus CTRL EVs as determined by one-way ANOVA (alpha = 0.05) and Tukey’s post hoc. Graphs indicate mean ± SEM. n = 3 images per sample. AD = Alzheimer’s disease; CTRL = control.
Figure 2
Figure 2
PK treatment of human brain derived EVs for biochemical characterization. (A) Workflow of the tau purification by sequential centrifugation after with or without PK treatment. (B) Western blot analysis of non-treated and PK-treated EVs from three groups (CTRL, pAD and Alzheimer’s disease) with CD63 and actin antibodies. (C) Immunoelectron microscopy images of ultrathin-sectioned Alzheimer’s disease EVs for PHF1+ tau with or without PK-treatment. Images were captured at direct magnification ×30 000, with the 10 nm immunogold labelling. (D) Western blot analysis of oligomer-enriched (S1p) and sarkosyl-insoluble tau-enriched (P2) fractions from EVs for PHF1 with or without PK-treatment. (E) Semi-quantification of PHF1 immunoreactivity. Two donors per group for CTRL and pAD and four donors for the Alzheimer’s disease group. (F) Immunoelectron microscopy of isolated tau fibrils, oligomers or sarkosyl-insoluble fraction of EVs from human Alzheimer’s disease brain tissue. Images were captured by TEM at direct magnification ×40 000, with the 5-nm immunogold labelling for PHF1. (AF) Donors 1 and 2 (control, CTRL), 4 and 5 (pAD), and 7–10 (Alzheimer’s disease, AD) were used (Supplementary Table 2).
Figure 3
Figure 3
Neuronal uptake, tau transfer efficiency and tau seeding activities of human brain-derived EVs. (A) A diagram illustrating the primary culture model with primary neurons used to measure the transfer of EVs containing tau and a biosensor cell assay system for seeding activity. (B) Cellular uptake of PKH26-labelled EVs (red) by primary culture murine cortical neurons (MAP-2, green; DAPI, blue). Original magnification: ×20 (left and middle columns); 40× (right column, taken by Zeiss LSM710 confocal microscopy). Scale bars = 40, 20, 10 µm (left to right). (C) Quantification of PKH26 fluorescent intensity in neurons. **P <0.0001 and ****P <0.0001 compared with PBS or dye only group; ##P <0.01 compared with the CTRL-EV group; determined by one-way ANOVA (alpha = 0.05) and Tukey’s post hoc. Each dot represents average data per image (10–20 cells per image), nine images per group (for PBS and dye only), 10 images per donor and three donors per group (for control EV, pAD EV, and Alzheimer’s disease EVs), total n =30 per group. (D) Total human tau ELISA of neuronal cell lysates. #P <0.05 compared with pAD EV and ##P <0.01 compared with the control EV group; n.s denotes no significance as determined by one-way ANOVA (alpha = 0.05) and Tukey’s post hoc. Three donors per group, three independent experiments. Graphs indicate mean ± SEM. (E) EVs were tested in the tau-FRET assay for tau seeding activity. Results are plotted as integrated FRET density values for each sample. ###P < 0.001 compared with control EV and pAD EV groups; as determined by one-way ANOVA (alpha = 0.05) and Tukey’s post hoc. Three donors per group, and each dot represents one well. Graphs indicate mean ± SEM. (BE) Donors 1–3 (control), 4–6 (pAD), and 7–9 (Alzheimer’s disease) were used (Supplementary Table 2). AD = Alzheimer’s disease; BF = bright-field; CTRL = control; FRET = Förster resonance energy transfer; ICC = immunocytochemistry.
Figure 4
Figure 4
Alzheimer’s disease EV but not control EV injection causes progressive tauopathy in aged B6 mouse brains. (A) A schema illustrating 300 pg of tau containing EVs from human brain unilaterally injected to the hippocampus of B6 mice at 18–19 months of age. DiI (red) indicated the injection site of the OML of the hippocampus. (B) Representative image of AT8 staining (red) 4.5 months after intrahippocampal injection of Alzheimer’s disease EV and pAD EV into aged B6 mouse brain. Original magnification: ×20. Scale bar = 50 μm. (C) Semi-quantitative analysis of Alzheimer’s disease-like tau pathologies based on AT8 immunostaining of brains from control, pAD, and Alzheimer’s disease (AD) EV-injected mice at 4.5 months post-injection. Blue dots represent AT8+ perikaryal inclusions. AT8+ density from green (0, low) to red (3, high). (D) Quantification of AT8+ occupied area in the contralateral (blue) and ipsilateral (red) in entire hippocampal regions of recipient mice. **P < 0.01 and ***P <0.001 compared with the control EV group determined by one-way ANOVA (alpha = 0.05) and Tukey’s post hoc. Total mice in each group for the quantification were 4, 6, 12, 12, and 11 for saline, tau-KO, control, pAD, and Alzheimer’s disease. Two donors for EVs per group for control (Donors 1 and 2), pAD (Donors 4 and 5), and Alzheimer’s disease (Donors 7 and 9), (n =5–6 mice per donor). Bregma −1.34 to −3.64, four sections per mouse were analysed. Each dot represents mean value from one animal. Graphs indicate mean ± SEM. (E) Immunoblotting of biochemically fractionated brain tissue samples for homogenate (Ho), TBS supernatant (S1), tau oligomer enriched (S1p) and tau fibril enriched fractions (P2) by Tau-5 (total tau) and PHF1 (pSer396/pSer404 tau) (top) and their quantification (bottom). Equal proportions of homogenate (Ho), S1, S1p, and P2 fractions were analysed (n =3 mice/group). Optical density (OD) was normalized to that for the homogenate fraction from each corresponding mouse. *P < 0.05, **P <0.01 and ***P <0.001 compared with the control group as determined by one-way ANOVA (alpha = 0.05) and Tukey’s post hoc. Graphs indicate mean ± SEM. CTRL = control; DG = dentate gyrus; IB = immunoblot.
Figure 5
Figure 5
EV-tau but not oligomeric or fibrillar tau enriched samples derived from the same Alzheimer’s disease brain induced tau propagation in mouse brain. (A) Atomic force microscopy images of EVs and tau aggregates isolated from the same Alzheimer’s disease (AD) brain tissues. Scale bars = 200 nm. (B) Representative images of PHF1 immunoblotting of isolated EVs, tau oligos and tau fibrils by PHF1 antibody. (C) Representative images of AT8 immunostained recipient mice after unilateral injection of Alzheimer’s disease EVs (left), tau oligomer-enriched fraction (middle) and tau fibril-enriched fraction (right) in cortical region (top) and dentate gyrus (DG, bottom). Scale bars = 200 µm (top), 50 µm (bottom). (D) Quantification of AT8+ neurons in the hippocampus of recipient mice. ****P < 0.0001 compared between EV-tau injected group and oligomeric or fibril tau group, as determined by one-way ANOVA (alpha = 0.05) and Tukey’s post hoc. EV-tau, oligomeric, and fibril tau group: n =5–6 mice per group for quantification. Bregma −1.34 to −3.64, four sections per mouse were analysed. Each dot represents mean value per animal. Graphs indicate mean ± SEM. (AD) Donor 7 was used (Supplementary Table 2). IB = immunoblot.
Figure 6
Figure 6
Specific pathological tau staining with AT8 antibody in GABAergic interneurons in the hippocampus of B6 mice. (A) AT8 (red) and GAD67 (green) immunostaining in the ipsilateral dentate gyrus (DG) of hippocampal region from tau-KO EV, control EV, pAD EV, and Alzheimer’s disease (AD) EV injected mice at 4.5 months post-injection. Scale bars = 100 µm. (B) AT8 (red) and GAD67 (green) immunostaining in the ipsilateral CA1 and CA3 of hippocampal region from Alzheimer’s disease EV injected mice. Scale bars = 20 µm (top), 25 µm (bottom). (CE) Quantification of GAD67+ cells in dentate gyrus (C), CA1 (D), and CA3 of hippocampus (E). The percentage of AT8+ GAD67+ cells in all GAD67+ cells are shown in the right column (CE). Ipsilateral side (red column) contralateral side (blue column).*P < 0.05, **P < 0.01 and ***P <0.001 compared with control group, as determined by one-way ANOVA (alpha = 0.05) and Tukey’s post hoc. n =5–6 mice per group for quantification. At least two sections were imaged per animal. Each dot represents mean value per animal. Graphs indicate mean ± SEM. (F and G) Immunostaining of GluR2/3+ mossy cells (F) and AT8 in the ipsilateral dentate gyrus of hippocampal region from Alzheimer’s disease EV injected mice; and quantification of the ratio of GAD67+ AT8+ cells/total AT8+cells (blue) and GluR2/3+ AT8+ cells/AT8+ cells (red) (G). n =6 mice per group for quantification. At least two sections were imaged per animal. Each dot represents mean value per animal. Graphs indicate mean ± SEM. Scale bars = 20 µm (top), 10 µm (bottom). (AG) Control (Donors 1 and 2), pAD (Donors 4 and 5), and Alzheimer’s disease (Donors 7 and 9) were used (Supplementary Table 2). CA1/3 = cornu ammonis 1/3; CTRL = control.
Figure 7
Figure 7
Reduction in c-fos expression in GAD67+ GABAergic interneurons and GAD67+ puncta around CA1 pyramidal cells in Alzheimer’s disease EV and pAD EV injected aged B6 mice. (AD) GAD67 (red) and c-fos (green) co-staining images and quantification of the percentage of c-fos+ GAD67+ cells in all GAD67+ cells in CA1 region (A and C) and total c-fos+ positive cells in the dentate gyrus (DG) region (B and D). Scale bar = 10 μm (A), 50 μm (B). *P <0.05 Alzheimer’s disease EVs compared with the tau-KO EV group, as determined by one-way ANOVA (alpha = 0.05) and Tukey’s post hoc. n =6 mice per group for quantification. At least two sections were imaged per animal. Each dot represents mean value per animal. Graphs indicate mean ± SEM. (E) High magnification images in top panels compared GAD67 expression (red) in CA1 pyramidal cells of the hippocampus in all four injected tau-KO, control, pAD or Alzheimer’s disease (AD) EV groups. Scale bar = 10 μm. Second panel shows lower magnification images of GAD67 expression and DAPI staining. Scale bar = 20 μm. Third panel shows cells counted by Imaris software based on DAPI staining. Bottom panel shows GAD67+ puncta analysis by Imaris. Scale bar = 10 μm. (F and G) Quantification of GAD67+ puncta (F) and total cell number in CA1 of hippocampus (G). *P < 0.05, pAD EV compared with tau-KO and control EV groups, as determined by one-way ANOVA (alpha = 0.05) and Dunnett’s post hoc. n =5–6 mice per group for quantification. At least two sections were imaged per animal. Each dot represents mean value per animal. Graphs indicate mean ± SEM. (AG) Control (Donors 1 and 2), pAD (Donors 4 and 5), and Alzheimer’s disease (Donors 7 and 9) were used (Supplementary Table 2).
Figure 8
Figure 8
Whole-cell patch clamp recording of CA1 pyramidal neurons. (A) Confocal z-stack montage (×63 magnification) image of biocytin-filled mouse CA1 pyramidal neurons after recording. (BG) AP-firing recorded in whole-cell current clamp mode. (B) Representative traces for tau-KO (black colour), pAD (blue colour), and Alzheimer’s disease EV (red colour) for 100 pA steps at 2-s long high input resistance protocol. (C) Quantification of repetitive firing at high input resistance step current injection protocol. **P <0.01 Alzheimer’s disease EV versus tau-KO EV, ****P <0.0001 as group as determined by two-way ANOVA; (D) pAD EV significantly reduce the firing at 100 pA, *P <0.05 pAD EV versus tau-KO EV as determined by one-way ANOVA. (E) Quantification of repetitive firing at high input resistance step current injection protocol. *P <0.05 Alzheimer’s disease EV versus tau-KO EV, **P <0.01 as group as determined by two-way ANOVA. (D) pAD EV significantly reduce the firing at 130 pA, *P <0.05 pAD EV versus tau-KO EV as determined by one-way ANOVA. (G) Alzheimer’s disease EVs significantly reduced AP amplitude, *P <0.05 Alzheimer’s disease EV versus tau-KO EV, as determined by one-way ANOVA. (CG) n =30, 50, and 57 cells for tau-KO, pAD, and Alzheimer’s disease (AD) EV injected mice, respectively; n =5–7 mice per group. Each dot represents one recorded cell. Graphs indicate mean ± SEM. (H and I) Quantification of GABAergic sIPSCs recorded in whole-cell voltage clamp mode from neuronal network. The pAD group showed a significant decrease in sIPSC amplitude (H) and E-I amplitude ratio (I). *P < 0.05 as compared with the control group, as determined by one-way ANOVA (alpha = 0.05) and Dunnett’s post hoc. (H and I) n =18, 23, and 28 cells for tau-KO, pAD and Alzheimer’s disease-EV injected mice, n =5–7 mice per group. Each dot represents one recorded cell. Graphs indicate mean ± SEM. (AI) Donors 1, 4 and 7 were used (Supplementary Table 2). See also Supplementary Tables 4–7.

References

    1. Apicco DJ, Ash PEA, Maziuk B, LeBlang C, Medalla M, Al Abdullatif A, et al. Reducing the RNA binding protein TIA1 protects against tau-mediated neurodegeneration in vivo. Nat Neurosci 2018; 21: 72–80. - PMC - PubMed
    1. Arai H, Clark CM, Ewbank DC, Takase S, Higuchi S, Miura M, et al. Cerebrospinal fluid tau protein as a potential diagnostic marker in Alzheimer's disease. Neurobiol Aging 1998; 19: 125–6. - PubMed
    1. Arriagada PV, Growdon JH, Hedley-Whyte ET, Hyman BT. Neurofibrillary tangles but not senile plaques parallel duration and severity of Alzheimer's disease. Neurology 1992; 42: 631–9. - PubMed
    1. Asai H, Ikezu S, Tsunoda S, Medalla M, Luebke J, Haydar T, et al. Depletion of microglia and inhibition of exosome synthesis halt tau propagation. Nat Neurosci 2015; 18: 1584–93. - PMC - PubMed
    1. Baker S, Polanco JC, Gotz J. Extracellular vesicles containing P301L mutant tau accelerate pathological tau phosphorylation and oligomer formation but do not seed mature neurofibrillary tangles in ALZ17 mice. J Alzheimers Dis 2016; 54: 1207–17. - PubMed

Publication types

MeSH terms