. 2020 Nov 27;15(1):71.
doi: 10.1186/s13024-020-00416-1.

Astrocyte-derived clusterin suppresses amyloid formation in vivo

Affiliations

Astrocyte-derived clusterin suppresses amyloid formation in vivo

Aleksandra M Wojtas et al. Mol Neurodegener. .

Abstract

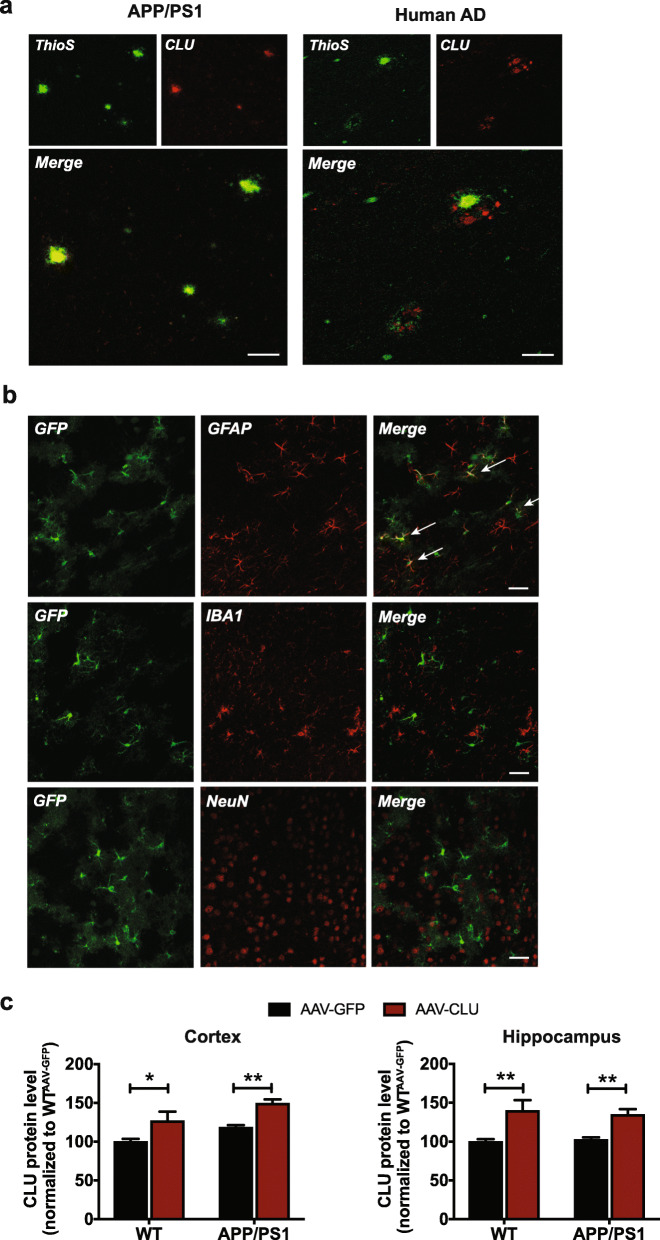
Background: Accumulation of amyloid-β (Aβ) peptide in the brain is a pathological hallmark of Alzheimer's disease (AD). The clusterin (CLU) gene confers a risk for AD and CLU is highly upregulated in AD patients, with the common non-coding, protective CLU variants associated with increased expression. Although there is strong evidence implicating CLU in amyloid metabolism, the exact mechanism underlying the CLU involvement in AD is not fully understood or whether physiologic alterations of CLU levels in the brain would be protective.

Results: We used a gene delivery approach to overexpress CLU in astrocytes, the major source of CLU expression in the brain. We found that CLU overexpression resulted in a significant reduction of total and fibrillar amyloid in both cortex and hippocampus in the APP/PS1 mouse model of AD amyloidosis. CLU overexpression also ameliorated amyloid-associated neurotoxicity and gliosis. To complement these overexpression studies, we also analyzed the effects of haploinsufficiency of Clu using heterozygous (Clu+/-) mice and control littermates in the APP/PS1 model. CLU reduction led to a substantial increase in the amyloid plaque load in both cortex and hippocampus in APP/PS1; Clu+/- mice compared to wild-type (APP/PS1; Clu+/+) littermate controls, with a concomitant increase in neuritic dystrophy and gliosis.

Conclusions: Thus, both physiologic ~ 30% overexpression or ~ 50% reduction in CLU have substantial impacts on amyloid load and associated pathologies. Our results demonstrate that CLU plays a major role in Aβ accumulation in the brain and suggest that efforts aimed at CLU upregulation via pharmacological or gene delivery approaches offer a promising therapeutic strategy to regulate amyloid pathology.

Keywords: Adeno-associated viral vectors; Alzheimer’s disease; Amyloid plaques; Aβ; Clusterin; Haploinsufficiency.


Conflict of interest statement

The authors declare that no competing interests exist.

Figures

Fig. 1
Fig. 1
CLU co-localizes with amyloid plaques in mouse models and human AD and is specifically overexpressed in astrocytes. a Extensive CLU immunoreactivity (red) was observed in amyloid deposits (green) in cortex of APP/PS1 animals and brain tissue of an AD individual. Scale bar, 50 μm. b AAV-mediated specific expression of GFP (green) in GFAP-positive astrocytes (red) but not IBA1-positive microglia (red) or NeuN-specific neurons (red) in APP/PS1 animals. Scale bar, 100 μm. c CLU protein levels were assessed in cortex and hippocampus of WT and APP/PS1 mice by enzyme-linked immunosorbent assay (ELISA). Data represent mean ± S.E.M. Cortex: WTAAV-GFP: N = 6 mice/group (100 ± 3.70), WTAAV-CLU: N = 6 mice/group (127 ± 11.99), APP/PS1AAV-GFP: N = 10 mice/group (118 ± 2.98), APP/PS1AAV-CLU: N = 10 mice/group (150 ± 4.84). Hippocampus: WTAAV-GFP: N = 6 mice/group (100 ± 3.09), WTAAV-CLU: N = 6 mice/group (140 ± 13.37), APP/PS1AAV-GFP: N = 10 mice/group (103 ± 2.96), APP/PS1AAV-CLU: N = 10 mice/group (135 ± 6.97). Two-way ANOVA with Tukey’s multiple comparisons tests were used, *p < 0.05, **p < 0.01
Fig. 2
Fig. 2
CLU upregulation reduces parenchymal amyloid accumulation in APP/PS1 mice. a Representative images of fibrillar amyloid deposition in cortex and hippocampus of 8-month-old APP/PS1AAV-GFP and APP/PS1AAV-CLU animals. Scale bar, 100 μm. b-c Stereological quantification of (b) fibrillar amyloid deposits (Cortex: APP/PS1AAV-GFP (0.41 ± 0.05), APP/PS1AAV-CLU (0.24 ± 0.03); Hippocampus: APP/PS1AAV-GFP (0.25 ± 0.04), APP/PS1AAV-CLU (0.11 ± 0.01)) and c total amyloid accumulation (Cortex: APP/PS1AAV-GFP (0.74 ± 0.06), APP/PS1AAV-CLU (0.49 ± 0.07); Hippocampus: APP/PS1AAV-GFP (0.51 ± 0.05), APP/PS1AAV-CLU (0.29 ± 0.04)), N = 11–12 mice/group. For each animal three brain sections were analyzed. Data are presented as mean ± S.E.M. and each brain region was analyzed by Student’s t, *p < 0.05, **p < 0.01. d Quantification of the Aβ40 and Aβ42 levels in the soluble and insoluble cortical fractions of 8-month-old APP/PS1AAV-GFP and APP/PS1AAV-CLU mice by ELISA. N = 10–12 mice/group. Data are presented as mean ± S.E.M.: (soluble Aβ40: APP/PS1AAV-GFP (1 ± 0.14), APP/PS1AAV-CLU (0.62 ± 0.09); soluble Aβ42: APP/PS1AAV-GFP (1 ± 0.18), APP/PS1AAV-CLU (0.51 ± 0.10)) and insoluble (Aβ40: APP/PS1AAV-GFP (1 ± 0.21), APP/PS1AAV-CLU (0.47 ± 0.06); Aβ42: APP/PS1AAV-GFP (1 ± 0.18), APP/PS1AAV-CLU (0.56 ± 0.08)). Data analyzed by Student’s t, *p < 0.05. e Amyloid plaques (blue) were surrounded by dystrophic neurites (red) in APP/PS1AAV-GFP and APP/PS1AAV-CLU mice. CLU overexpression was associated with overall reduction of neuritic dystrophy in APP/PS1 mice. Scale bar, 100 μm. f Stereological analysis of Lamp1 labeling in cortex and hippocampus of APP/PS1 mice (Cortex: APP/PS1AAV-GFP (0.73 ± 0.07), APP/PS1AAV-CLU (0.47 ± 0.06); Hippocampus: APP/PS1AAV-GFP (0.43 ± 0.05), APP/PS1AAV-CLU (0.26 ± 0.05)). N = 10 mice/group. Data are presented as mean ± S.E.M. and Student’s t tests were used to analyze cortex and hippocampus, *p < 0.05
Fig. 3
Fig. 3
Elevated CLU levels influence amyloid-associated gliosis in APP/PS1 mice. a Astrogliosis (red), determined by GFAP staining, was present in close proximity to amyloid plaques (blue) in APP/PS1 mice. Scale bar, 100 μm. b Quantification of GFAP immunoreactivity showing the significant decrease in the number of reactive astrocytes in APP/PS1AAV-CLU mice (45.44 ± 9.40) compared to controls (100 ± 21.17). N = 10 mice/group. Data are presented as mean ± S.E.M. and analyzed by Student’s t test *p < 0.05. c Real-time quantitative PCR showing a decrease in the levels of Gfap in cortex of APP/PS1AAV-CLU (0.78 ± 0.05) compared to APP/PS1AAV-GFP mice (1 ± 0.08). N = 15 mice/group. Data are presented as mean ± S.E.M. and analyzed by Student’s t test *p < 0.05. d Increased CLU expression decreases the level of microgliosis (red) associated with amyloid plaques (blue). Scale bar, 100 μm. e Quantification of IBA1 immunoreactivity presenting a reduction of microgliosis in APP/PS1AAV-CLU (68.32 ± 8.83) compared to APP/PS1AAV-GFP (100 ± 7.91). N = 10 mice/group. Data are presented as mean ± S.E.M. and analyzed by Student’s t test *p < 0.05. f RT-qPCR showing a reduction in Cst7 levels in cortex of APP/PS1AAV-CLU mice (0.65 ± 0.06) compared to APP/PS1AAV-GFP animals (1 ± 0.12). N = 15 mice/group. Data are presented as mean ± S.E.M. and analyzed by Student’s t test *p < 0.05
Fig. 4
Fig. 4
CLU haploinsufficiency leads to exaggerated deposition of amyloid plaques in APP/PS1 mice. a Representative images of fibrillar amyloid accumulation in 8-month-old APP/PS1; Clu+/+ and APP/PS1; Clu+/− mice. Scale bar, 100 μm. b-c The amount of b fibrillar (Cortex: APP/PS1; Clu+/+ (0.25 ± 0.05) and APP/PS1; Clu+/− (0.40 ± 0.05); Hippocampus: APP/PS1; Clu+/+ (0.21 ± 0.04) and APP/PS1; Clu+/− (0.45 ± 0.05)) and c diffuse amyloid plaques (Cortex: APP/PS1; Clu+/+ (0.89 ± 0.13) and APP/PS1; Clu+/− (1.01 ± 0.09); Hippocampus: APP/PS1; Clu+/+ (0.85 ± 0.14) and APP/PS1; Clu+/− (1.34 ± 0.11)) was analyzed in cortex and hippocampus. N = 7–8 mice/group. For each animal three brain sections were analyzed. Data are presented as mean ± S.E.M. and Student’s t tests were used for each brain region *p < 0.05, **p < 0.01. d The levels of soluble and insoluble Aβ in the cortex of APP/PS1 mice. N = 7–8 mice/group. Data are presented as mean ± S.E.M.: (soluble Aβ40: APP/PS1; Clu+/+ (1 ± 0.19), APP/PS1; Clu+/− (1.039 ± 0.12); soluble Aβ42: APP/PS1; Clu+/+ (1 ± 0.14), APP/PS1; Clu+/− (0.99 ± 0.13)) and insoluble (Aβ40: APP/PS1; Clu+/+ (1 ± 0.15), APP/PS1; Clu+/− (1.38 ± 0.20); Aβ42: APP/PS1; Clu+/+ (1 ± 0.14), APP/PS1; Clu+/− (1.52 ± 0.18)) Data analyzed by Student’s t test *p < 0.05. e Higher amount of neuritic dystrophy (red) was observed around amyloid plaques (blue) in APP/PS1; Clu+/+ mice. Scale bar, 100 μm. f Stereological analysis of Lamp1 labeling in cortex and hippocampus of APP/PS1; Clu+/+ ((0.69 ± 0.05), (0.46 ± 0.11) and APP/PS1; Clu+/− mice (0.95 ± 0.07) (0.79 ± 0.07). N = 7–8 mice/group. Data are presented as mean ± S.E.M. and each brain region was analyzed by Student’s t test *p < 0.05
Fig. 5
Fig. 5
CLU haploinsufficiency results in augmented gliosis. a Astrogliosis (red) is more abundant around amyloid aggregates (blue) in APP/PS1; Clu+/− mice compared to controls. Scale bar, 100 μm. b Quantification of GFAP intensity in brain sections of APP/PS1; Clu+/+ (100 ± 17.25) compared to APP/PS1; Clu+/− mice (231.1 ± 51.71). N = 7–8 mice/group. Data are presented as mean ± S.E.M. and analyzed by Student’s t test *p < 0.05. c Relative expression of Gfap levels in cortex of APP/PS1; Clu+/+ (1 ± 0.11) and APP/PS1; Clu+/− mice (1.44 ± 0.17). N = 8 mice/group. Data are presented as mean ± S.E.M. and analyzed by Student’s t test *p < 0.05. d Microgliosis (red) marked by IBA1 is associated with amyloid plaques (blue). Scale bar, 100 μm. e Quantification of IBA1 intensity in brain sections of APP/PS1 mice showing higher levels of microgliosis in APP/PS1; Clu+/− mice (138.2 ± 9.83) compared to APP/PS1; Clu+/+ mice (100 ± 14.81). N = 7–8 mice/group. Data are presented as mean ± S.E.M. and analyzed by Student’s t test *p < 0.05. f Expression levels of Cst7 in cortex of APP/PS1; Clu+/+ (1 ± 0.16) and APP/PS1; Clu+/− (1.11 ± 0.19) mice. N = 8 mice/group. Data are presented as mean ± S.E.M. and analyzed by Student’s t test

References

    1. Alzheimer’s A 2015 Alzheimer’s disease facts and figures. Alzheimers Dement. 2015;11:332–384. doi: 10.1016/j.jalz.2015.02.003. - DOI - PubMed
    1. Hardy J, Selkoe DJ. The amyloid hypothesis of Alzheimer's disease: progress and problems on the road to therapeutics. Science. 2002;297:353–356. doi: 10.1126/science.1072994. - DOI - PubMed
    1. Glenner GG, Wong CW. Alzheimer’s disease: initial report of the purification and characterization of a novel cerebrovascular amyloid protein. Biochem Biophys Res Commun. 1984;120:885–890. doi: 10.1016/S0006-291X(84)80190-4. - DOI - PubMed
    1. Vinters HV. Cerebral amyloid angiopathy. A critical review. Stroke. 1987;18:311–324. doi: 10.1161/01.STR.18.2.311. - DOI - PubMed
    1. Charidimou A, Gang Q, Werring DJ. Sporadic cerebral amyloid angiopathy revisited: recent insights into pathophysiology and clinical spectrum. J Neurol Neurosurg Psychiatry. 2012;83:124–137. doi: 10.1136/jnnp-2011-301308. - DOI - PubMed

Publication types