. 2020 Nov 27;17(1):359.
doi: 10.1186/s12974-020-02032-8.

An allosteric interleukin-1 receptor modulator mitigates inflammation and photoreceptor toxicity in a model of retinal degeneration

Affiliations

An allosteric interleukin-1 receptor modulator mitigates inflammation and photoreceptor toxicity in a model of retinal degeneration

Rabah Dabouz et al. J Neuroinflammation. .

Abstract

Background: Inflammation and particularly interleukin-1β (IL-1β), a pro-inflammatory cytokine highly secreted by activated immune cells during early AMD pathological events, contribute significantly to retinal neurodegeneration. Here, we identify specific cell types that generate IL-1β and harbor the IL-1 receptor (IL-1R) and pharmacologically validate IL-1β's contribution to neuro-retinal degeneration using the IL-1R allosteric modulator composed of the amino acid sequence rytvela (as well as the orthosteric antagonist, Kineret) in a model of blue light-induced retinal degeneration.

Methods: Mice were exposed to blue light for 6 h and sacrificed 3 days later. Mice were intraperitoneally injected with rytvela, Kineret, or vehicle twice daily for 3 days. The inflammatory markers F4/80, NLRP3, caspase-1, and IL-1β were assessed in the retinas. Single-cell RNA sequencing was used to determine the cell-specific expression patterns of retinal Il1b and Il1r1. Macrophage-induced photoreceptor death was assessed ex vivo using retinal explants co-cultured with LPS-activated bone marrow-derived macrophages. Photoreceptor cell death was evaluated by the TUNEL assay. Retinal function was assessed by flash electroretinography.

Results: Blue light markedly increased the mononuclear phagocyte recruitment and levels of inflammatory markers associated with photoreceptor death. Co-localization of NLRP3, caspase-1, and IL-1β with F4/80+ mononuclear phagocytes was clearly detected in the subretinal space, suggesting that these inflammatory cells are the main source of IL-1β. Single-cell RNA sequencing confirmed the immune-specific expression of Il1b and notably perivascular macrophages in light-challenged mice, while Il1r1 expression was found primarily in astrocytes, bipolar, and vascular cells. Retinal explants co-cultured with LPS/ATP-activated bone marrow-derived macrophages displayed a high number of TUNEL-positive photoreceptors, which was abrogated by rytvela treatment. IL-1R antagonism significantly mitigated the inflammatory response triggered in vivo by blue light exposure, and rytvela was superior to Kineret in preserving photoreceptor density and retinal function.

Conclusion: These findings substantiate the importance of IL-1β in neuro-retinal degeneration and revealed specific sources of Il1b from perivascular MPs, with its receptor Ilr1 being separately expressed on surrounding neuro-vascular and astroglial cells. They also validate the efficacy of rytvela-induced IL-1R modulation in suppressing detrimental inflammatory responses and preserving photoreceptor density and function in these conditions, reinforcing the rationale for clinical translation.

Keywords: Inflammasome; Inflammation; Interleukin-1; Interleukin-1 receptor; Photoreceptors; Retinal degeneration; Rytvela; cell death.


Conflict of interest statement

The corresponding author (SC) holds a patent on a small peptide antagonist of IL-1R, which could be useful in inflammatory ischemic retinopathies, yet this compound remains at the pre-clinical stage and the intellectual property is held by the CHU-Sainte Justine Hospital, Montreal.

Figures
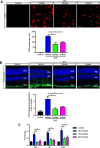
Fig. 1
Fig. 1
Subretinal macrophage infiltration and gliosis in blue light exposure to mice. a Representative images of retinal flat mounts showing infiltration of F4/80-labeled mononuclear phagocytes (red) of mice exposed or not to blue light exposure (BLE) and treated with vehicle, rytvela, or Kineret. Scale bar 50 μm. The graph represents compiled data on F4/80+ cell density in the subretina presented as a histogram. Data are expressed as mean ± SEM and analyzed by one-way ANOVA with Holm-Sidak correction for multiple comparisons; n = 4–8 per group. **p < 0.01 *p < 0.05. b Representative images of GFAP immunoreactivity (green) showing retinal gliosis in blue light-exposed animals treated with vehicle, and suppressed by rytvela and Kineret. Sections were co-stained with DAPI (blue) to show cell nuclei. Scale bar 50 μm. ONL: outer nuclear layer; INL: inner nuclear layer; GCL: retinal ganglion cell layer. The graph represents the quantitative analysis of GFAP immunofluorescence intensity compared with control light unexposed values set at mean of 1. Data are expressed as mean ± SEM and analyzed by one-way ANOVA with Holm-Sidak correction for multiple comparisons for n = 3–6 per group. **p < 0.01 (C) mRNA expression of Il1b, Il6, and Ccl2, standardized to control light unexposed values set at mean of 1. Data are expressed as mean ± SEM and analyzed by one-way ANOVA with Holm-Sidak correction for multiple comparisons for n = 3–6 per group. ***p < 0.001, **p < 0.01, *p < 0.05
Fig. 2
Fig. 2
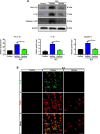
IL-1β production in blue-light-exposed mice. a Representative western blots (top panel) showing the expression of uncleaved pro-IL-1β, mature IL-1β, and cleaved caspase-1 p20 in retinal samples from blue light-exposed animals untreated (vehicle) or treated with rytvela and compared with non-illuminated animals (control). The bottom panel depicts compiled data in histogram format. Data are expressed as mean ± SEM and analyzed by independent t tests; n = 3–6 per group. **p < 0.01, *p < 0.05. b Representative images of retinal flat mounts showing co-localization of IL-1β (green) in mononuclear phagocytes F4/80+ cells (red) from blue light–exposed animals treated with vehicle or rytvela. Mice exposed to blue light and treated with rytvela displayed less IL-1β immunoreactivity; retinal samples from non-illuminated animals showed no positive reaction. n = 6 per group. Scale bar 50 μm
Fig. 3
Fig. 3
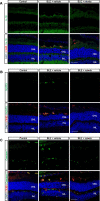
Subretinal distribution of IL-1β, inflammasome (NRLP3), and caspase-1 after blue light exposure (BLE). Representative confocal images showing co-immunoreactivity of a IL-1β (green), b NLRP3 (green), and c caspase-1 (green) with MPs F4/80+ cells (red) in the subretinal space of animals non-exposed (Control) and exposed to blue light (BLE) treated or not with rytvela. Cell nuclei were counterstained with DAPI (blue). Rytvela reduced immunoreactivity of IL-1β, NLRP3, and caspase-1. n = 45 per group. Scale bar 50 μm. ONL: outer nuclear layer; INL: inner nuclear layer
Fig. 4
Fig. 4
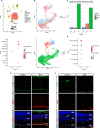
Expression of Il1b and Il1r genes across retinal cell clusters. a UMAP plot of droplet-based single-cell RNA sequencing (scRNA-seq) data obtained using 10× Genomics technology and representing retinal cell type from adult mouse retina (n = 4, 10–16 weeks). The plot shows a two-dimensional representation of global gene expression relationship among 33942 cells clustered into 12 retinal cell types (top panel). The expression levels of Il1r1 and Il1b are represented as dot plots across all the 12 cell types; larger dots indicate broader expression within the cluster; deeper red denotes a higher expression level (bottom panel). b UMAP plot of droplet-based scRNA-seq data obtained using 10× Genomics technology showing different clusters (top panel). UMAP plot of droplet-based single-cell RNA sequencing (scRNA-seq) data obtained using 10× Genomics technology and representing retinal cell types from control and light-damaged (LD) adult mouse retina. scRNA-seq data were generated on fluorescence-assisted cell sorting (FACS)-sorted live Cx3cr1YFP+ cells from pooled neuroretinas of normal (n = 5) and LD (n = 8) mice. MG: microglia; pv MFs: perivascular macrophages; mo MFs: monocyte-derived macrophages. The plot shows a two-dimensional representation of global gene expression relationship among 10582 cells clustered into 3 retinal cell types (bottom panel). c Bar plot representation of Cx3cr1YFP+ cell proportions in different conditions. d The expression levels of Il1r1 and Il1b are represented as dot plots across all the 3 immune cell types; larger dots indicate broader expression within the cluster; deeper red denotes a higher expression level. Representative confocal images showing co-immunoreactivity of IL-1R1 (green) with e GFAP+ cells (red) in the ganglion cell layer and f lectin (red). n = 4 per group. Scale bar 20 μm. ONL: outer nuclear layer; INL: inner nuclear layer; GCL: ganglion cell layer
Fig. 5
Fig. 5
Prevention of photoreceptor cell death by the IL-1R modulator rytvela. a Spider-graph quantification of ONL thickness on DAPI-stained retinal sections from non-illuminated animals (control) and from blue light–exposed mice treated with vehicle, rytvela, or Kineret. Statistical analysis was performed using the area under the curve values (to assess photoreceptor density). Data are expressed as mean ± SEM and analyzed using one-way ANOVA with Holm-Sidak correction for multiple comparisons; n = 4–5. **p < 0.01, *p < 0.05. ONL: outer nuclear layer; AUC: area under the curve. b Representative images of photoreceptor cone outer and inner segments using fluorescein-PNA (green)-stained retinas. Scale bar 50 μm. The graph illustrates the quantitative analysis of cone segment length. c Representative images of TUNEL (green)-stained retinas in control and blue light-exposed mice administrated with vehicle or rytvela. The graph illustrates the quantitative analysis of TUNEL-positive cells in the ONL. Scale bar 50 μm. Data are expressed as mean ± SEM and analyzed using one-way ANOVA with Holm-Sidak correction for multiple comparisons; n = 6 per group. ****p < 0.0001
Fig. 6
Fig. 6
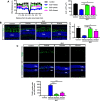
Preservation of photoreceptor function by the IL-1R modulator rytvela in light-exposed mice. Animals were exposed to blue light and treated as described in Fig 1. Flash intensities of 0.01, 0.1, 0.5, 1, and 3 cds/m2 were used in ERG analysis. Quantification of a a-wave amplitude and b b-wave amplitude of control, and blue light–exposed (BLE) mice treated or not with rytvela or Kineret. Data are expressed as mean ± SEM and analyzed using one-way ANOVA with Holm-Sidak corrections for multiple comparisons; n = 6–7 per group. ****p < 0.0001, ***p < 0.001, **p < 0.01 rytvela compared with vehicle. ##p < 0.01, #p < 0.05 Kineret compared with vehicle. c Representative waveforms of the electroretinogram recording at the flash intensity 3 cds/m2 from non-illuminated animals (control) and from blue light–exposed mice treated with vehicle, rytvela, or Kineret
Fig. 7
Fig. 7
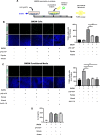
Effects of IL-1R inhibition (using rytvela and Kineret) on BMDM-induced photoreceptor toxicity. a An illustration of the experimental design used to evaluate the effects of isolated murine bone marrow-derived MPs (BMDMs) stimulated with LPS/ATP (stimulant of IL-1β secretion). b TUNEL-stained retinal flat mounts cultured in contact with BMDMs for 18 h in the presence or absence of rytvela or Kineret. Scale bar 50 μm. The graph represents the quantification of TUNEL-positive nuclei in the ONL of retinal flat mounts. Data are expressed as mean ± SEM and analyzed by one-way ANOVA with Holm-Sidak correction for multiple comparisons; n = 5–6 per group. ***p < 0.001. c TUNEL-stained retinal flat mounts cultured with the conditioned medium of LPS/ATP-activated or not BMDMs in the presence or absence of rytvela, Kineret, or an anti-IL-1β antibody. Scale bar 50 μm. The graph represents the quantification of TUNEL-positive nuclei in the ONL of retinal flat mounts. Data are expressed as mean ± SEM and analyzed by one-way ANOVA with Holm-Sidak correction for multiple comparisons; n = 3–5 per group. **p < 0.01. d ELISA measurement of IL-1β in the conditioned medium derived from BMDMs treated or not with LPS + ATP. The conditioned medium was incubated with retinal explants for 18 h in the presence of vehicle, rytvela, or Kineret. n = 4–5 per group. ND: not detected

Similar articles

Cited by

References

    1. Xu H, Chen M, Forrester JV. Para-inflammation in the aging retina. Prog Retin Eye Res. 2009;28(5):348–368. doi: 10.1016/j.preteyeres.2009.06.001. - DOI - PubMed
    1. Pfeiffer RL, Marc RE, Jones BW. Persistent remodeling and neurodegeneration in late-stage retinal degeneration. Prog Retin Eye Res. 2020;74:100771. doi: 10.1016/j.preteyeres.2019.07.004. - DOI - PMC - PubMed
    1. Clerin E, Marussig M, Sahel JA, Leveillard T. Metabolic and redox signaling of the nucleoredoxin-like-1 gene for the treatment of genetic retinal diseases. Int J Mol Sci. 2020;21(5):1625. - PMC - PubMed
    1. Canto A, Olivar T, Romero FJ, Miranda M. Nitrosative stress in retinal pathologies: review. Antioxidants (Basel). 2019;8(11):543. - PMC - PubMed
    1. Wong WL, Su X, Li X, Cheung CM, Klein R, Cheng CY, et al. Global prevalence of age-related macular degeneration and disease burden projection for 2020 and 2040: a systematic review and meta-analysis. Lancet Glob Health. 2014;2(2):e106–e116. doi: 10.1016/S2214-109X(13)70145-1. - DOI - PubMed

LinkOut - more resources