. 2020 Nov 27;11(1):6080.
doi: 10.1038/s41467-020-19486-2.

In vitro-transcribed antigen receptor mRNA nanocarriers for transient expression in circulating T cells in vivo

Affiliations

In vitro-transcribed antigen receptor mRNA nanocarriers for transient expression in circulating T cells in vivo

N N Parayath et al. Nat Commun. .

Abstract

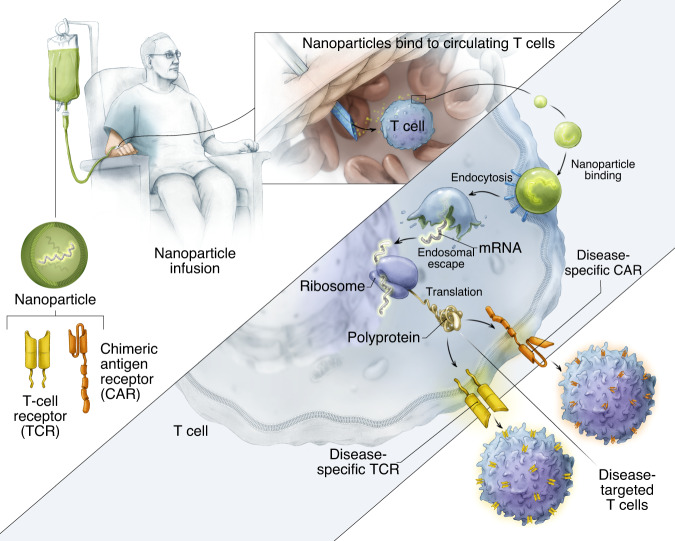
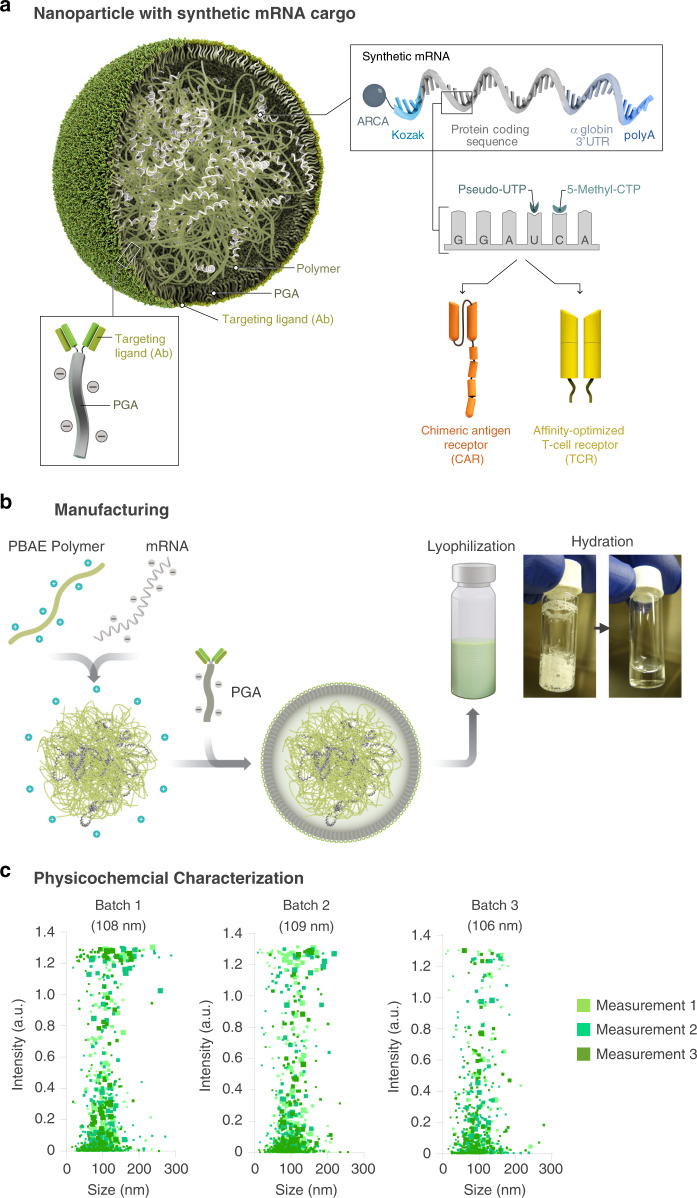
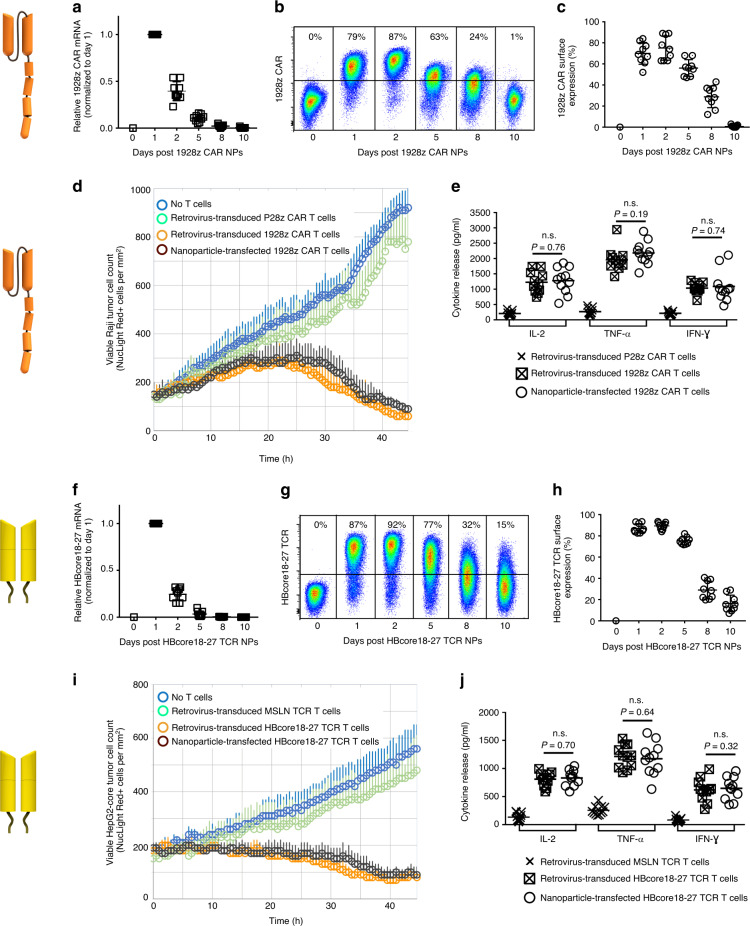
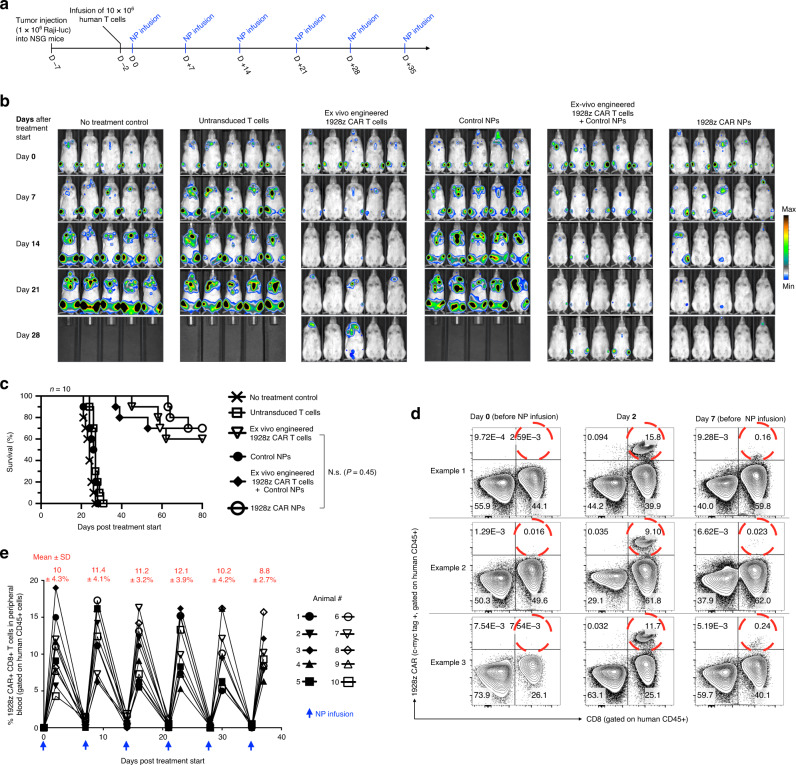
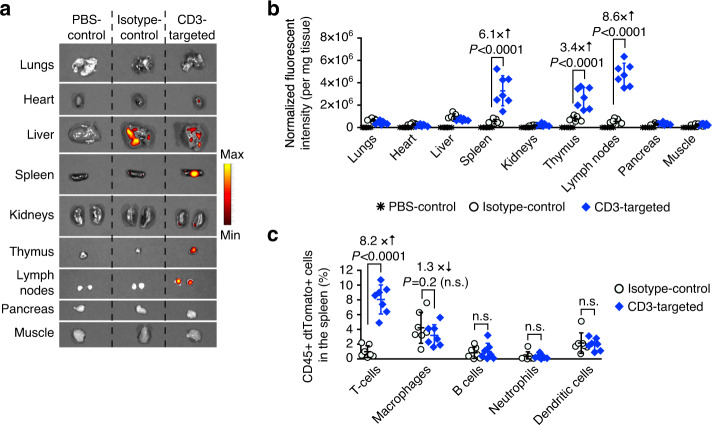
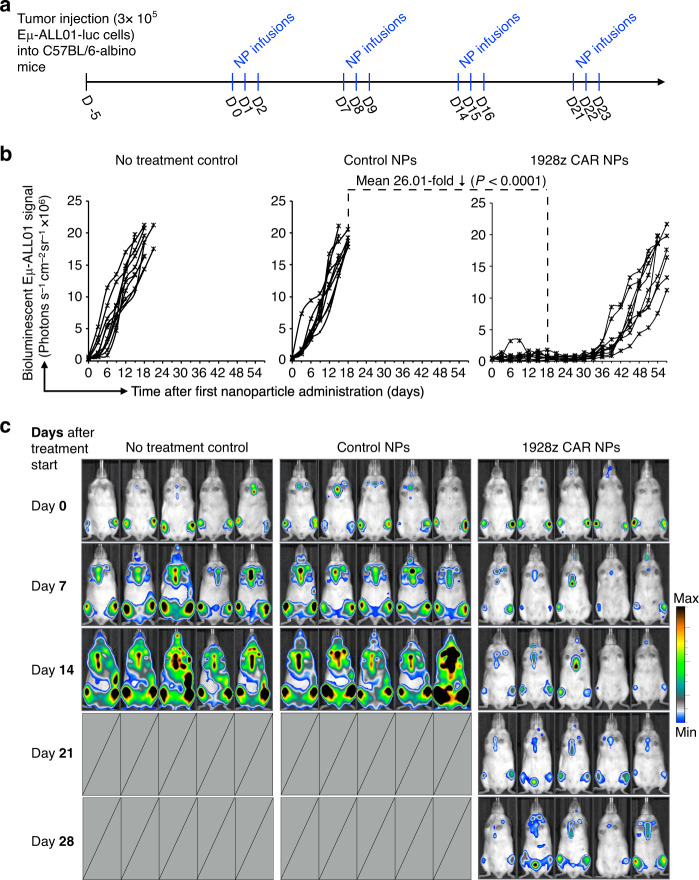
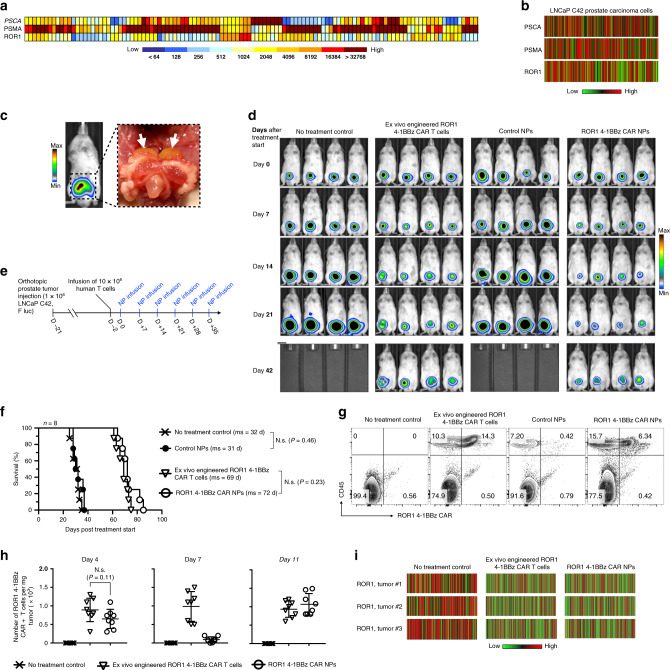
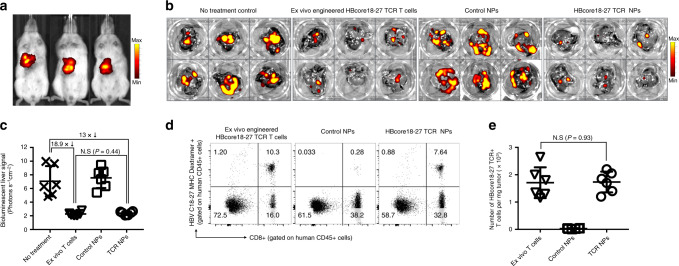
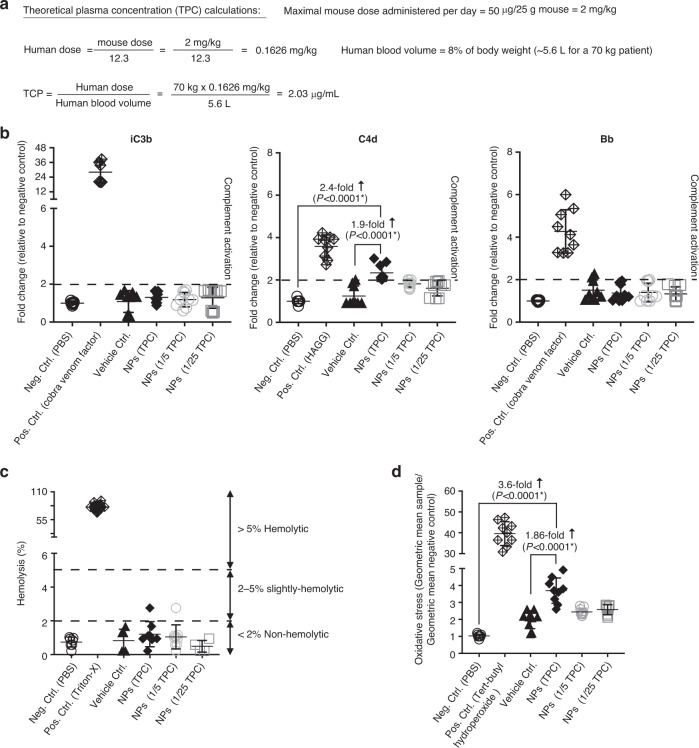
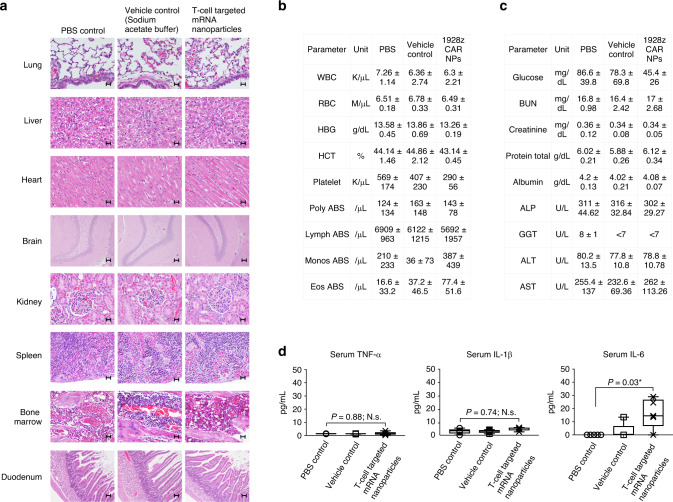
Engineering chimeric antigen receptors (CAR) or T cell receptors (TCR) helps create disease-specific T cells for targeted therapy, but the cost and rigor associated with manufacturing engineered T cells ex vivo can be prohibitive, so programing T cells in vivo may be a viable alternative. Here we report an injectable nanocarrier that delivers in vitro-transcribed (IVT) CAR or TCR mRNA for transiently reprograming of circulating T cells to recognize disease-relevant antigens. In mouse models of human leukemia, prostate cancer and hepatitis B-induced hepatocellular carcinoma, repeated infusions of these polymer nanocarriers induce sufficient host T cells expressing tumor-specific CARs or virus-specific TCRs to cause disease regression at levels similar to bolus infusions of ex vivo engineered lymphocytes. Given their ease of manufacturing, distribution and administration, these nanocarriers, and the associated platforms, could become a therapeutic for a wide range of diseases.


Conflict of interest statement

M.T.S. is a consultant of Tidal Therapeutics and holds stocks in the company. The remaining authors declare no competing interests.

Figures

Fig. 1
Fig. 1. Schematic illustrating how we reprogram T cells in situ to express disease-specific CARs or TCRs using IVT mRNA carried by polymeric nanoparticles.
These particles are coated with ligands that target them to cytotoxic T cells, so once they are infused into the patient’s circulation they can transfer the transgenes they carry into the lymphocytes and transiently program the cells to express the disease-specific CARs or TCRs on their surfaces.
Fig. 2
Fig. 2. Design and manufacture of lymphocyte-programming nanoparticles.
a Schematic of the T cell-targeted IVT mRNA nanocarrier used in our experiments. To create a reagent that can genetically modify primary T lymphocytes (which are refractory to nonviral transfection methods) simply by contact, we bioengineered polymeric nanoparticles comprised of four functional components: (i) surface-anchored targeting ligands that selectively bind the nanoparticles to T cells and initiate rapid receptor-induced endocytosis to internalize them. In our experiments we used anti-CD8 antibodies; (ii) a negatively charged coating that shields the nanoparticles to minimize off-target binding by reducing their surface charge. Because it is already widely used in drug delivery platforms, we selected polyglutamic acid (PGA) to accomplish this; (iii) a carrier matrix that condenses and protects the nucleic acids from enzymatic degradation while they are in the endosome, but releases them once the particles are transported into the cytoplasm, thereby enabling translation of the encoded protein. For this, we used a biodegradable poly(β-amino ester) (PBAE) polymer formulation that has a half-life between 1 and 7 h in aqueous conditions; and (iv) nucleic acids (IVT mRNA) that are encapsulated within the carrier and produce transient expression of the disease-specific CAR or TCR. b Diagram describing how we fabricated the nanoparticles. c Size distributions, measured using a NanoSight NS300 instrument. The mean diameter ± SD, ζ potential, and mRNA encapsulation ± SD are indicated on the top. N = 3 independently manufactured nanoparticle batches.
Fig. 3
Fig. 3. IVT mRNA nanocarriers efficiently transfect human T cells with CAR or TCR transgenes.
Isolated human CD8+ T cells were stimulated with beads that are coated with antibodies against TCR/CD3 and co-stimulatory CD28 receptors. Twenty-four hours later, beads were removed and CD8-targeted nanoparticles (NPs) containing either mRNA encoding the leukemia-specific 1928z CAR (ae) or the HBcore18-27 TCR (fj) were mixed into the cell suspension at a concentration of 3 µg of mRNA/106 cells. a qPCR measurements of relative 1928z CAR mRNA expression over time after T cells were exposed to 1928z CAR NPs. Shown are mean values ± SD. N = 9 biologically independent samples. b Flow cytometry of T cells at the indicated time points after incubation with NPs bearing 1928z CAR-encoding mRNA. c Summary plot of in vitro gene transfer efficiencies. Shown are mean values ± SD. N = 9 biologically independent samples. d In vitro assay comparing cytotoxicity of nanoparticle-transfected vs. retrovirus-transfected T cells against Raji lymphoma cells. T cells were co-cultured with Raji tumor cells at a 5:1 ratio. We used the IncuCyte Live Cell Analysis System to quantify immune cell killing of Raji NucLight Red cells by 1928z-CAR or control (P28z-CAR)-transfected T cells over time. Data are representative of two independent experiments. Each point represents the mean ± s.e.m. pooled from two independent experiments conducted in triplicate. e ELISA measurements of IL-2 (at 24 h) and TNF-α and IFN-γ (at 48 h) secretion by transfected cells. Shown are mean values ± SD; two tailed unpaired Student’s t-test. N = 9 biologically independent samples. f qPCR measurements of relative HBcore18-27 TCR mRNA expression over time after T cells were exposed to HBcore18-27 TCR NPs. Shown are mean values ± SD. N = 9 biologically independent samples. g, h Gene transfer efficiencies. i Cell killing of HepG2-core NucLight Red cells by HBcore18-27 or control (MSLN-) TCR-transfected T cells over time. T cells were co-cultured with HepG2 tumor cells at a 5:1 ratio. N = 9 biologically independent samples. j ELISA measurements of cytokine secretion by transfected cells. Shown are mean values ± SD; two tailed unpaired Student’s t-test.
Fig. 4
Fig. 4. Nanoparticle-programmed CAR lymphocytes can cause leukemia regression with efficacies similar to adoptive T-cell therapy.
a Time line and nanoparticle (NP) dosing regimen. b Sequential bioimaging of firefly luciferase-expressing Raji lymphoma cells systemically injected into NSG mice. Five representative mice from each cohort (n = 10) are shown. c Survival of animals following therapy, depicted as Kaplan–Meier curves. Shown are ten mice per treatment group pooled from three independent experiments. ms, median survival. Statistical analysis between the treated experimental and the untreated control group was performed using the Log-rank test; P < 0.05 was considered significant. d Flow cytometry of peripheral T cells before and after injection of nanoparticles delivering IVT mRNA that encodes the 1928z CAR. The three profiles for each time point shown here are representative of two independent experiments consisting of ten mice per group. e Overview graph displaying the percentages of CAR-transfected CD8+ T cells following repeated infusion of 1928z CAR NPs. Every line represents one animal. Shown are ten animals pooled from two independent experiments. Mean transfection efficiencies (±SD) for each time point are shown at the top.
Fig. 5
Fig. 5. Efficient T-cell targeting in immunocompetent mice.
B6.Cg-Gt(ROSA)26Sortm14(CAG-tdTomato)Hze/J (Ai reporter) mice were injected intravenously with three daily doses of nanoparticles loaded with 15 μg mRNA encoding nuclear localization signal (NLS)-Cre. Nanoparticles were targeted to mouse T cells using a full-length anti-CD3 MuIgG2a, or IgG2a isotype control. Both antibodies were designed as LALAPG variants to ablate Fc receptor binding and complement activation. Forty-eight hours after the final injection, organs were collected and whole-organ dtTomato fluorescence was measured using fluorescent IVIS imaging. Single cell suspensions of spleens and blood were labeled with antibodies against various immune cell subtypes and analyzed by flow cytometry. a Representative (N = 7, 1 pictured) dtTomato expression in organs under fluorescent IVIS imaging. b Quantification of fluorescent signal in each organ. Each symbol indicates one measured organ. Horizontal lines indicate mean values, and error bars represent standard deviation of the mean. Pairwise differences in fluorescent intensities between the groups were statistically analyzed by two tailed unpaired Student’s t-test. N = 7 biologically independent samples pooled from two independent experiments. c Graph displaying the mean ± SD percent of immune CD45+ dtTomato+ cell types in the spleen. Macrophages (CD45+, CD11b+, MHCII+, CD11c−, Ly6C−/low, Ly6G−), B cells (CD45+, B220+), T cells [CD4+ T cells (CD45+, TCR-β chain+, CD4+, CD8-), CD8+ T cells (CD45+, TCR-β chain+, CD4−, CD8+)], neutrophils (CD45+, CD11b+, MHCII+, CD11c−, Ly6G+), and dendritic cells (CD45+, CD11c+, CD11b−, MHCII+) were measured. Each symbol indicates one mouse. Horizontal lines indicate mean values, and error bars represent standard deviation of the mean. Pairwise differences in fluorescent intensities between the groups were statistically analyzed by two tailed unpaired Student’s t-test. N = 7 biologically independent samples.
Fig. 6
Fig. 6. Antileukemia response in immunocompetent mice.
a Time line and dosing regimen. b Plots of Eµ-ALL01 luciferase signal intensities after nanoparticle injections. Each line represents one animal and each dot reflects its whole animal photon count. Statistical differences were examined by two tailed unpaired Student’s t-test. Shown are data for ten mice per treatment condition pooled from two independent experiments. c Sequential bioimaging of firefly luciferase-expressing Eμ-ALL01 leukemia cells systemically injected into albino C57BL/6 mice. Five representative mice from each cohort (n = 10) are shown.
Fig. 7
Fig. 7. IVT-mRNA nanocarriers encoding prostate tumor-specific CARs can improve survival of mice with established disease.
a Heat map of PSCA, PSMA, and ROR1 antigen expression across a panel of 140 prostate cancer metastases showing the diversity of antigen expression. b Heat map representation of flow cytometry data showing variability in PSCA, PSMA, and ROR1 expression by LNCap C42 prostate carcinoma cells. The colors indicate expression levels in 350 randomly chosen cells. c Three weeks of postimplantation, LNCap C42 prostate tumors were visualized by in vivo bioluminescent imaging. A representative photo of established tumors in the dorsal lobes of the prostates (white arrows) is shown on the right. d Sequential bioimaging of firefly luciferase-expressing LNCap C42 prostate carcinoma cells orthotopically transplanted into the prostate of NGS mice. Four representative mice from each cohort (n = 8) are shown. e Time line and nanoparticle dosing regimen. f Survival of animals following therapy, depicted as Kaplan–Meier curves. Shown are eight mice per treatment group pooled from three independent experiments. ms, median survival. Statistical analysis between the treated experimental and the untreated control group was performed using the Log-rank test; P < 0.05 was considered significant. N.s. nonsignificant. g Multicolor flow cytometry of cells recovered from prostate tumors 11 days after treatment start. Adoptively transferred or in situ-programmed ROR1 CAR+ T cells were identified by positive labeling for CD45 and a c-myc tag incorporated in the receptor. h Absolute numbers of ROR1-CAR+ T cells that localized to tumors isolated on day 4, day 7, and day 11 after treatment start. Total cell counts of viable (trypan blue-negative) cells were multiplied by the percentage that was both RO1-CAR and CD45 positive. Shown are mean values ± SD; two tailed unpaired Student’s t-test. N = 8 biologically independent samples pooled from two independent experiments. i Flow cytometry quantification of ROR1 antigen expression on LNCaP C42 prostate tumor cells following CAR-T cell therapy or ROR1 4-1BBz CAR NP therapy. Shown are 350 randomly chosen cells pooled from five tumors.
Fig. 8
Fig. 8. In situ programming of HBV-specific T cells using nanoparticles loaded with TCR transgenes.
a We established a mouse xenograft tumor model of HBV-induced HCC. HepG2 cells stably transduced with HBcAg and luciferase were surgically injected into the liver of NSG mice reconstituted with human T cells. Three weeks post-implantation, HepG2 tumors were visualized by in vivo bioluminescent imaging and assigned to nanoparticle (6 weekly doses of 50 μg mRNA encoding the HBcore18-17 TCR) or T-cell treatment (5 × 10⁶ T cells transduced ex vivo with lentiviral vectors encoding the HBcore18-17 TCR) groups. b, c Quantification of bioluminescent liver signal 6 weeks after treatment start. Shown are mean values ± SD; two tailed unpaired Student’s t-test. N = 5 biologically independent samples. d Multicolor flow cytometry of cells recovered from the liver 18 days after treatment start. Adoptively transferred or in situ-programmed HBcore18-27 TCR+ T cells were identified by positive labeling for CD45, CD8, and MHC Pentamer. Absolute numbers are shown in e. Total cell counts of viable (trypan blue-negative) cells were multiplied by the percentage that was HBcore18–27 TCR+, CD8+, and CD45+. Shown are mean values ± SD. Pairwise differences in absolute numbers of T cells between the groups were statistically analyzed by two tailed unpaired Student’s t-test. P < 0.05 was considered significant. N.s. nonsignificant. N = 5 biologically independent samples.
Fig. 9
Fig. 9. In vitro analysis of possible infusion reactions.
a Calculation of the theoretical plasma concentration. b Hemolytic activity of T-cell-targeted mRNA nanoparticles (NPs). c Quantitative determination of complement activation by an Enzyme Immunoassay. A 2-fold change relative to the negative PBS control was defined as the assay threshold (dashed line). d Mitochondrial oxidative stress in lymphocytes following NP transfection. In all panels of this figure, N = 9 biologically independent blood samples were analyzed. Also shown are the mean values ± SD. Pairwise differences between groups were analyzed by two tailed unpaired Student’s t-test.
Fig. 10
Fig. 10. Infusions of nanocarriers are not associated with acute systemic toxicities.
Female Sprague Dawley rats were intravenously infused with CD8-targeted IVT mRNA encoding the 1928z CAR, and a full histopathological evaluation as well as serum chemistry analysis were performed 48 h later in a blinded fashion by a board-certified pathologist. a Representative H&E-stained sections of various organs isolated from controls or nanoparticle-treated animals. Scale bars, 400 µm. b Blood counts and c serum chemistry. d ELISA measurements of serum TNF-α, IL-1β, and IL-6 cytokines. On each box plot, the central mark indicates the median, and the bottom and top edges of the box indicate the interquartile range. Whiskers represent 95% confidence intervals. Two tailed unpaired Student’s t-test. N = 5 biologically independent animals/group pooled from two independent experiments.

References

    1. Park JH, et al. Long-term follow-up of CD19 CAR therapy in acute lymphoblastic leukemia. N. Engl. J. Med. 2018;378:449–459. doi: 10.1056/NEJMoa1709919. - DOI - PMC - PubMed
    1. Raje N, et al. Anti-BCMA CAR T-cell therapy bb2121 in relapsed or refractory multiple myeloma. N. Engl. J. Med. 2019;380:1726–1737. doi: 10.1056/NEJMoa1817226. - DOI - PMC - PubMed
    1. Chapuis AG, et al. T cell receptor gene therapy targeting WT1 prevents acute myeloid leukemia relapse post-transplant. Nat. Med. 2019;25:1064–1072. doi: 10.1038/s41591-019-0472-9. - DOI - PMC - PubMed
    1. Fry TJ, et al. CD22-targeted CAR T cells induce remission in B-ALL that is naive or resistant to CD19-targeted CAR immunotherapy. Nat. Med. 2018;24:20–28. doi: 10.1038/nm.4441. - DOI - PMC - PubMed
    1. Rockoff JD. The million-dollar cancer treatment: who will pay? Wall Str. J. 2018;July 10:2018.

Publication types

MeSH terms