. 2020 Nov 27;11(1):6059.
doi: 10.1038/s41467-020-19883-7.

SARS-CoV-2 genomic and subgenomic RNAs in diagnostic samples are not an indicator of active replication

Affiliations

SARS-CoV-2 genomic and subgenomic RNAs in diagnostic samples are not an indicator of active replication

Soren Alexandersen et al. Nat Commun. .

Abstract

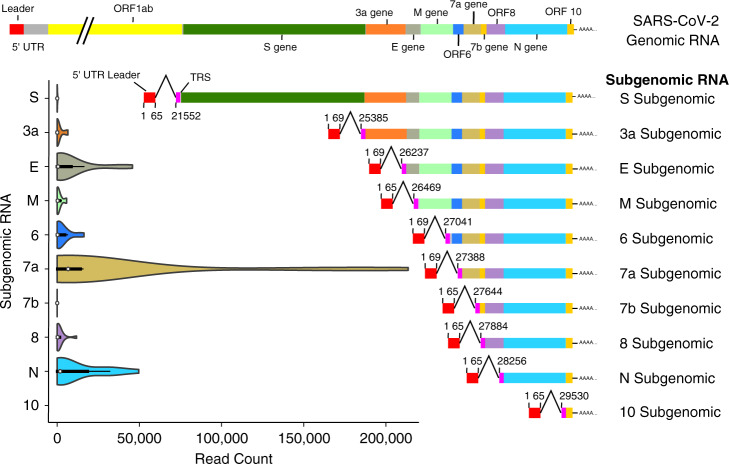
Severe acute respiratory syndrome coronavirus-2 (SARS-CoV-2) was first detected in late December 2019 and has spread worldwide. Coronaviruses are enveloped, positive sense, single-stranded RNA viruses and employ a complicated pattern of virus genome length RNA replication as well as transcription of genome length and leader containing subgenomic RNAs. Although not fully understood, both replication and transcription are thought to take place in so-called double-membrane vesicles in the cytoplasm of infected cells. Here we show detection of SARS-CoV-2 subgenomic RNAs in diagnostic samples up to 17 days after initial detection of infection and provide evidence for their nuclease resistance and protection by cellular membranes suggesting that detection of subgenomic RNAs in such samples may not be a suitable indicator of active coronavirus replication/infection.


Conflict of interest statement

The authors declare no competing or conflict of interest. The funders had no role in the design of the study; in the collection, analyses, or interpretation of data; in the writing of the manuscript, or in the decision to publish the results.

Figures

Fig. 1
Fig. 1. SARS-CoV-2 genomic and subgenomic RNA structure showing genes and open reading frames (ORF) together with violin plots showing the number of reads per total of 5 million reads in the diagnostic samples mapped to the leader-containing subgenomic RNAs in the fasta file used for mapping.
The median read count is indicated by the white dot, the interquartile range (IQR) by the thick bar, and the furthest values within 1.5*IQR indicated by the thin black line (n = 14 data points from 12 biological samples from eight individuals run once). The structure of the SARS-CoV-2 genomic RNA is shown at the top and each subgenomic RNA is illustrated next to the respective violin plot. The nucleotide positions for the leader-TRS (transcription-regulatory sequences) joining locations are indicated alongside each subgenomic RNA (numbering based on reference Wuhan-Hu-1 NC_045512.2/MN908947.3 [https://www.ncbi.nlm.nih.gov/nuccore/NC_045512.2/ and https://www.ncbi.nlm.nih.gov/nuccore/MN908947.3]). In the current study no reads mapped to the tentative Orf10 leader-containing subgenomic RNA.
Fig. 2
Fig. 2. Read count per 5 million (5 M) showing reads mapped to either the first 21,500 nucleotides (nt) of the virus genome, to the subgenomic region from nucleotide 21,500 onward, to subgenomic RNA containing the leader sequence, to the included cellular control mRNA amplicons and reads not mapped to any of these.
n = 15 data points from 13 biological samples from nine individuals run once.
Fig. 3
Fig. 3. Violin plot showing the estimated ratio of virus genomic reads to subgenomic reads containing the leader for each of the diagnostic samples included in the study.
The ratio is estimated in different ways, including comparing a the total reads for the first 21,500 nucleotides of the virus genome with the total number of subgenomic reads; b the most abundant amplicon in the first 21,500 nt of the virus genome with the most abundant subgenomic RNA amplicon reads; c the most abundant full virus genome amplicon with the most abundant subgenomic RNA amplicon reads; and d the average full virus amplicons reads with the average subgenomic RNA amplicons reads. The median read count ratio is indicated by the white dot, the interquartile range (IQR) by the thick bar, and the furthest values within 1.5*IQR indicated by the thin black line (n = 14 data points from 12 biological samples from eight individuals run once).
Fig. 4
Fig. 4. Genomic and subgenomic PCR values shown as 40 minus Ct (40-Ct).
The values are shown for each sample and for the four in-house PCRs detecting 7a subgenomic RNA only, 7a total RNA (i.e., genomic RNA and subgenomic RNA up to and including 7a), the 5′-UTR (untranslated region) leader or the 5′UTR. NTC non-template control (water).

References

    1. Hui DS, et al. The continuing 2019-nCoV epidemic threat of novel coronaviruses to global health- the latest 2019 novel coronavirus outbreak in Wuhan, China. Int. J. Infect. Dis. 2020;91:264–266. doi: 10.1016/j.ijid.2020.01.009. - DOI - PMC - PubMed
    1. Wu F, et al. A new coronavirus associated with human respiratory disease in China. Nature. 2020;579:265–269. doi: 10.1038/s41586-020-2008-3. - DOI - PMC - PubMed
    1. Chan JF, et al. A familial cluster of pneumonia associated with the 2019 novel coronavirus indicating person-to-person transmission: a study of a family cluster. Lancet. 2020;395:514–523. doi: 10.1016/S0140-6736(20)30154-9. - DOI - PMC - PubMed
    1. Dong E, Du H, Gardner L. An interactive web-based dashboard to track COVID-19 in real time. Lancet Infect. Dis. 2020;20:533–534. doi: 10.1016/S1473-3099(20)30120-1. - DOI - PMC - PubMed
    1. Coronaviridae Study Group of the International Committee on Taxonomy of, V. The species Severe acute respiratory syndrome-related coronavirus: classifying 2019-nCoV and naming it SARS-CoV-2. Nat. Microbiol. 2020;5:536–544. doi: 10.1038/s41564-020-0695-z. - DOI - PMC - PubMed

Publication types

MeSH terms