. 2020 Nov 27;11(1):6083.
doi: 10.1038/s41467-020-19855-x.

Tumor evolutionary trajectories during the acquisition of invasiveness in early stage lung adenocarcinoma

Affiliations

Tumor evolutionary trajectories during the acquisition of invasiveness in early stage lung adenocarcinoma

Siwei Wang et al. Nat Commun. .

Abstract

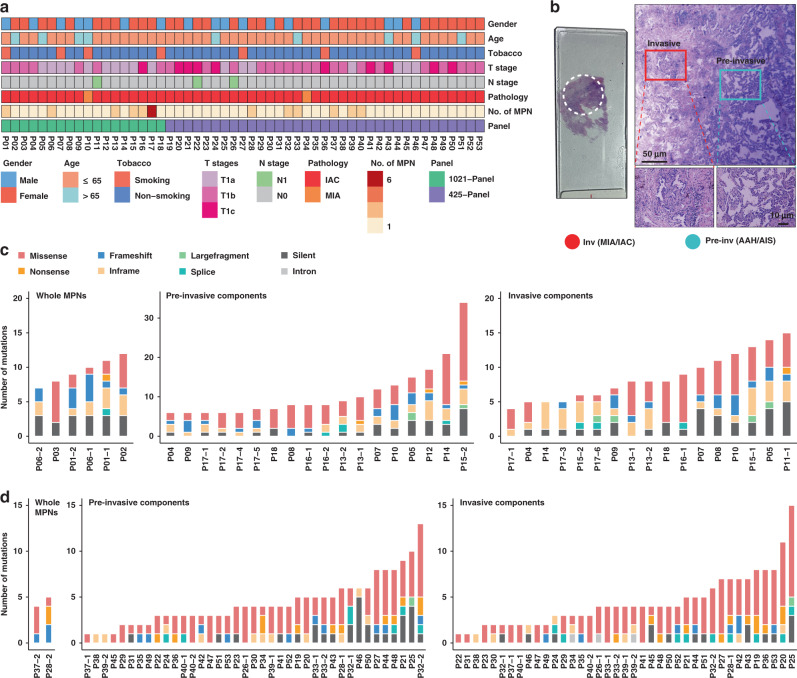
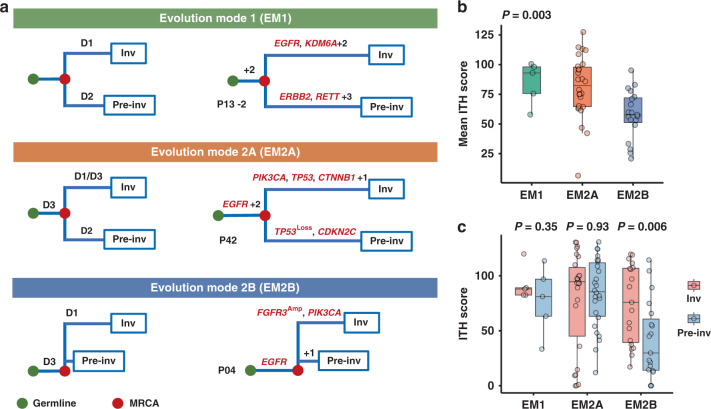
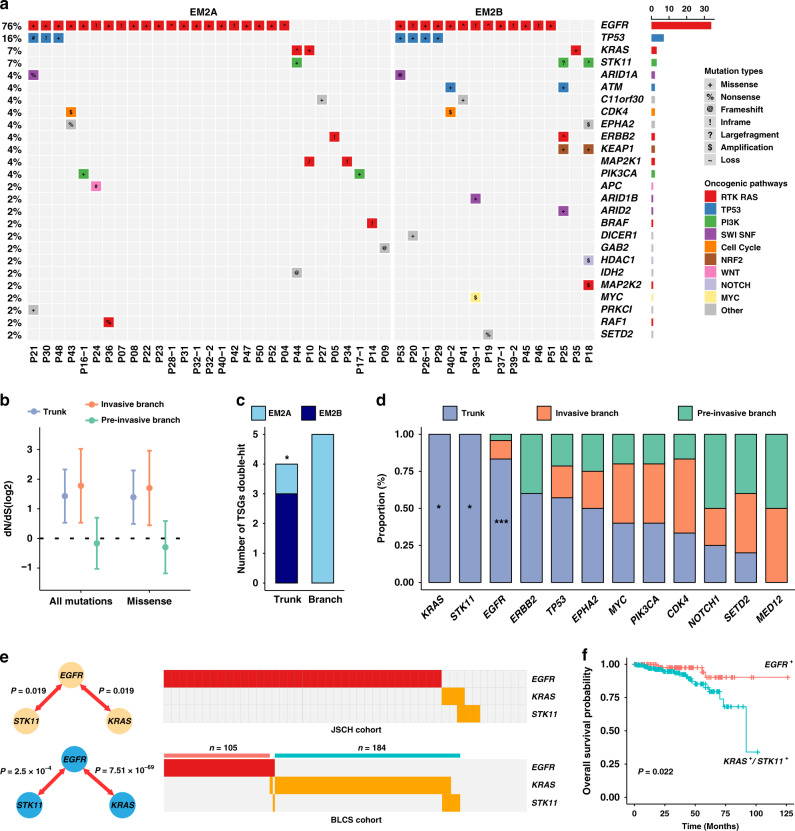
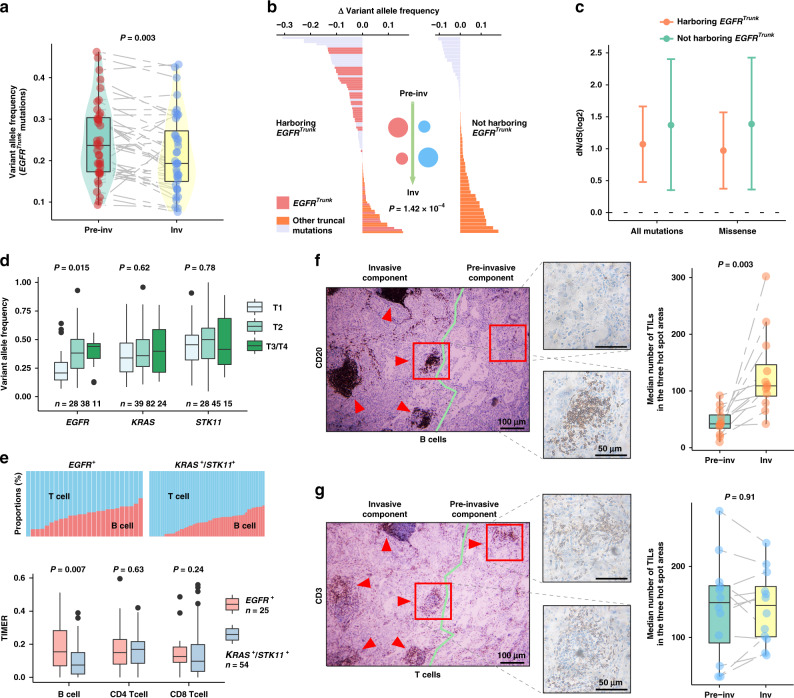
The evolutionary trajectories of early lung adenocarcinoma (LUAD) have not been fully elucidated. We hypothesize that genomic analysis between pre-invasive and invasive components will facilitate the description of LUAD evolutionary patterns. We micro-dissect malignant pulmonary nodules (MPNs) into paired pre-invasive and invasive components for panel-genomic sequencing and recognize three evolutionary trajectories. Evolutionary mode 1 (EM1) demonstrates none of the common driver events between paired components, but another two modes, EM2A and EM2B, exhibit critical private alterations restricted to pre-invasive and invasive components, respectively. When ancestral clones harbor EGFR mutations, truncal mutation abundance significantly decrease after the acquisition of invasiveness, which may be associated with the intratumoral accumulation of infiltrated B cells. Harboring EGFR mutations is critical to the selective pressure and further impacts the prognosis. Our findings extend the understanding of evolutionary trajectories during invasiveness acquisition in early LUAD.


Conflict of interest statement

The authors declare no competing interests.

Figures

Fig. 1
Fig. 1. Clinicopathological characteristics and genomic sequencing of micro-dissected MPNs.
a Clinicopathologic characteristics of the included 53 T1 stage LUAD patients. b Micro-dissection was performed to separate pre-invasive and invasive components within MPNs. c, d Number and type of somatic mutations detected in 6 whole MPNs and 35 micro-dissected MPN components of the cases using 1021-panel (Phase 1; c), and somatic mutations detected in 2 whole MPNs and 78 micro-dissected MPN components of the cases using 425-panel (Phase 2; d). Inv Invasive, Pre-Inv pre-invasive, AAH atypical adenomatous hyperplasia, AIS adenocarcinoma in situ, MIA minimally invasive adenocarcinoma, IAC invasive adenocarcinoma.
Fig. 2
Fig. 2. Phylogenetic analyses within MPNs.
a Evolutionary trajectories of pre-invasive and adjacent invasive MPN components. For each of the three evolutionary patterns, D1, D2, and D3 indicate three hypothetical key molecular events in trunk and branches of phylogenetic tree; green dots represent the germline and red dots represent the most recent common ancestor (MRCA) for each pair of components. In evolution mode 1 (EM1), none of driver mutations are shared and D1 and D2 indicate different private driver alterations (Supplementary Fig. 4a), and JSCH P13-2 is a representative MPN. In evolution mode 2 (EM2), MRCA harbors critical common events (D3). Private driver alterations of D2 and D1 are restricted to the pre-invasive component (EM2A; Supplementary Fig. 4b) and the invasive component (EM2B; Supplementary Fig. 4c), respectively. Phylogenetic trees of JSCH P42 and P04 are shown to represent EM2A and EM2B separately. b Mean intratumor heterogeneity (ITH) score of 50 paired pre-invasive and adjacent invasive components suggests phenotypic differences including EM1 (MPNs, n = 5), EM2A (MPNs, n = 26), and EM2B (MPNs, n = 19). The differences were assessed using Kruskal–Wallis H test. c Comparisons of ITH levels between 50 paired pre-invasive and invasive components were performed using two-sided Wilcoxon Rank-Sum test. The box plot displays the first and third quartiles (top and bottom of the boxes), median (band inside the boxes), and lowest and highest point within 1.5 times the interquartile range of the lower and higher quartile (whiskers). Inv, Invasive and Pre-Inv, Pre-invasive.
Fig. 3
Fig. 3. Dominant drivers in truncal genes are associated with clinical outcomes.
a Mutational spectrum of recurrent non-synonymous truncal mutations. Truncal genes were defined according to known oncogenic pathways identical to those previously reported (see “Methods” section). b The ratios of nonsynonymous to synonymous mutations among trunks, pre-invasive, and invasive branches among all MPNs (n = 52). The dN/dS ratios of all nonsynonymous mutations or missense mutations relative to synonymous mutations are shown (on log2 scale). Circles and vertical lines correspond to the mean and 95% confidence intervals of the dN/dS ratio, respectively. c Differences in tumor suppressor gene (TSG) double-hit events, including gene loss, homozygotic mutation and LOH plus mutation, between EM2A (MPNs, n = 26) and EM2B (MPNs, n = 19) were compared using two-sided Fisher’s exact test (P = 0.048). d The proportions of truncal and branching mutations in each of the recurrent driver genes of EM2 (MPNs, n = 45). Corresponding P values calculated by two-sided Fisher’s exact test in KRAS, STK11, and EGFR were 0.035, 0.035, and 6.96 × 10-8, respectively. e Mutually exclusive analyses of truncal mutations in the JSCH cohort and driver mutations in the BLCS cohort, which suggest two typical clusters of LUAD patients. P value was calculated using pair-wise Fisher’s exact test. f Kaplan–Meier curves using the BLCS cohort to compare the prognosis between EGFR- and KRAS/STK11-mutated T1 stage cases in BLCS cohort. P value was calculated using log-rank test is indicated. ***P < 0.001; *P < 0.05.
Fig. 4
Fig. 4. Strong selective pressure derived from B cell infiltration in MPNs harboring truncal EGFR mutation.
a Variant allele frequency (VAF) of identified truncal EGFR mutations in 36 paired pre-invasive and adjacent invasive components. Differences were assessed using the two-sided Wilcoxon rank-sum test. b Mutant abundance change of identified truncal mutations between two components in EM2, according to whether they harbored truncal EGFR mutations. Red and blue circles represent the putative truncal clone abundance of two groups during the invasive progression, respectively. P value was derived from two-sided Wilcoxon rank-sum test. c The dN/dS ratios inferred for 36 MPNs harboring and 11 MPNs not harboring truncal EGFR mutations. These ratios were obtained as described for Fig. 3b. Circles and vertical lines correspond to the mean and 95% confidence intervals of the dN/dS ratio, respectively. d Mutation abundance in EGFR, KRAS, and STK11 mutations in the TCGA LUAD data for patients of stages T1–4. Differences among stages were assessed by Kruskal–Wallis H test. e Comparisons of T cells and B cells between EGFR- and KRAS/STK11-mutated groups using TIMER inflammatory infiltration in T1 stage cases of TCGA. P value, two-sided Wilcoxon rank-sum test. f, g Representative sliced IHC images of B cells f and T cells g in 12 EGFR-mutated patients. Two-sided Wilcoxon rank-sum test was used for paired invasive and pre-invasive components. Bar, median; box, 25th–75th percentiles (interquartile range, IQR); vertical line, data within 1.5 times the IQR. Inv Invasive and Pre-inv Pre-invasive.

References

    1. Bray F, et al. Global cancer statistics 2018: GLOBOCAN estimates of incidence and mortality worldwide for 36 cancers in 185 countries. CA Cancer J. Clin. 2018;68:394–424. doi: 10.3322/caac.21492. - DOI - PubMed
    1. Church TR, et al. Results of initial low-dose computed tomographic screening for lung cancer. N. Engl. J. Med. 2013;368:1980–1991. doi: 10.1056/NEJMoa1209120. - DOI - PMC - PubMed
    1. Okami J, et al. Demographics, safety and quality, and prognostic information in both the seventh and eighth editions of the TNM Classification in 18,973 surgical cases of the Japanese Joint Committee of Lung Cancer Registry Database in 2010. J. Thorac. Oncol. 2019;14:212–222. doi: 10.1016/j.jtho.2018.10.002. - DOI - PubMed
    1. Takahashi M, et al. Tumor invasiveness as defined by the newly proposed IASLC/ATS/ERS classification has prognostic significance for pathologic stage IA lung adenocarcinoma and can be predicted by radiologic parameters. J. Thorac. Cardiovasc. Surg. 2014;147:54–59. doi: 10.1016/j.jtcvs.2013.08.058. - DOI - PubMed
    1. Travis WD, et al. International Association for the Study of Lung Cancer/American Thoracic Society/European Respiratory Society International Multidisciplinary Classification of Lung Adenocarcinoma. J. Thorac. Oncol. 2011;6:244–285. doi: 10.1097/JTO.0b013e318206a221. - DOI - PMC - PubMed

Publication types