. 2020 Nov 27;11(1):6057.
doi: 10.1038/s41467-020-19882-8.

Feedback regulation of crystal growth by buffering monomer concentration

Affiliations

Feedback regulation of crystal growth by buffering monomer concentration

Samuel W Schaffter et al. Nat Commun. .

Abstract

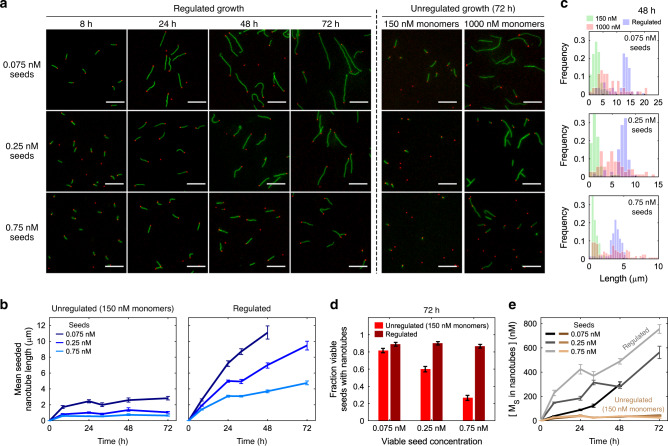
Crystallization is a ubiquitous means of self-assembly that can organize matter over length scales orders of magnitude larger than those of the monomer units. Yet crystallization is notoriously difficult to control because it is exquisitely sensitive to monomer concentration, which changes as monomers are depleted during growth. Living cells control crystallization using chemical reaction networks that offset depletion by synthesizing or activating monomers to regulate monomer concentration, stabilizing growth conditions even as depletion rates change, and thus reliably yielding desired products. Using DNA nanotubes as a model system, here we show that coupling a generic reversible bimolecular monomer buffering reaction to a crystallization process leads to reliable growth of large, uniformly sized crystals even when crystal growth rates change over time. Buffering could be applied broadly as a simple means to regulate and sustain batch crystallization and could facilitate the self-assembly of complex, hierarchical synthetic structures.


Conflict of interest statement

The authors declare no competing interests.

Figures

Fig. 1
Fig. 1. Crystal size, size dispersity, and quality are shaped by growth conditions, such as the initial monomer concentration and how fast monomers are depleted during crystallization.
Schematics show 3D crystals (blue) growing in the presence of seeds (red). a Far above the critical monomer concentration, new crystals homogeneously nucleate (i.e., not from seeds) continuously while other crystals grow. As a result, the crystals that form exhibit high size dispersity. Under these conditions, monomer addition to crystals is  strongly forward biased, which means that crystals retain defects that form during growth. b When crystals are grown at a monomer concentration just above the critical monomer concentration, no homogenous nucleation occurs and crystals grow uniformly from seeds. However, crystals remain small because the monomer concentration rapidly reaches the critical concentration, halting growth. c When monomer concentration is regulated by a chemical feedback loop that holds the monomer concentration just above the critical concentration even as monomers are depleted by crystal growth, sustained growth of large, uniformly disperse crystals can be achieved.
Fig. 2
Fig. 2. DNA nanotubes and unregulated DNA nanotube growth.
a Left: DNA monomers are composed of five DNA strands folded into rigid double crossover structures. Right: Two monomer types co-assemble to form a cylindrical lattice via Watson–Crick hybridization of monomer sticky ends. b A DNA origami seed that presents monomer sticky ends at one edge (inset) acts as a stable nucleus from which nanotubes can grow without a significant energy barrier to nucleation. c At high monomer concentrations, spontaneous nanotube nucleation, growth, and joining all occur (regime I.). At intermediate monomer concentrations, DNA nanotubes nucleate and grow from seeds but spontaneous nucleation is rare (regime II.). The presence of a small energy barrier to nucleation from the seeds results in a regime where growth from existing nanotubes is favorable but nucleation from additional seeds is rare (regime III.). At monomer concentrations below the critical concentation, no nanotube growth occurs (regime IV.). Fluorescence micrographs depict nanotubes (green) and seeds (red) after 24 h of growth at different initial monomer concentrations. Scale bars 10 µm. Supplementary Note 6 describes how the cutoffs for growth regimes were determined. df Results of experimental and simulated nanotube growth with 150 nM monomers at different seed concentrations (see “Methods” and Supplementary Note 4). d Mean lengths of seeded nanotubes measured in experiments (solid lines) and simulations (dashed lines). Error bars represent 95% confidence intervals from bootstrapping. e Fractions of viable seeds (Supplementary Note 7) that nucleated nanotubes after 72 h. Error bars on proportions represent 95% confidence intervals. The sample sizes (at least 50 nanotubes and seeds) for every timepoint of each sample are tabulated in Supplementary Note 14. f Free S monomer concentrations during simulations of growth. Shaded regions correspond to the growth regimes in c. Ideal regulation results in df are from simulations of nanotube growth without monomer depletion.
Fig. 3
Fig. 3. Regulating nanotube growth by buffering monomer concentrations.
a Schematic of a feedback controller for regulating growth. An ideal controller could maintain the monomer concentration within the seeded nucleation and growth regime by converting inactive monomers into active monomers as monomers are depleted by growth. b Overview of a scheme to regulate nanotube growth by buffering monomer concentrations via reversible conversion of monomers in inactive and active states. c Monomer buffering provides setpoint and feedback control. Top: The setpoint is determined by the equilibrium monomer concentration. A large concentration of I, P, and C can be used to regulate a low concentration of M. Bottom: Feedback is provided by Le Chatelier’s principle. As monomer concentration decreases during growth, the monomer buffering reaction will produce more active monomers to rebalance the forward and reverse reaction rates, thereby resisting a change in equilibrium. d A DNA strand displacement reaction network for buffering S monomer concentrations. An inactive monomer complex (IS) reacts with a Producer complex (PS) via a strand displacement reaction initiated by a single-stranded toehold domain (THf, S) to produce an active monomer (MS) and Consumer strand (CS). CS can react with an active monomer via another toehold domain (THr, S) to reverse the active monomer production reaction. Numbers indicate domain lengths in bases. An analogous network was also designed for the R monomers (Supplementary Fig. 12).
Fig. 4
Fig. 4. Effects of buffer-regulated growth predicted by kinetic simulations.
a Buffer-regulated growth reduces the rate at which the free monomer concentration decreases during a nanotube growth process. Shaded regions correspond to the growth regimes in Fig. 2c. The concentration of the S monomer is shown; depletion of the two monomer types should happen at the same rate. In regulated growth, the free MS concentration starts at zero and quickly equilibrates to the setpoint concentration. b Compared to unregulated growth with 150 nM monomers (left plots), nanotubes are predicted to grow much longer during buffer-regulated growth (right plots). c Predicted fractions of viable seeds with nanotubes after 72 h of buffer-regulated, unregulated and ideal (no depletion) growth. d Predicted changes in free MS concentration as a function of the total concentration of MS incorporated into nanotubes. Without regulation, free monomer concentration decreases at the same rate as monomer incorporation (slope = −1); less-negative slopes indicate resistance to monomer depletion. For ideal regulation, there would be no change in free monomer concentration (slope = 0). The green dashed lines show the change in MS vs. total monomer incorporation during buffer-regulated growth. These lines have the same slope for all seed concentrations (and therefore overlap) because the amount the setpoint drops per MS incorporated is a constant irrespective of load. The slope of these overlapping lines is the depletion ratio. The red line indicates the critical monomer concentration for growth. When the change in free MS reaches this line, growth will stop. The higher the seed concentration the faster this line will be reached and the buffer exhausted. This analysis indicates that buffer-regulated growth is predicted to incorporate nearly 10-fold more monomers into nanotubes than unregulated growth (roughly 360 nM vs. 40 nM, respectively). In unregulated growth simulations, the initial monomer concentrations were each 155 nM. Regulated growth simulations were conducted with [Ii]o = [Pi]o = 5.5 µM and [Ci]o = 1.69 µM for both R and S monomers, resulting in a setpoint active monomer concentration of 155 nM. See Supplementary Note 9 for additional simulation details.
Fig. 5
Fig. 5. Comparing unregulated DNA nanotube growth with buffer-regulated growth.
a Fluorescence micrographs of DNA nanotubes after different durations of unregulated or buffer-regulated growth. Scale bars: 10 µm. b Mean lengths of seeded nanotubes during unregulated (left) or buffer-regulated growth (right) (Methods, Supplementary Fig. 18). Error bars represent 95% confidence intervals from bootstrapping. c Distributions of seeded nanotube lengths after 48 h from the experiments presented in a. For distributions of nanotube lengths at other timepoints, see Supplementary Fig. 19. d Fractions of viable seeds with nanotubes after 72 h of growth. Experimental variation (possibly due to pipetting) and sampling errors introduced slight variations in the fractions of viable seeds with nanotubes across timepoints; at most timepoints regulated growth resulted in a fraction near 1. The fractions for all timepoints are shown in Supplementary Fig. 10. Error bars on proportions represent 95% confidence intervals. e Mean concentrations of MS incorporated into nanotubes during growth. This value is roughly 35–40 nM for unregulated growth at all seed concentrations. Error bars represent standard deviation across images. Regulated growth experiments were conducted with [Ii]o = [Pi]o = 5.5 µM and [Ci]o = 1.25 µM for both monomer types. The sample sizes for every timepoint of each sample are tabulated in Supplementary Note 14.
Fig. 6
Fig. 6. Feedback regulation maintains growth within the seeded growth regime even as load changes during growth.
a Fluorescence micrographs of seeded nanotubes during unregulated (top panel) or buffer-regulated (bottom panel) growth where 0.075 nM viable S1 seeds (red) were added at the beginning of the experiment and 0.075 nM viable S2 seeds (blue) were added after 24 h (increasing the load). S1 and S2 seeds differ only in their fluorescent labels. S2 seeds are circled in white for clarity. b Mean lengths of S1- and S2-seeded nanotubes during regulated and unregulated growth with a load increase. Error bars represent 95% confidence intervals from bootstrapping. c Fractions of S1 and S2 seeds with attached nanotubes during regulated and unregulated growth. Error bars on proportions represent 95% confidence intervals. d Fluorescence micrographs of seeded nanotubes during buffer-regulated growth with DNA origami caps added (0.2 nM) after either 8 (top panel) or 24 h (middle panel) to remove load. Caps are shown in yellow and circled in white for clarity. e Mean lengths of seeded nanotubes during buffer-regulated growth with and without load removal for the samples in d. Error bars represent 95% confidence intervals from bootstrapping. f Fractions of nanotubes not attached to seeds during buffer-regulated growth with and without the addition of caps. Error bars on proportions represent 95% confidence intervals. The 15–20% of nanotubes without seeds in all samples at all timepoints is likely the result of homogeneous nanotube nucleation. This level of background unseeded growth is consistent with other experiments for regulated and unregulated growth with 150 nM monomers (Supplementary Fig. 19). The sample sizes for every timepoint of each sample are tabulated in Supplementary Note 14. Unregulated growth reactions used 150 nM monomers. Regulated growth experiments were conducted with [Ii]o = [Pi]o = 5.5 µM and [Ci]o = 1.25 µM for both monomer types. All scale bars: 10 µm.
Fig. 7
Fig. 7. Monomer buffering appears to be slower than nanotube growth for our selected concentrations of monomer buffering species.
a, b Mean seeded nanotube lengths measured in experiments (solid lines) or simulations (dashed lines) during buffer-regulated growth. Error bars represent 95% confidence intervals from bootstrapping. c, d S monomer concentrations during simulations of buffer-regulated growth (dashed lines). Solid lines represent the theoretical equilibrium S monomer concentrations over the course of the experiments (Supplementary Note 8). Regulated growth simulations were conducted as described in Supplementary Note 9 with [Ii]o = [Pi]o = 5.5 µM and [Ci]o = 1.25 µM for both monomer types. The forward and reverse buffering rate constants were 1 × 102 and 1 × 104 M−1 s−1, respectively, for the simulations where monomer buffering was faster than growth (left panels) and 1 ×  100 and 1 × 102 M−1 s−1 for the simulations where monomer buffering was slower than growth (right panels). See Supplementary Note 11 for additional simulation details.

Similar articles

Cited by

References

    1. Davey, R. & Garside, J. From Molecules to Crystallizers. (Oxford University Press, 2000).
    1. McPherson A, Gavira JA. Introduction to protein crystallization. Acta Crystallogr. F. Struct. Biol. Commun. 2014;70:2–20. doi: 10.1107/S2053230X13033141. - DOI - PMC - PubMed
    1. Deschamps JR. X-ray crystallography of chemical compounds. Life Sci. 2010;86:585–589. doi: 10.1016/j.lfs.2009.02.028. - DOI - PMC - PubMed
    1. Thanh NTK, Maclean N, Mahiddine S. Mechanisms of nucleation and growth of nanoparticles in solution. Chem. Rev. 2014;114:7610–7630. doi: 10.1021/cr400544s. - DOI - PubMed
    1. Sharma N, Ojha H, Bharadwaj A, Pathak DP, Sharma RK. Preparation and catalytic applications of nanomaterials: a review. RSC Adv. 2015;5:53381–53403. doi: 10.1039/C5RA06778B. - DOI

Publication types