. 2020 Nov 27;11(1):6053.
doi: 10.1038/s41467-020-19879-3.

Trans- and cis-acting effects of Firre on epigenetic features of the inactive X chromosome

Affiliations

Trans- and cis-acting effects of Firre on epigenetic features of the inactive X chromosome

He Fang et al. Nat Commun. .

Abstract

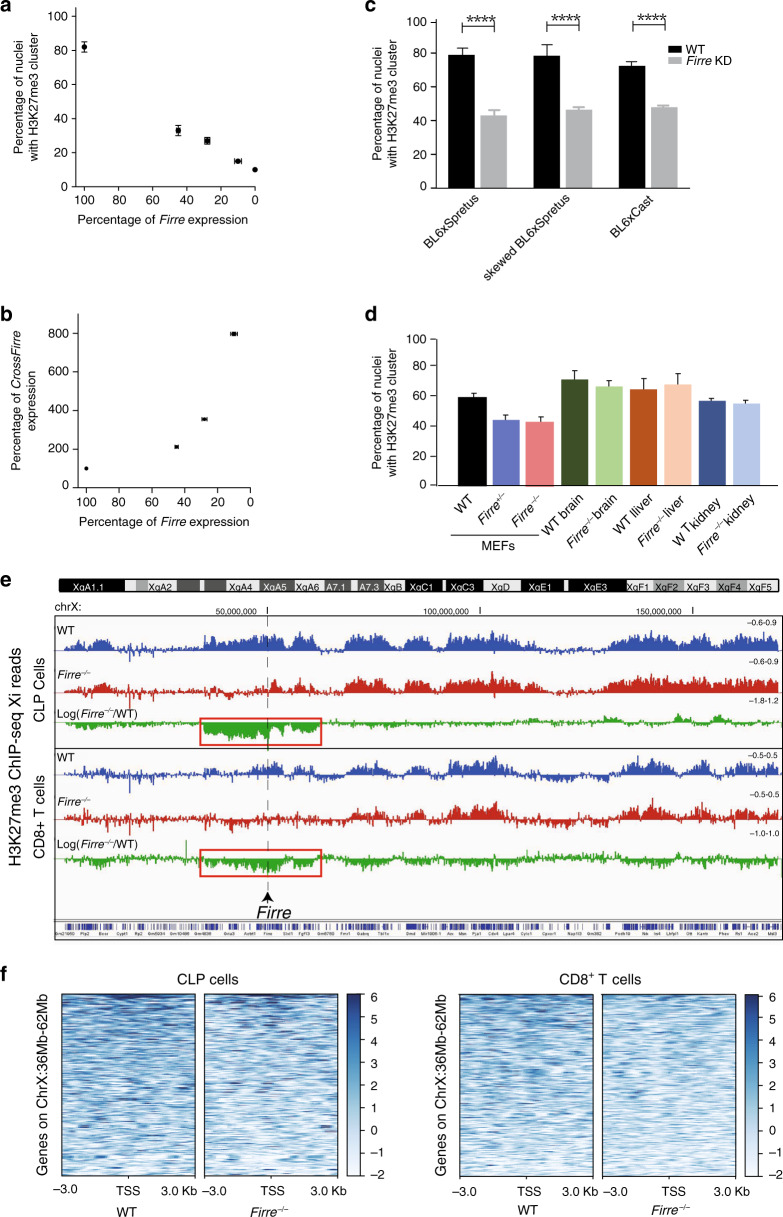
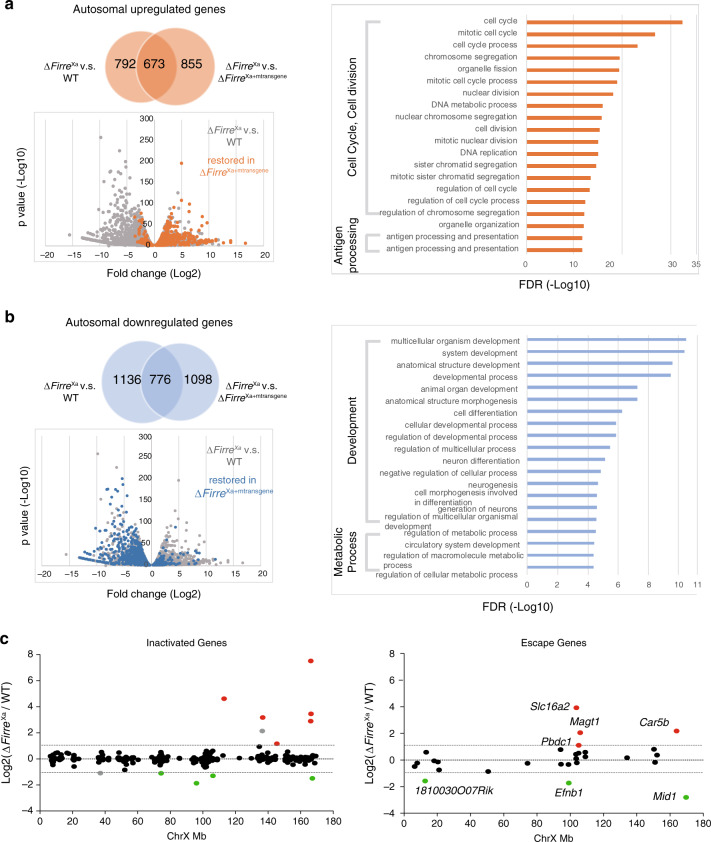
Firre encodes a lncRNA involved in nuclear organization. Here, we show that Firre RNA expressed from the active X chromosome maintains histone H3K27me3 enrichment on the inactive X chromosome (Xi) in somatic cells. This trans-acting effect involves SUZ12, reflecting interactions between Firre RNA and components of the Polycomb repressive complexes. Without Firre RNA, H3K27me3 decreases on the Xi and the Xi-perinucleolar location is disrupted, possibly due to decreased CTCF binding on the Xi. We also observe widespread gene dysregulation, but not on the Xi. These effects are measurably rescued by ectopic expression of mouse or human Firre/FIRRE transgenes, supporting conserved trans-acting roles. We also find that the compact 3D structure of the Xi partly depends on the Firre locus and its RNA. In common lymphoid progenitors and T-cells Firre exerts a cis-acting effect on maintenance of H3K27me3 in a 26 Mb region around the locus, demonstrating cell type-specific trans- and cis-acting roles of this lncRNA.


Conflict of interest statement

The authors declare no competing interests.

Figures

Fig. 1
Fig. 1. Firre and CrossFirre are expressed from the Xa.
a Genomic location of Firre and CrossFirre (Gm35612) on the mouse X chromosome (UCSC mm10 build 38 browser tracks). Note that Firre has multiple alternative transcripts. The locations of the CRISPR guide RNAs used to edit the locus (cut), and of the RT-PCR primer pairs to specifically detect Firre expression (F/R), strand-specific expression of CrossFirre (F1/R1), or strand-specific expression in a region of overlap between Firre and CrossFirre (F2/R2) are indicated. b RT-PCR analysis using the F/R primer pair detects Firre expression in WT, ΔFirreXi, and InvFirreXi, but not in ΔFirreXa. Firre expression was measured in n = 3 biologically independent samples per cell type. c Sanger sequencing analyses of a CrossFirre region (F1/R1) and of a region of overlap between Firre and CrossFirre (F2/R2) confirm heterozygosity of SNPs (BL6 on the Xi and spretus on the Xa) in each region assayed. Genomic DNA (gDNA) shows heterozygosity at the SNPs, while cDNA only shows expression from the spretus SNP (Xa). d Strand-specific analysis of CrossFirre and Firre was done using reverse transcription using either random primers, or F1, R1, F2, R2 primers, followed by PCR using F1/R1 or F2/R2 primer pairs. Firre and CrossFirre expression was measured in n = 3 biologically independent samples per cell type. Source data are provided as a Source Data file.
Fig. 2
Fig. 2. Firre RNA acts in trans to maintain H3K27me3 on the Xi.
ac A total of >300 Patski nuclei were scored per cell type over 3 independent experiments; significance was determined by one-sided Fisher exact test; bar plots are presented as mean values ± SEM; scale bars represent 10 µm. a Examples of nuclei after Xist RNA-FISH (green) and Hoechst 33342 staining (blue). The bar plot shows no significant differences among cell lines. b Examples of nuclei after H3K27me3 immunostaining (red) and Hoechst 33342 staining (blue). The bar plot shows significantly fewer nuclei with a H3K27me3 cluster in ΔFirreXa versus WT (p value = 4.63688e-94), but no change in ΔFirreXi nor InvFirreXi. c Examples of nuclei after macroH2A.1 or H2AK119ubi (red) immunostaining and Hoechst 33342 staining (blue). The bar plots show no significant differences between cell types. d Profiles of H3K27me3 ChIP-seq reads along the Xi in WT (blue), ΔFirreXa (red), and log2 ratio ΔFirreXa/WT (green). Box plots (log2) of H3K27me3 ChIP-seq reads in 100 bp Xi bins show a significantly lower median in ΔFirreXa (red) versus WT (blue) (Wilcoxon test: p value = 2.2e-16). The boxes demarcate the interquartile range (IQR) with median; whiskers ±1.5 times the IQR; outliers plotted as points. e Density histograms of the distribution of allelic proportions (Xa/(Xa+Xi)) of H3K27me3 peaks show a shift for the X chromosomes due to lower H3K27me3 on the Xi in ΔFirreXa (red) compared to WT (blue) (Wilcoxon test: −log10P = inf). f Heatmaps of H3K27me3 ChIP-seq reads 3 kb around transcription start sites (TSS) of genes on the Xi in ΔFirreXa versus WT. g. Metagene plots of average H3K27me3 occupancy at X-linked genes ((TSS to termination site (TES), not at scale)) in ΔFirreXa (Xi red Xa pink) versus WT (Xi blue, Xa purple). h Density histograms of the distribution of allelic proportions (Xa/(Xa+Xi)) of SUZ12 peaks show a shift for the X chromosomes due to lower SUZ12 on the Xi in ΔFirreXa (red) versus WT (blue) (Wilcoxon test: −log10P = 20.98). i Genome tracks demonstrating interactions between hnRNPK, EZH2, and SUZ12 with Firre RNA based on RIP-seq data in trophoblast and embryo stem cells,.
Fig. 3
Fig. 3. Dose-dependent effects of Firre RNA on H3K27me3 on the Xi in cell lines and in vivo.
a Percentage of nuclei with a H3K27me3 cluster after KD in Patski cells relative to Firre expression level measured by qRT-PCR in n = 3 biologically independent samples. Data presented as mean values ± SEM. b The level of CrossFirre expression is inversely related to that of Firre after Firre KD. Expression measured by qRT-PCR in n = 3 biologically independent samples. Data presented as mean values ± SEM. c, d A total of >300 Patski nuclei were scored per cell type over three independent experiments; significance was determined by one-sided Fisher exact test; bar plots are presented as mean values ± SEM; scale bars represent 10 µm. c Bar plots show significantly fewer H3K27me3 clusters after Firre KD in nuclei from three primary MEFs compared to mock treatment (p value = 2.89075e-12, 1.41519e-32, and 8.95838e-10, respectively). Primary MEFs were derived from a (BL6 × spretus) embryo with a spretus Xi, and from embryos either (BL6 × spretus) or (BL6 × castaneus) with random XCI (Table1). d Bar plots show a lower (but not significantly) percentage of H3K27me3 cluster in nuclei from MEFs derived from Firre+/− and Firre−/− KO embryos than in controls (p value = 0.0774 and 0.0567, respectively). No significant differences were found in brain, liver, and kidney from Firre KO mice compared to WT (p value = 0.9127, 0.8796, and 0.762, respectively). e Profiles of H3K27me3 ChIP-seq reads along the X chromosomes from CLPs and CD8 + T cells from WT (blue), Firre−/− (red), and log2 ratio Firre−/−/WT (green) show a significant decrease covering ~26 Mb around the Firre locus in mutant CLPs, and to a lesser extent CD8 + T cells (Supplementary Data 6). f Heatmaps of H3K27me3 ChIP-seq reads located 3 kb around the transcription start sites (TSS) of X-linked genes that map within the 26 Mb region around Firre in WT and Firre−/− CLPs and CD8 + T cells.
Fig. 4
Fig. 4. Ectopic expression of Firre/FIRRE RNA partially restore H3K27me3 on the Xi.
a Examples of nuclei after H3K27me3 immunostaining (red) and Hoechst 33342 staining (blue) in WT, ΔFirreXa, and ΔFirreXa transfected with a mouse Firre transgene (ΔFirreXa+mtransgene) or a human FIRRE transgene (ΔFirreXa+htransgene). b The bar plot shows a significantly higher percentage of nuclei with a H3K27me3 cluster in cells with a mouse or human Firre/FIRRE transgene, compared to ΔFirreXa (p value = 2.8075e-16 and 0.0000134599, respectively). c Examples of nuclei after RNA-FISH for Xist (green) and Firre (red) in a ΔFirreXa+mtransgene cell clone with high expression of the mouse transgene. The upper two nuclei show association between Firre and Xist signals (seen in 15% of nuclei), and the lower nuclei, lack of association. d The bar plot shows the percentage of nuclei with a H3K27me3 cluster in MEFs derived from Firre+/− and Firre−/− females that harbor a doxycycline (Dox) inducible transgene (Firre+/− tg;rtTA; -Dox; Firre+/− tg;rtTA; +Dox; Firre−/− tg;rtTA; -Dox; Firre−/− tg;rtTA; +Dox), compared to WT and mutants. The percentage of nuclei with a H3K27me3 cluster increases significantly in Firre+/− tg;rtTA and Firre−/− tg;rtTA MEFs after addition of doxycycline (Dox+) (p value=4.31567e-30 and 3.51193e-20, respectively). A total of >300 nuclei scored for the presence of a H3K27me3 cluster (a, b, d), or for Xist and Firre RNA-FISH signals (c) per cell type over three independent experiments; significance was determined by one-sided Fisher exact test; bar plots are presented as mean values ± SEM; scale bars represent 10 µm.
Fig. 5
Fig. 5. Firre RNA acts in trans to maintain Xi location.
ac A total of >300 nuclei per cell type over 3 independent experiments were scored for the location of the Xi marked by a H3K27me3 cluster or an Xist cloud relative to the nuclear periphery or the nucleolus; significance was determined by one-sided Fisher exact test; bar plots are presented as mean values ± SEM; scale bars represent 10 µm. a Examples of nuclei after H3K27me3 immunostaining (red) to locate the Xi in WT, ΔFirreXi, and InvFirreXi, or Xist RNA-FISH (red) to locate the Xi in ΔFirreXa since there is no H3K27me3 cluster in these nuclei. Nuclei were also immunostained for NPM1 (green) to locate the nucleolus. b Bar plots show a significant decrease in periphery- and nucleolus association of the Xi in ΔFirreXa compared to WT (p value = 3.95632e-40 and 3.75497e-14, respectively), but no significant changes in ΔFirreXi and InvFirreXi (p value = 0.6968). Ectopic expression of a mouse transgene in ΔFirreXa+mtransgene partly rescues the Xi location to 41% at the periphery and 34% at the nucleolus (p value = 6.62701e-10 and 0.000265481, respectively). c Bar plots show a significant decrease in periphery- and nucleolus association of the Xi after Firre KD in primary MEFs derived from an F1 embryo (BL6 × spretus) (p value = 1.13757e-09 and 0.0000634923, respectively). d Density histograms of the distribution of allelic proportions (Xa/(Xa + Xi)) of CTCF peaks show a shift in the distribution for the X chromosomes due to a decrease in CTCF on the Xi in ΔFirreXa (red) compared to WT (blue). In ΔFirreXa+mtransgene (brown) this distribution becomes binomial due to partial restoration of CTCF on the Xi. e Plots of Xi-associated (common +Xi-specific) CTCF peak density (counts binned within 100 kb windows) along the Xi for WT (blue) and ΔFirreXa (red). To account for differences in the number of SNP-covered peaks due to sequencing depth, the binned counts are scaled by a factor obtained from the between-sample ratios of autosomal diploid SNP-covered peaks.
Fig. 6
Fig. 6. Loss of Firre RNA affects gene expression.
a Upregulated genes in ΔFirreXa and Gene Ontology (GO) term enrichment. The Venn diagram shows the number of upregulated genes in ΔFirreXa versus WT, and in ΔFirreXa versus ΔFirreXa+mtransgene, with the overlapping gene set representing upregulated genes in ΔFirreXa that are rescued by transgene expression. The scatter plot shows dysregulated genes in ΔFirreXa versus WT (grey), with genes rescued by reduced expression in ΔFirreXa+mtransgene versus ΔFirreXa (more than 2-fold; p value < 0.05 by the Wald test) highlighted in orange. The top 20 GO terms of overlapping upregulated genes in ΔFirreXa versus WT, which are rescued in ΔFirreXa+mtransgene are listed. The X-axis indicates the FDR (−log10). b Downregulated genes in ΔFirreXa and Gene Ontology (GO) term enrichment. The Venn diagram shows the number of downregulated genes in ΔFirreXa versus WT, and in ΔFirreXa versus ΔFirreXa+mtransgene, the overlapping gene set representing downregulated genes in ΔFirreXa that are rescued by transgene expression. The scatter plot shows dysregulated genes in ΔFirreXa versus WT (gray), with genes rescued by increased expression in ΔFirreXa+mtransgene versus ΔFirreXa (more than 2-fold; p value <0.05 by the Wald test) highlighted in blue. The top 20 GO terms of overlapping downregulated genes in ΔFirreXa versus WT, which are rescued in ΔFirreXa+mtransgene are listed. The X-axis indicates the FDR (−log10). c Xi-expression fold changes for genes that are subject to or escape XCI between ΔFirreXa and WT. Upregulated genes are in red and downregulated genes in green. To note, one upregulated gene and one gene subject to XCI are in gray, as they showed more than 2-fold change in expression but with a p value >0.05 by the Wald test in ΔFirreXa versus WT. Genes are ordered from centromere to telomere along the Xi.
Fig. 7
Fig. 7. Chromatin accessibility after allelic Firre deletions and a Firre/Dxz4 deletion.
a Density histograms of the distribution of allelic proportions (spretus/(spretus + BL6)) of ATAC peaks along the autosomes and the X chromosomes for WT (blue) and ΔFirreXa (red). No shift is observed (Wilcoxon test: −log10P = 32). b. Percentages of ATAC peaks along the autosomes and the X chromosomes classified as spretus-specific, BL6-specific, or both show no differences between WT (blue) and ΔFirreXa (red). c. Plots of Xi-associated (common +Xi-specific) ATAC peak density (counts binned within 500 kb windows) along the Xi show increased accessibility at the telomeric end of the Xi in ΔFirreXa (red) versus WT (blue). To account for differences in the number of SNP-covered peaks between samples due to sequencing depth, the binned counts are scaled by a factor obtained from the between-sample ratios of autosomal diploid SNP-covered peaks. d Density histograms of the distribution of allelic proportions (spretus/(spretus + BL6)) of ATAC peaks show a shift to a lower Xa/(Xa + Xi) ratio in the double-mutant ΔFirreXiDxz4Xi (purple), compared to ΔDxz4Xi (black) and ΔFirreXi (green), consistent with increased accessibility on the Xi (Wilcoxon test: −log10P = 35). e Percentages of ATAC peaks in ΔDxz4Xi (black), ΔFirreXi (green), and ΔFirreXiDxz4Xi (purple) along the autosomes and the X chromosomes classified as spretus-specific, BL6-specific, or both show an increase on the BL6 Xi in the double mutant.
Fig. 8
Fig. 8. Changes in the X 3D structure after Firre deletion or inversion.
a Pearson correlated-transformed differential contact maps of the Xi at 500 kb resolution highlight differences between ΔFirreXi and WT, and between InvFirreXi and WT. The color scale shows differential Pearson correlation values, with loss and gain of contacts in the mutants versus WT appearing blue and red, respectively. See text for description of changes. b Virtual 4 C plots derived from Hi-C data at 500 kb resolution using Firre as the viewpoint on the Xi in WT (blue), ΔFirreXi (green) and InvFirreXi (gray) show an increase in contacts between Firre and Dxz4 in InvFirreXi. c Pearson correlated-transformed differential contact maps of the Xa and Xi at 500 kb resolution to highlight differences between ΔFirreXa and WT. The color scale shows differential Pearson correlation values, with loss and gain of contacts in ΔFirreXa versus WT appearing blue and red, respectively. See text for description of changes. d Pearson correlated-transformed contact maps (40 kb resolution) of the Xa for 4 Mb around the Firre locus highlight the loss of the strong boundary between TADs on the Xa in ΔFirreXa versus WT (see Supplementary Fig. 7c for corresponding maps of the Xi).

Similar articles

Cited by

References

    1. Augui S, Nora EP, Heard E. Regulation of X-chromosome inactivation by the X-inactivation centre. Nat. Rev. Genet. 2011;12:429–442. doi: 10.1038/nrg2987. - DOI - PubMed
    1. Galupa R, Heard E. X-chromosome inactivation: a crossroads between chromosome architecture and gene regulation. Annu. Rev. Genet. 2018;52:535–566. doi: 10.1146/annurev-genet-120116-024611. - DOI - PubMed
    1. Engreitz JM, et al. The Xist lncRNA exploits three-dimensional genome architecture to spread across the X chromosome. Science. 2013;341:1237973. doi: 10.1126/science.1237973. - DOI - PMC - PubMed
    1. Simon MD, et al. High-resolution Xist binding maps reveal two-step spreading during X-chromosome inactivation. Nature. 2013;504:465–469. doi: 10.1038/nature12719. - DOI - PMC - PubMed
    1. Heard E, Disteche CM. Dosage compensation in mammals: fine-tuning the expression of the X chromosome. Genes Dev. 2006;20:1848–1867. doi: 10.1101/gad.1422906. - DOI - PubMed

Publication types

MeSH terms